Molecular Insights into the Binding of Linear Polyethylenimines and Single-Stranded DNA Using Raman Spectroscopy: A Quantitative Approach
- PMID: 36222425
- PMCID: PMC10413332
- DOI: 10.1021/acs.jpcb.2c04939
Molecular Insights into the Binding of Linear Polyethylenimines and Single-Stranded DNA Using Raman Spectroscopy: A Quantitative Approach
Abstract
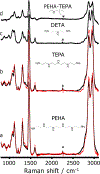
Establishing how polymeric vectors such as polyethylenimine (PEI) bind and package their nucleic acid cargo is vital toward developing more efficacious and cost-effective gene therapies. To develop a molecular-level picture of DNA binding, we examined how the Raman spectra of PEIs report on their local chemical environment. We find that the intense Raman bands located in the 1400-1500 cm-1 region derive from vibrations with significant CH2 scissoring and NH bending character. The Raman bands that derive from these vibrations show profound intensity changes that depend on both the local dielectric environment and hydrogen bonding interactions with the secondary amine groups on the polymer. We use these bands as spectroscopic markers to assess the binding between low molecular weight PEIs and single-stranded DNA (ssDNA). Analysis of the Raman spectra suggest that PEI primarily binds via electrostatic interactions to the phosphate backbone, which induces the condensation of the ssDNA. We additionally confirm this finding by conducting molecular dynamics simulations. We expect that the spectral correlations determined here will enable future studies to investigate important gene delivery activities, including how PEI interacts with cellular membranes to facilitate cargo internalization into cells.
Figures


Similar articles
-
New Insights into Quinine-DNA Binding Using Raman Spectroscopy and Molecular Dynamics Simulations.J Phys Chem B. 2018 Nov 1;122(43):9840-9851. doi: 10.1021/acs.jpcb.8b05795. Epub 2018 Oct 17. J Phys Chem B. 2018. PMID: 30336027 Free PMC article.
-
Differences in secondary structure between packaged and unpackaged single-stranded DNA of bacteriophage phi X174 determined by Raman spectroscopy: a model for phi X174 DNA packaging.Biochemistry. 1991 May 21;30(20):4855-63. doi: 10.1021/bi00234a004. Biochemistry. 1991. PMID: 1827990
-
A Raman spectroscopic study of the mono-hydrogen phosphate mineral dorfmanite Na2(PO3OH)·2H2O and in comparison with brushite.Spectrochim Acta A Mol Biomol Spectrosc. 2011 Nov;82(1):132-6. doi: 10.1016/j.saa.2011.07.015. Epub 2011 Jul 26. Spectrochim Acta A Mol Biomol Spectrosc. 2011. PMID: 21816666
-
Recent developments in nucleic acid delivery with polyethylenimines.Adv Genet. 2014;88:263-88. doi: 10.1016/B978-0-12-800148-6.00009-2. Adv Genet. 2014. PMID: 25409609 Review.
-
Polyethylenimines for in vivo gene delivery.Curr Opin Mol Ther. 2001 Apr;3(2):178-82. Curr Opin Mol Ther. 2001. PMID: 11338931 Review.
Cited by
-
Revealing two distinct molecular binding modes in polyethyleneimine-DNA polyplexes using infrared spectroscopy.Soft Matter. 2025 May 28;21(21):4192-4200. doi: 10.1039/d5sm00213c. Soft Matter. 2025. PMID: 40326406 Free PMC article.
-
Low-frequency Raman spectra of amyloid fibrils.J Chem Phys. 2025 Jun 7;162(21):215101. doi: 10.1063/5.0260500. J Chem Phys. 2025. PMID: 40459359
-
Carbon Nanodisks Decorated with Guanidinylated Hyperbranched Polyethyleneimine Derivatives as Efficient Antibacterial Agents.Nanomaterials (Basel). 2024 Apr 13;14(8):677. doi: 10.3390/nano14080677. Nanomaterials (Basel). 2024. PMID: 38668171 Free PMC article.
References
-
- Kumar R; Santa Chalarca CF; Bockman MR; Bruggen CV; Grimme CJ; Dalal RJ; Hanson MG; Hexum JK; Reineke TM Polymeric Delivery of Therapeutic Nucleic Acids. Chem. Rev. 2021, 121, 11527–11652. - PubMed
-
- Wong SY; Pelet JM; Putnam D Polymer systems for gene delivery–Past, present, and future. Prog. Polym. Sci. 2007, 32, 799–837.
-
- Van Bruggen C; Hexum JK; Tan Z; Dalal RJ; Reineke TM Nonviral Gene Delivery with Cationic Glycopolymers. Acc. Chem. Res. 2019, 52, 1347–1358. - PubMed
Publication types
MeSH terms
Substances
Grants and funding
LinkOut - more resources
Full Text Sources

