. 2022 Oct 12:11:e77340.
doi: 10.7554/eLife.77340.

Tumor elimination by clustered microRNAs miR-306 and miR-79 via noncanonical activation of JNK signaling

Affiliations

Tumor elimination by clustered microRNAs miR-306 and miR-79 via noncanonical activation of JNK signaling

Zhaowei Wang et al. Elife. .

Abstract

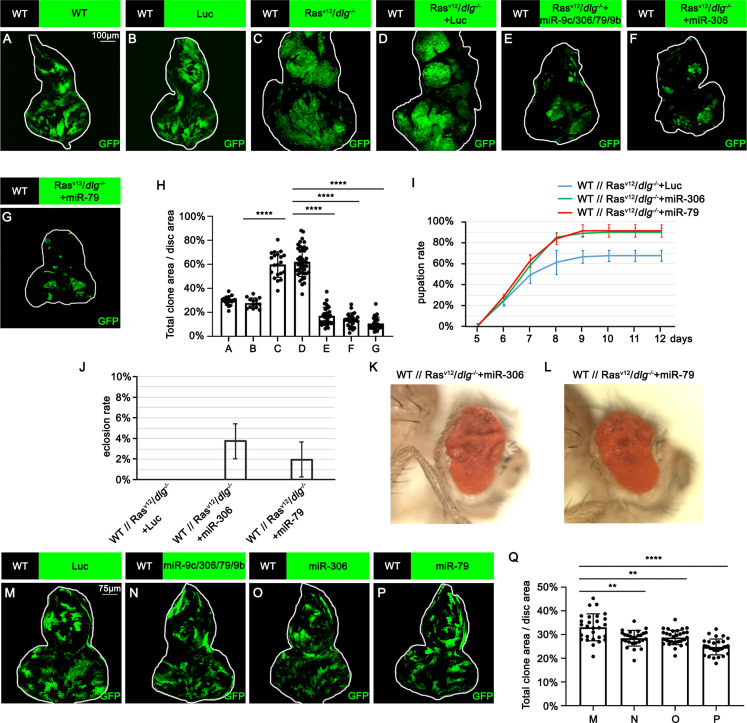
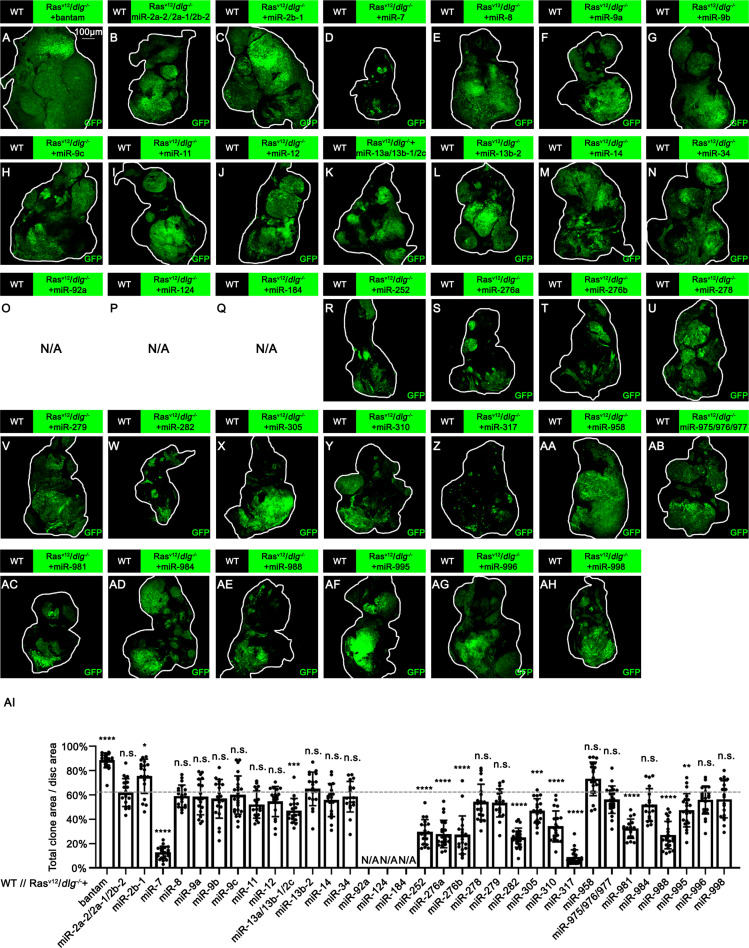
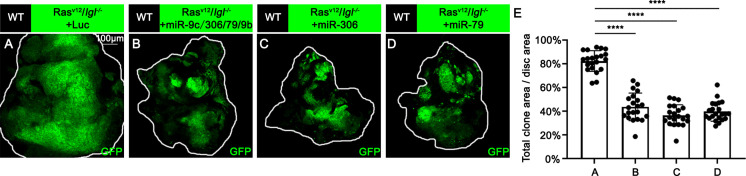
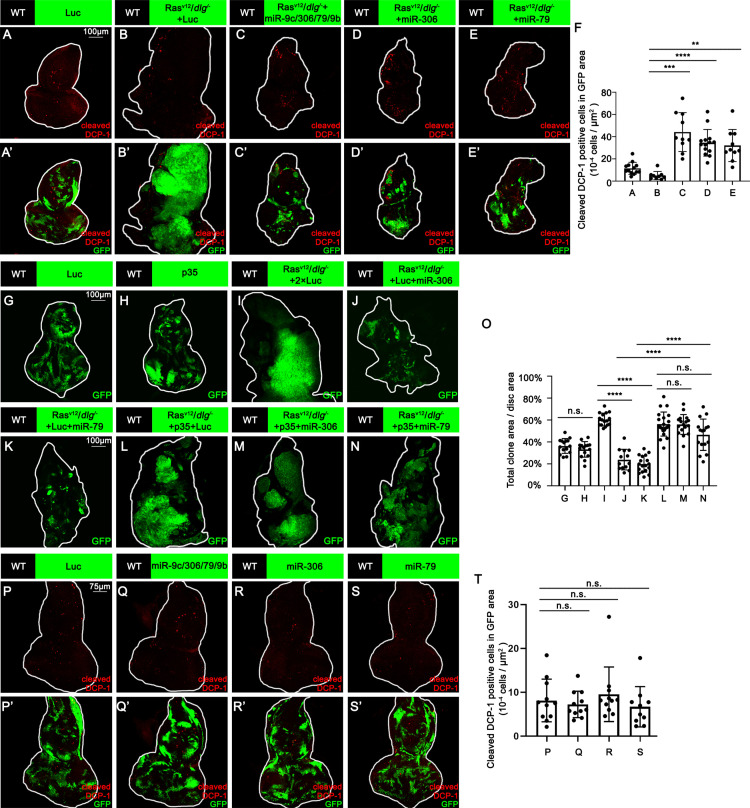
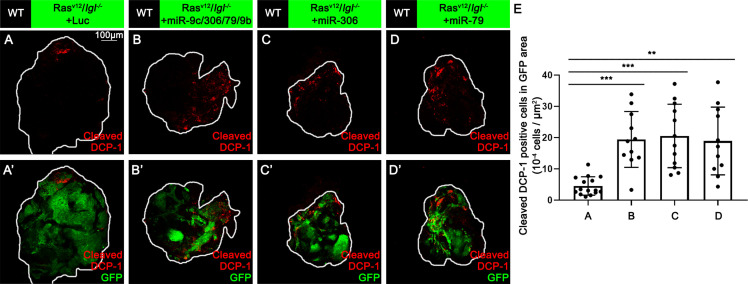
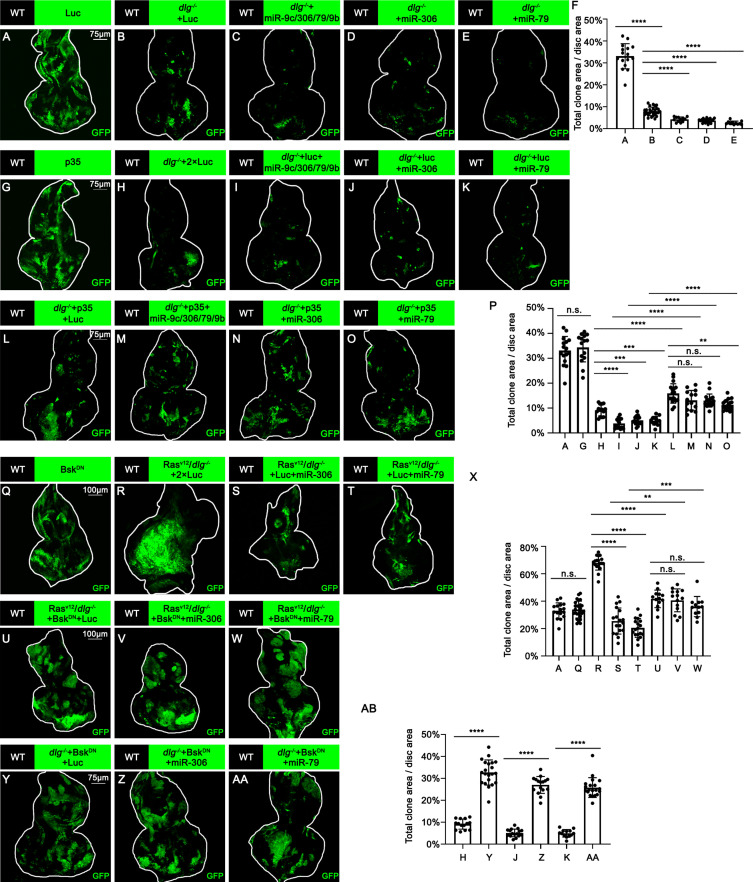
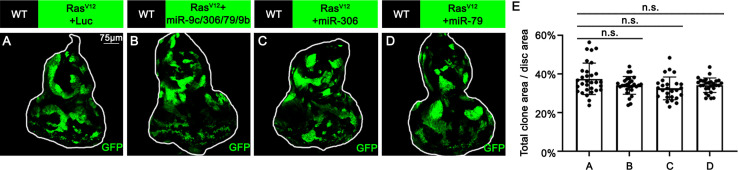
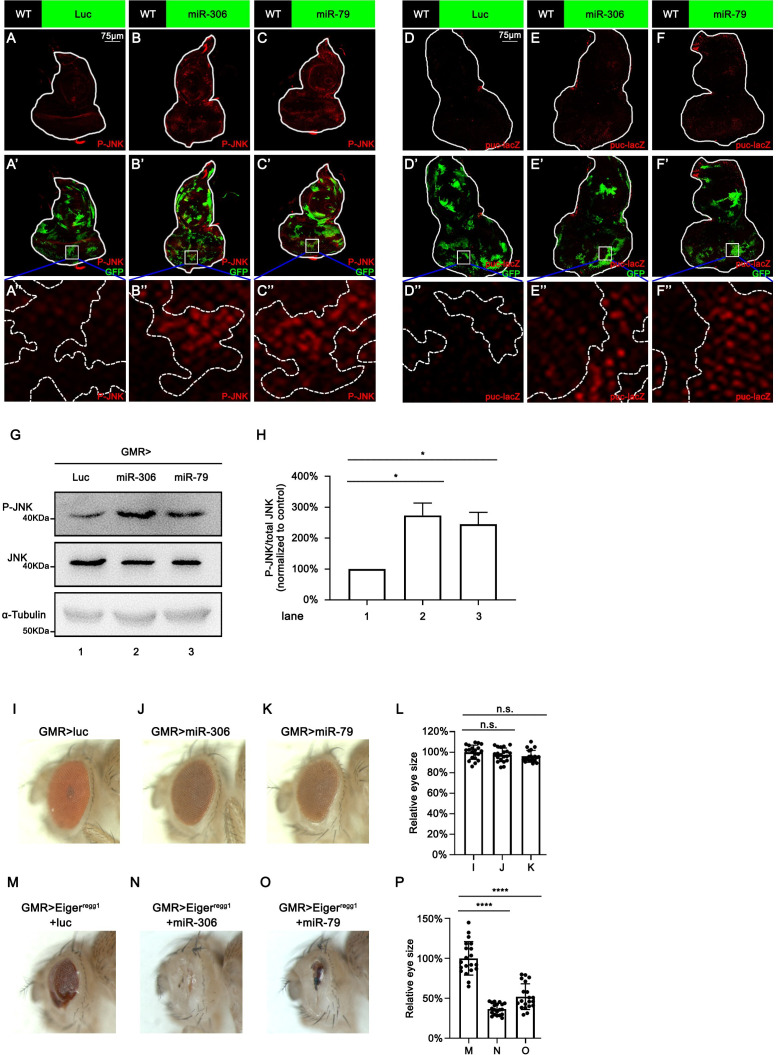
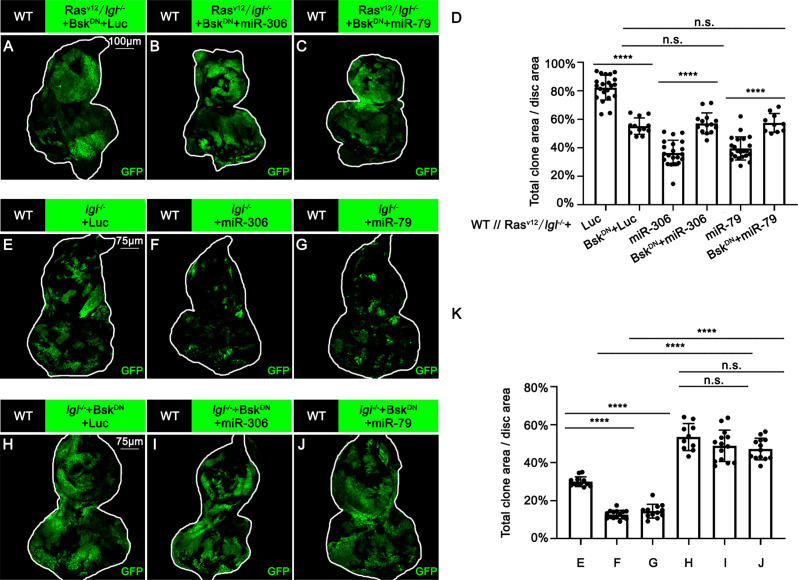
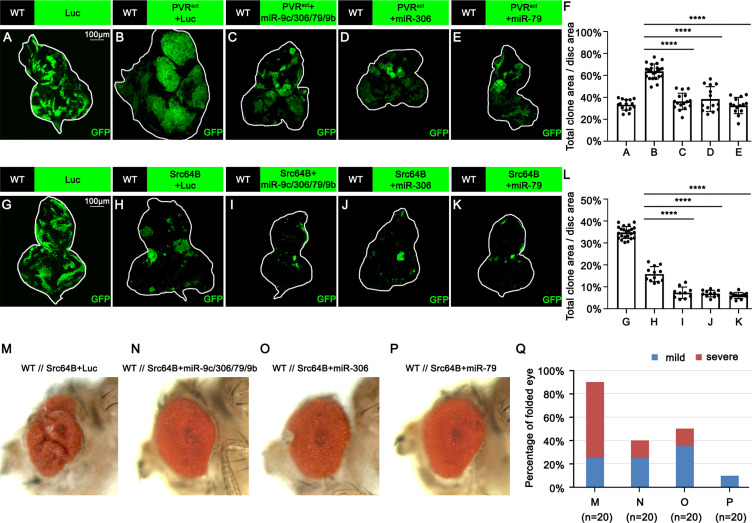
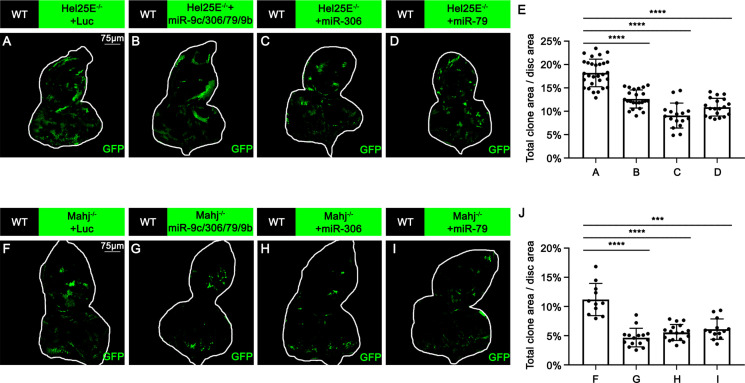
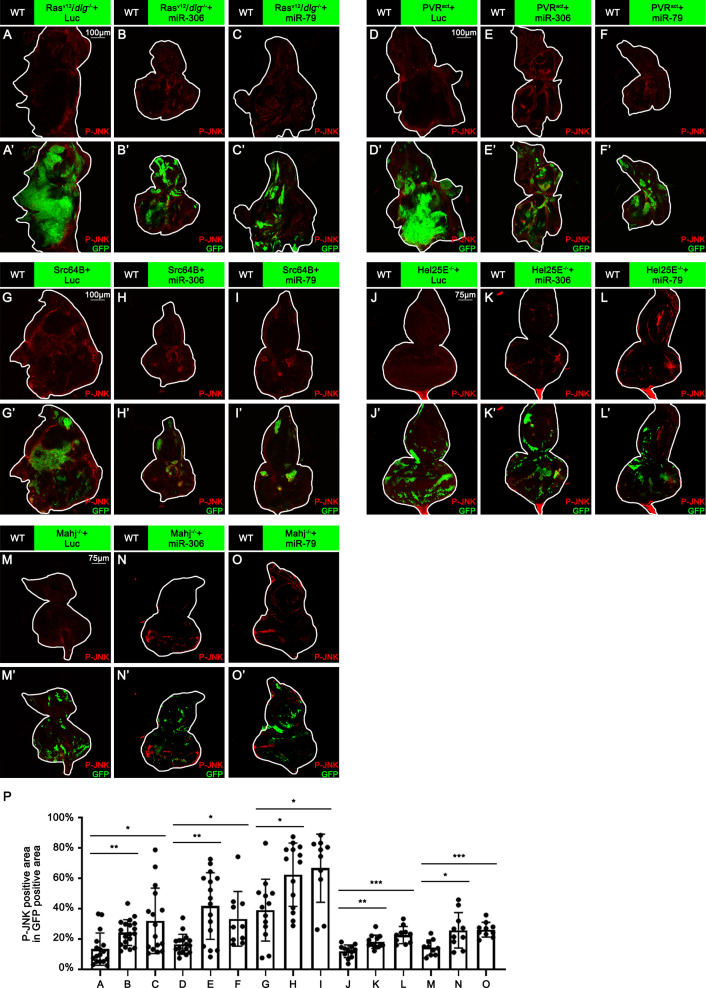
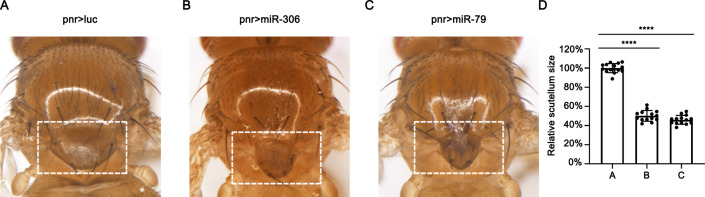
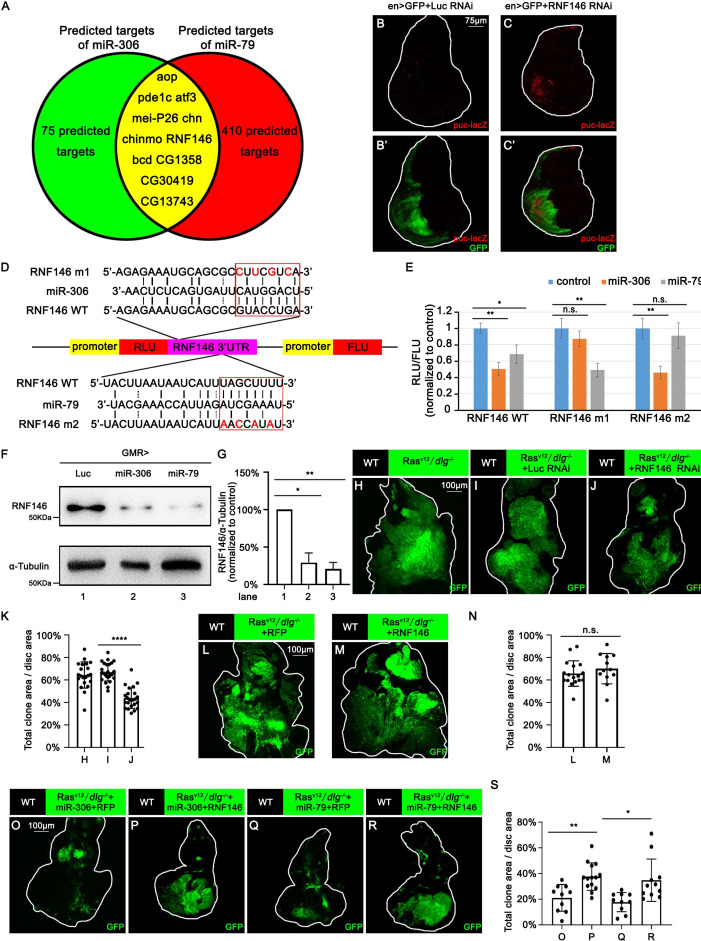
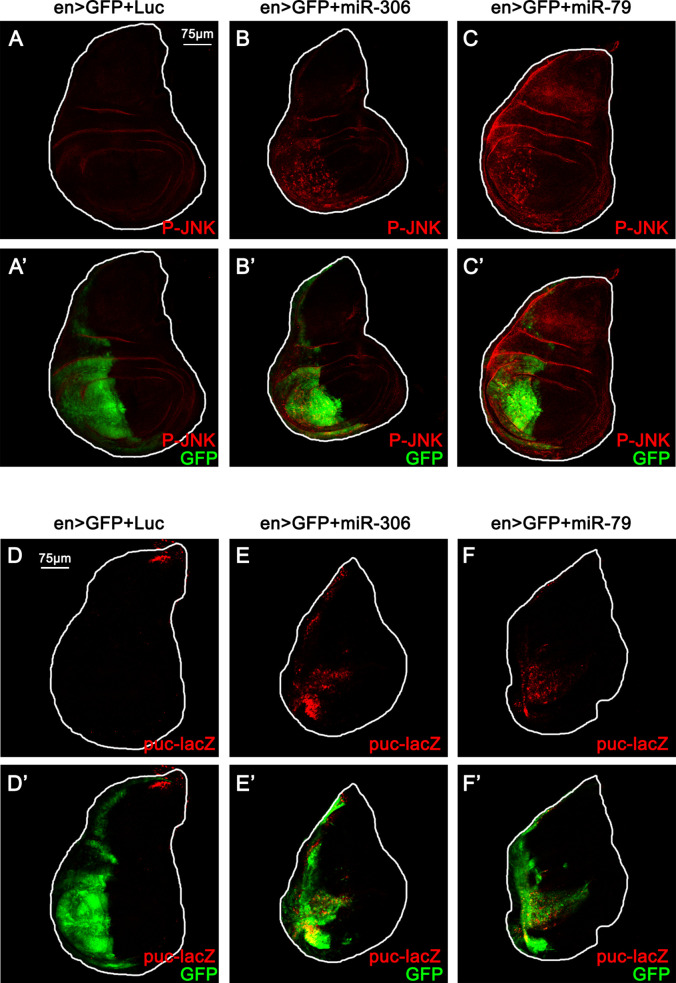
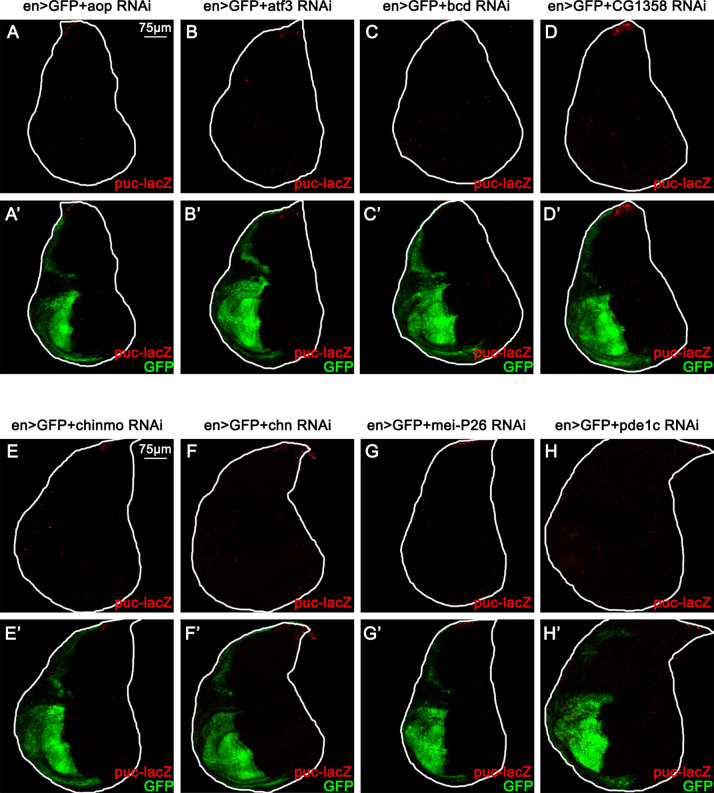
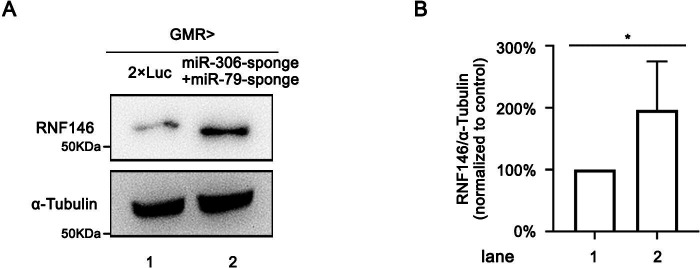
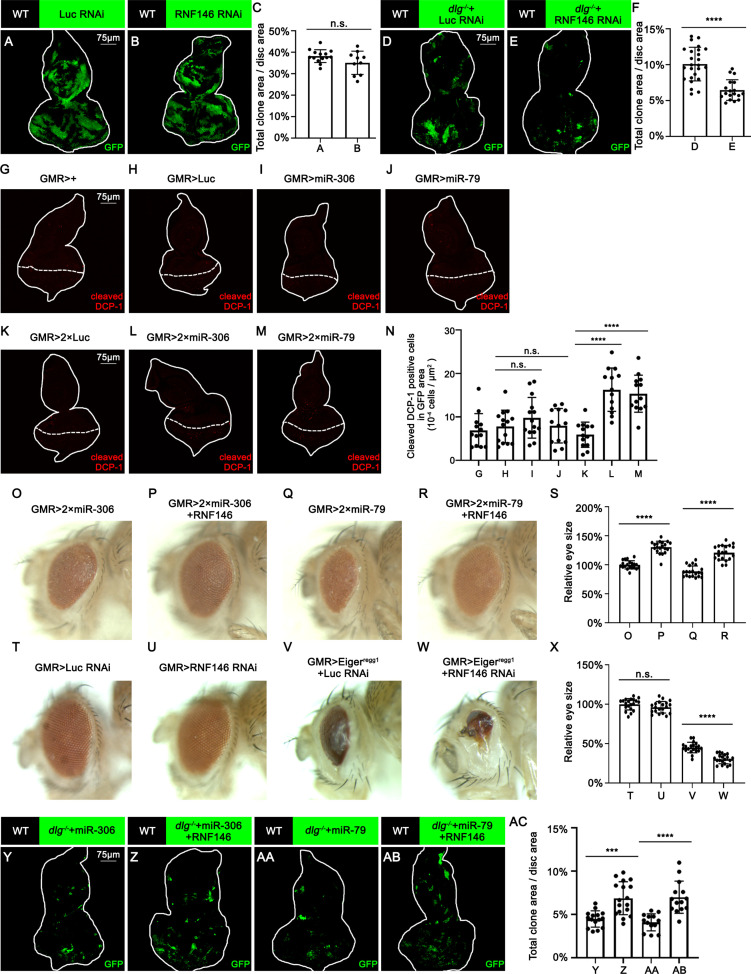
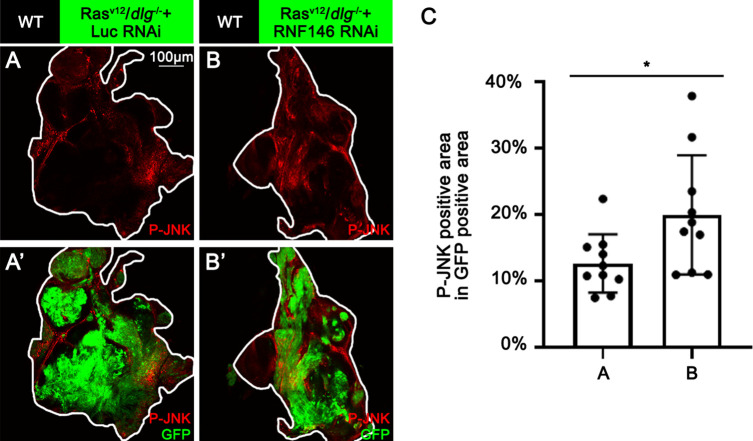
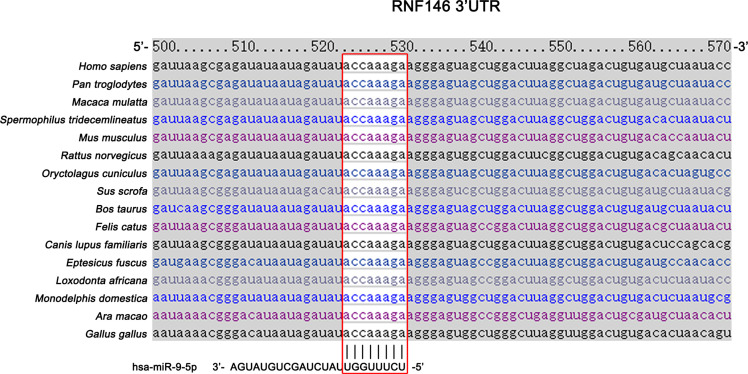
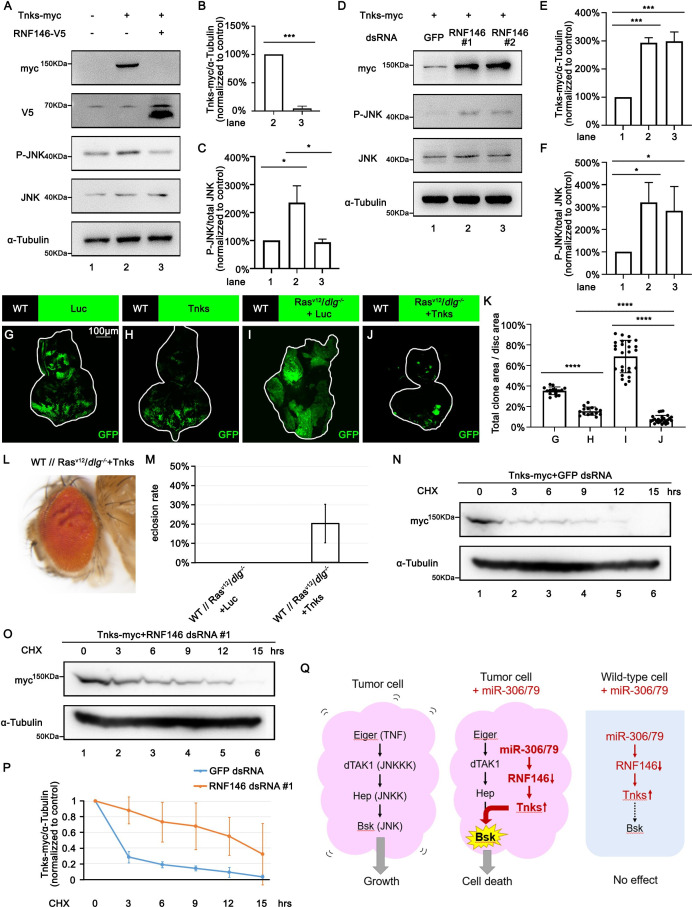
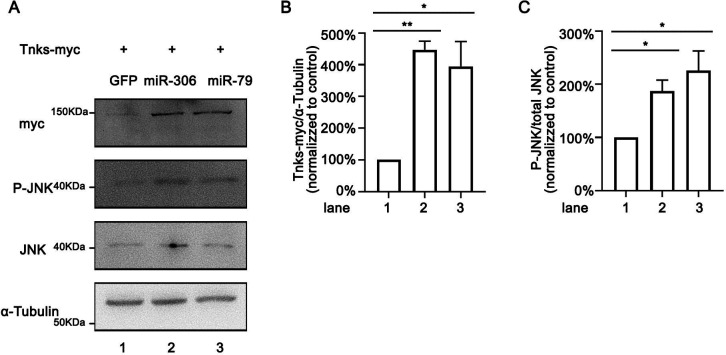
JNK signaling plays a critical role in both tumor promotion and tumor suppression. Here, we identified clustered microRNAs (miRNAs) miR-306 and miR-79 as novel tumor-suppressor miRNAs that specifically eliminate JNK-activated tumors in Drosophila. While showing only a slight effect on normal tissue growth, miR-306 and miR-79 strongly suppressed growth of multiple tumor models, including malignant tumors caused by Ras activation and cell polarity defects. Mechanistically, these miRNAs commonly target the mRNA of an E3 ubiquitin ligase ring finger protein 146 (RNF146). We found that RNF146 promotes degradation of tankyrase (Tnks), an ADP-ribose polymerase that promotes JNK activation in a noncanonical manner. Thus, downregulation of RNF146 by miR-306 and miR-79 leads to hyper-enhancement of JNK activation. Our data show that, while JNK activity is essential for tumor growth, elevation of miR-306 or miR-79 overactivate JNK signaling to the lethal level via noncanonical JNK pathway and thus eliminate tumors, providing a new miRNA-based strategy against cancer.

Keywords: D. melanogaster; JNK signaling; cell biology; cell death; microRNA; tumor suppression.


Conflict of interest statement

ZW, XX, JL, TI No competing interests declared

Figures

Figure 1.
Figure 1.. miR-306 and miR-79 suppress RasV12/dlg-/- tumor growth.
(A–G) Eye-antennal disc bearing GFP-labeled clones of indicated genotypes (A and B, 5 days after egg laying, C–G, 7 days after egg laying). (H) Quantification of clone size (% of total clone area per disc area in eye-antennal disc) in (A–G). Error bars, SD; ****p<0.0001 by one-way ANOVA multiple-comparison test. (I) Pupation rate of flies with indicated genotypes. Data from three independent experiment, n > 30 for each group in one experiment; error bars, SD. (J) Eclosion rate of flies with indicated genotypes. Data from three independent experiment, n > 30 for each group in one experiment; error bars, SD. (K, L) Adult eye phenotype of flies with indicated genotypes. (M–P) Eye-antennal disc bearing GFP-labeled clones of indicated genotypes (5 days after egg laying). (Q) Quantification of clone size (% of total clone area per disc area in eye-antennal disc) of (M–P). Error bars, SD; **p<0.01, ****,p<0.0001 by one-way ANOVA multiple-comparison test.
Figure 1—figure supplement 1.
Figure 1—figure supplement 1.. Effect of miRNAs or miRNA clusters on RasV12/dlg-/- tumor growth.
(A–AH) Eye-antennal disc bearing GFP-labeled clones of indicated genotypes (7 days after egg laying). (AI) Quantification of clone size (% of total clone area per disc area in eye-antennal disc) of (A–AH). The relative clone size of WT//Dlg-/-+RasV12+Luc (Figure 1D) is used as control in statistical analysis. The dashed horizontal line shows the relative clone size of WT//Dlg-/-+RasV12+Luc on average (comes from the quantified data in Figure 1H). Error bars, SD; n.s., p>0.05 (not significant), *p<0.05, **p<0.01, ***p<0.001, ****p<0.0001 by one-way ANOVA multiple-comparison test. N/A, no 7-day-old larva available.
Figure 1—figure supplement 2.
Figure 1—figure supplement 2.. miR-306 and miR-79 suppress RasV12/lgl-/- tumor growth.
(A–D) Eye-antennal disc bearing GFP-labeled clones of indicated genotypes (7 days after egg laying). (E) Quantification of clone size (% of total clone area per disc area in eye-antennal disc) of (A–D). Error bars, SD; ****p<0.0001 by one-way ANOVA multiple-comparison test.
Figure 2.
Figure 2.. miR-306 and mir-79 suppress RasV12/dlg-/- tumor growth by inducing apoptosis.
(A–E) Eye-antennal disc bearing GFP-labeled clones (A’-E’) of indicated genotypes stained with anti-cleaved Dcp-1 antibody (A-E and A’-E’, A, 5 days after egg laying, B–E, 7 days after egg laying). (F) Quantification of dying cells in GFP-positive clone area in (A–E). Error bars, SD; **p<0.01, ***p<0.001, ****p<0.0001 by one-way ANOVA multiple-comparison test. (G–N) Eye-antennal disc bearing GFP-labeled clones of indicated genotypes (G and H, 5 days after egg laying, I–N, 7 days after egg laying). (O) Quantification of clone size (% of total clone area per disc area in eye-antennal disc) of (G–N). Error bars, SD; n.s., p>0.05 (not significant), ****p<0.0001 by one-way ANOVA multiple-comparison test. (P–S) Eye-antennal disc bearing GFP-labeled clones (P’-S’) of indicated genotypes stained with anti-cleaved Dcp-1 antibody (P-S and P’-S’, 5 days after egg laying). (T) Quantification of dying cells in GFP-positive clone area in (P–S). Error bars, SD; n.s., p>0.05 (not significant) by one-way ANOVA multiple-comparison test.
Figure 2—figure supplement 1.
Figure 2—figure supplement 1.. miR-306 and miR-79 induce apoptosis in RasV12/lgl-/- tumors.
(A–D) Eye-antennal disc bearing GFP-labeled clones (A’-D’) of indicated genotypes stained with anti-cleaved Dcp-1 antibody (A-D and A’-D’, 7 days after egg laying). (E) Quantification of dying cells in GFP-positive clone area in (A–D). Error bars, SD; **p<0.01, ***p<0.001 by one-way ANOVA multiple-comparison test.
Figure 3.
Figure 3.. miR-306 and mir-79 suppress tumor growth and promote cell competition by promoting JNK signaling.
(A–E) Eye-antennal disc bearing GFP-labeled clones of indicated genotypes (5 days after egg laying). (F) Quantification of clone size (% of total clone area per disc area in eye-antennal disc) of (A–E). Error bars, SD; ****p<0.0001 by one-way ANOVA multiple-comparison test. (G–O) Eye-antennal disc bearing GFP-labeled clones of indicated genotypes (5 days after egg laying). (P) Quantification of clone size (% of total clone area per disc area in eye-antennal disc) of (A, G–O). Error bars, SD; n.s., p>0.05 (not significant), **p<0.01, ***p<0.001, ****p<0.0001 by one-way ANOVA multiple-comparison test. (Q–W) Eye-antennal disc bearing GFP-labeled clones of indicated genotypes (Q, 5 days after egg laying, R–W, 7 days after egg laying). (X) Quantification of clone size (% of total clone area per disc area in eye-antennal disc) of (A, Q–W). Error bars, SD; n.s., p>0.05 (not significant), **p<0.01, ***p<0.001, ****p<0.0001 by one-way ANOVA multiple-comparison test. (Y–AA) Eye-antennal disc bearing GFP-labeled clones of indicated genotypes (5 days after egg laying). (AB) Quantification of clone size (% of total clone area per disc area in eye-antennal disc) of (H, J, K, Y–AA). Error bars, SD; ****p<0.0001 by one-way ANOVA multiple-comparison test.
Figure 3—figure supplement 1.
Figure 3—figure supplement 1.. miR-306 and miR-79 do not suppresses RasV12 tumor growth.
(A–D) Eye-antennal disc bearing GFP-labeled clones of indicated genotypes (7 days after egg laying). (E) Quantification of clone size (% of total clone area per disc area in eye-antennal disc) of (A–D). Error bars, SD; n.s., p>0.05 by one-way ANOVA multiple-comparison test.
Figure 3—figure supplement 2.
Figure 3—figure supplement 2.. miR-306 and miR-79 promote JNK signaling in the eye-antennal disc and adult eye.
(A–C) Eye-antennal disc bearing GFP-labeled clones (A’-C’) of indicated genotypes stained with anti-phospho-JNK antibody (A-C, A’-C’ and A’’-C’’, 5 days after egg laying). (D–F) Eye-antennal disc bearing GFP-labeled clones (D’-F’) of indicated genotypes in puc-lacZ background stained with anti-β-galactosidase antibody (D-F, D’-F’ and D’’-F’’, 5 days after egg laying). (G) Lysates of adult head of indicated genotypes were subjected to Western blots using indicated antibodies. (H) Quantification of relative P-JNK signaling in (G) from three independent experiments. Error bars, SD; *, p<0.05 by one-way ANOVA multiple-comparison test. (I–K) Adult eye phenotype of flies with indicated genotypes. (L) Quantification of adult eye size (normalized to control) of (I–K). Error bars, SD; n.s., p>0.05 by one-way ANOVA multiple-comparison test. (M–O) Adult eye phenotype of flies with indicated genotypes. (P) Quantification of adult eye size (normalized to control) of (M–O). Error bars, SD; ****p<0.0001 by one-way ANOVA multiple-comparison test.
Figure 3—figure supplement 3.
Figure 3—figure supplement 3.. miR-306 and miR-79 suppress RasV12/lgl-/- tumor growth by promoting JNK signaling.
(A–C) Eye-antennal disc bearing GFP-labeled clones of indicated genotypes (7 days after egg laying). (D) Quantification of clone size (% of total clone area per disc area in eye-antennal disc) of indicated genotypes. The quantified data in Figure 1—figure supplement 2E are used as control (columns 1, 3, and 5). Error bars, SD; n.s., p>0.05 (not significant), ****p<0.0001 by one-way ANOVA multiple-comparison test. (E–J) Eye-antennal disc bearing GFP-labeled clones of indicated genotypes (5 days after egg laying). (K) Quantification of clone size (% of total clone area per disc area in eye-antennal disc) of (E–J). Error bars, SD; n.s., p>0.05 (not significant), ****p<0.0001 by one-way ANOVA multiple-comparison test.
Figure 4.
Figure 4.. miR-306 and miR-79 suppress growth of multiple types of tumor models.
(A–E) Eye-antennal disc bearing GFP-labeled clones of indicated genotypes (A, 5 days after egg laying, B–E, 7 days after egg laying). (F) Quantification of clone size (% of total clone area per disc area in eye-antennal disc) of (A–E). Error bars, SD; ****p<0.0001 by one-way ANOVA multiple-comparison test. (G–K) Eye-antennal disc bearing GFP-labeled clones of indicated genotypes (G, 5 days after egg laying, H–K, 6 days after egg laying). (L) Quantification of clone size (% of total clone area per disc area in eye-antennal disc) of (G–K). Error bars, SD; ****p<0.0001 by one-way ANOVA multiple-comparison test. (M–P) Adult eye phenotype of flies with indicated genotypes. (Q) Quantification of percentage of folded eye in (M–P). n = 20 for each group.
Figure 4—figure supplement 1.
Figure 4—figure supplement 1.. miR-306 and miR-79 promote multiple types of cell competition.
(A–D) Eye-antennal disc bearing GFP-labeled clones of indicated genotypes (5 days after egg laying). (E) Quantification of clone size (% of total clone area per disc area in eye-antennal disc) of (A–D). Error bars, SD; ****p<0.0001 by one-way ANOVA multiple-comparison test. (F–I) Eye-antennal disc bearing GFP-labeled clones of indicated genotypes (5 days after egg laying). (J) Quantification of clone size (% of total clone area per disc area in eye-antennal disc) of (F–I). Error bars, SD; ***p<0.001, ****p<0.0001 by one-way ANOVA multiple-comparison test.
Figure 4—figure supplement 2.
Figure 4—figure supplement 2.. miR-306 and miR-79 enhance JNK signaling in multiple types of tumors or cell competition models.
(A–O) Eye-antennal disc bearing GFP-labeled clones (A’-O’) of indicated genotypes stained with anti-phospho-JNK antibody (A-O and A’-O’, A–F, 7 days after egg laying, GI, 6 days after egg laying, J–O, 5 days after egg laying). (P) Quantification of the p-JNK signaling (% P-JNK-positive area in GFP-positive area) of (A–O). Error bars, SD; *p<0.05, **p<0.01, ***p<0.001 by one-way ANOVA multiple-comparison test.
Figure 4—figure supplement 3.
Figure 4—figure supplement 3.. miR-306 and miR-79 enhance normally occurring JNK activity.
(A–C) Adult scutellum phenotypes of flies with indicated genotypes. (D) Quantification of scutellum size of (A–C). Error bars, SD; ****p<0.0001 by one-way ANOVA multiple-comparison test.
Figure 5.
Figure 5.. miR-306 and mir-79 suppress tumor growth and promote cell competition by targeting RNF146.
Predicted targets of miR-306 and miR-79. (B, C) Wing disc of indicated genotypes with puc-lacZ background stained with anti-β-galactosidase antibody (B,C and B’, C’, 5 or 6 days after egg laying). (D) Schematic of the wild-type and mutation-type 3′UTR vector with miRNA binding sites for miR-306 and miR-79, respectively. Red letters shows the mutation sites. Red box shows the seed sequence pairing region. (E) RLU/FLU rate from dual-luciferase assay. n = 3, error bars, SD; n.s., p>0.05 (not significant), **p<0.01 by two-tailed Student’s t-test. (F) Lysates of adult heads of indicated genotypes were subjected to Western blots using indicated antibodies. (G) Quantification of relative levels of RNF146 protein in (F) from three independent experiments. Error bars, SD; *p<0.05, **p<0.01 by one-way ANOVA multiple-comparison test. (H–J) Eye-antennal disc bearing GFP-labeled clones of indicated genotypes (7 days after egg laying). (K) Quantification of clone size (% of total clone area per disc area in eye-antennal disc) of (H–J). Error bars, SD; ****p<0.0001 by two-tailed Student’s t-test. (L–M) Eye-antennal disc bearing GFP-labeled clones of indicated genotypes (7 days after egg laying). (N) Quantification of clone size (% of total clone area per disc area in eye-antennal disc) of (L–M). Error bars, SD; n.s., p>0.05 (not significant) by two-tailed Student’s t-test. (O–R) Eye-antennal disc bearing GFP-labeled clones of indicated genotypes (7 days after egg laying). (S) Quantification of clone size (% of total clone area per disc area in eye-antennal disc) of (O–R). Error bars, SD; *p<0.05, **p<0.01 by one-way ANOVA multiple-comparison test.
Figure 5—figure supplement 1.
Figure 5—figure supplement 1.. miR-306 and miR-79 promote JNK signaling in the wing disc.
(A–C) Wing disc of indicated genotypes stained with anti-phospho-JNK antibody (A-C and A’-C’, 5 or 6 days after egg laying). (D–F) Wing disc of indicated genotypes with puc-lacZ background stained with anti-β-galactosidase antibody (D-F and D’-F’, 5 or 6 days after egg laying).
Figure 5—figure supplement 2.
Figure 5—figure supplement 2.. RNAis that target eight candidate genes do not induce JNK activation in the wing disc.
(A–H) Wing disc of indicated genotypes with puc-lacZ background stained with anti-β-galactosidase antibody (A-H and A’-H’, 5 or 6 days after egg laying).
Figure 5—figure supplement 3.
Figure 5—figure supplement 3.. Suppression of miR-306 and miR-79 functions promotes RNF146 protein level.
(A) Lysates of adult heads of indicated genotypes were subjected to Western blots using indicated antibodies. (B) Quantification of relative levels of RNF146 protein in (A) from three independent experiments. Error bars, SD; *p<0.05 by two-tailed Student’s t-test.
Figure 5—figure supplement 4.
Figure 5—figure supplement 4.. miR-306 and miR-79 promote cell competition by targeting RNF146.
(A, B) Eye-antennal disc bearing GFP-labeled clones of indicated genotypes (5 days after egg laying). (C) Quantification of clone size (% of total clone area per disc area in eye-antennal disc) of (A, B). Error bars, SD; n.s., p>0.05 (not significant) by two-tailed Student’s t-test. (D, E) Eye-antennal disc bearing GFP-labeled clones of indicated genotypes (5 days after egg laying). (F) Quantification of clone size (% of total clone area per disc area in eye-antennal disc) of (D, E). Error bars, SD; ****p<0.0001 by two-tailed Student’s t-test. (G–M) Eye-antennal disc bearing GFP-labeled clones of indicated genotypes stained with anti-cleaved Dcp-1 antibody (5 days after egg laying). (N) Quantification of dying cells in GMR-Gal4 expressing area in (G–M). Error bars, SD; n.s., p>0.05 (not significant), ****p<0.0001 by one-way ANOVA multiple-comparison test. (O–R) Adult eye phenotype of flies with indicated genotypes. (S) Quantification of adult eye size (normalized to control) of (O–R). Error bars, SD; ****p<0.0001 by one-way ANOVA multiple-comparison test. (T–W) Adult eye phenotype of flies with indicated genotypes. (X) Quantification of adult eye size (normalized to control) of (T–W). Error bars, SD; n.s., p>0.05 (not significant), ****p<0.0001 by one-way ANOVA multiple-comparison test. (Y–AB) Eye-antennal disc bearing GFP-labeled clones of indicated genotypes (5 days after egg laying). (AC) Quantification of clone size (% of total clone area per disc area in eye-antennal disc) of (Y–AB). Error bars, SD; ***p<0.001, ****p<0.0001 by one-way ANOVA multiple-comparison test.
Figure 5—figure supplement 5.
Figure 5—figure supplement 5.. Knocking down of RNF146 promotes JNK phosphorylation in RasV12/dlg-/- tumor.
(A, B) Eye-antennal disc bearing GFP-labeled clones (A’, B’) of indicated genotypes (A, B and A’, B’, 7 days after egg laying). (C) Quantification of P-JNK signaling (% P-JNK-positive area in GFP-positive area) of (A, B). Error bars, SD; *p<0.05 by two-tailed Student’s t-test.
Figure 5—figure supplement 6.
Figure 5—figure supplement 6.. miR-9 is predicted to target mammalian RNF146.
Schematic of the miRNA binding sites for miR-9. Red box shows the seed sequence pairing region.
Figure 6.
Figure 6.. RNF146 promotes poly-ubiquitination and degradation of Tnks.
(A) Drosophila S2 cells were transfected with plasmids expressing indicated proteins. Cell lysates were subjected to Western blots using indicated antibodies. (B) Quantification of relative Tnks-myc levels in (A) from three independent experiments. Error bars, SD; ***p<0.001 by two-tailed Student’s t-test. (C) Quantification of relative p-JNK levels in (A) from three independent experiments. Error bars, SD; *p<0.05 by one-way ANOVA multiple-comparison test. (D) Drosophila S2 cells were transfected with plasmid expressing indicated protein and dsRNA targeting indicated gene. (E, F) Quantification of relative Tnks-myc levels (E) and p-JNK (F) levels in (D) from three independent experiments. Error bars, SD; *p<0.05, ***p<0.001 by one-way ANOVA multiple-comparison test. (G–J) Eye-antennal disc bearing GFP-labeled clones of indicated genotypes (G, H, 5 days after egg laying, I, J, 7 days after egg laying). (K) Quantification of clone size (% of total clone area per disc area in eye-antennal disc) of (G–J). Error bars, SD; ****p<0.0001 by one-way ANOVA multiple-comparison test. (L) Adult eye phenotype of flies with indicated genotypes. (M) Eclosion rate of flies with indicated genotypes. Data from three independent experiment, n > 30 for each group in one experiment; error bars, SD. (N, O) Drosophila S2 cells were transfected with plasmid expressing indicated protein and dsRNA targeting indicated gene. After 36 hr, cells were treated with 50 μg/ml cycloheximide (CHX) for the indicated periods. Cell lysates were subjected to Western blots using indicated antibodies. (P) Quantification of relative Tnks-myc levels in (N, O) from three independent experiments. Error bars, SD. (Q) A model for tumor elimination by miR-306/79. Tumor cell with elevated canonical JNK signaling via Eiger/TNF, dTAK1/JNKKK, and Hep/JNKK grows in a Bsk/JNK-dependent manner. Overexpression of miR-306 or miR-79 in JNK-activated tumor cell results in overactivation of JNK signaling to the lethal level via RNF146-Tnks-mediated noncanonical JNK-activating signaling. Overexpression of miR-306 or miR-79 in normal cells has no significant effect on JNK signaling.
Figure 6—figure supplement 1.
Figure 6—figure supplement 1.. miR-306 and miR-79 increase Tnks protein level.
(A) Drosophila S2 cells were transfected with plasmids expressing indicated protein and miRNAs. Cell lysates were subjected to Western blots using indicated antibodies. (B, C) Quantification of relative levels of Tnks-myc (B) and p-JNK (C) in (A) from three independent experiments. Error bars, SD; *p<0.05, **p<0.01 by one-way ANOVA multiple-comparison test.

Similar articles

Cited by

References

    1. Adachi-Yamada T, Gotoh T, Sugimura I, Tateno M, Nishida Y, Onuki T, Date H. De novo synthesis of sphingolipids is required for cell survival by down-regulating c-Jun N-terminal kinase in Drosophila imaginal discs. Molecular and Cellular Biology. 1999;19:7276–7286. doi: 10.1128/MCB.19.10.7276. - DOI - PMC - PubMed
    1. Atkins M, Potier D, Romanelli L, Jacobs J, Mach J, Hamaratoglu F, Aerts S, Halder G. An ectopic network of transcription factors regulated by Hippo signaling drives growth and invasion of a malignant tumor model. Current Biology. 2016;26:2101–2113. doi: 10.1016/j.cub.2016.06.035. - DOI - PubMed
    1. Beg MS, Brenner AJ, Sachdev J, Borad M, Kang YK, Stoudemire J, Smith S, Bader AG, Kim S, Hong DS. Phase I study of MRX34, a liposomal miR-34a mimic, administered twice Weekly in patients with advanced solid tumors. Investigational New Drugs. 2017;35:180–188. doi: 10.1007/s10637-016-0407-y. - DOI - PMC - PubMed
    1. Bode AM, Dong Z. The functional contrariety of JNK. Molecular Carcinogenesis. 2007;46:591–598. doi: 10.1002/mc.20348. - DOI - PMC - PubMed
    1. Brumby AM, Richardson HE. Scribble mutants cooperate with oncogenic Ras or Notch to cause neoplastic overgrowth in Drosophila. The EMBO Journal. 2003;22:5769–5779. doi: 10.1093/emboj/cdg548. - DOI - PMC - PubMed

Publication types