One-Year Follow-Up of COVID-19 Patients Indicates Substantial Assay-Dependent Differences in the Kinetics of SARS-CoV-2 Antibodies
- PMID: 36222681
- PMCID: PMC9784763
- DOI: 10.1128/spectrum.00597-22
One-Year Follow-Up of COVID-19 Patients Indicates Substantial Assay-Dependent Differences in the Kinetics of SARS-CoV-2 Antibodies
Abstract
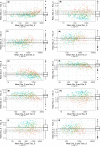
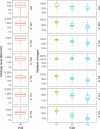
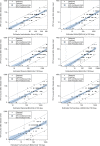
Determination of antibody levels against the nucleocapsid (N) and spike (S) proteins of severe acute respiratory syndrome coronavirus 2 (SARS-CoV-2) are used to estimate the humoral immune response after SARS-CoV-2 infection or vaccination. Differences in the design and specification of antibody assays challenge the interpretation of test results, and comparative studies are often limited to single time points per patient. We determined the longitudinal kinetics of antibody levels of 145 unvaccinated coronavirus disease 2019 (COVID-19) patients at four visits over 1 year upon convalescence using 8 commercial SARS-CoV-2 antibody assays (from Abbott, DiaSorin, Roche, Siemens, and Technoclone), as well as a virus neutralization test (VNT). A linear regression model was used to investigate whether antibody results obtained in the first 6 months after disease onset could predict the VNT results at 12 months. Spike protein-specific antibody tests showed good correlation to the VNT at individual time points (rS, 0.74 to 0.92). While longitudinal assay comparison with the Roche Elecsys anti-SARS-CoV-2 S test showed almost constant antibody concentrations over 12 months, the VNT and all other tests indicated a decline in serum antibody levels (median decrease to 14% to 36% of baseline). The antibody level at 3 months was the best predictor of the VNT results at 12 months after disease onset. The current standardization to a WHO calibrator for normalization to binding antibody units (BAU) is not sufficient for the harmonization of SARS-CoV-2 antibody tests. Assay-specific differences in absolute values and trends over time need to be considered when interpreting the course of antibody levels in patients. IMPORTANCE Determination of antibodies against SARS-CoV-2 will play an important role in detecting a sufficient immune response. Although all the manufacturers expressed antibody levels in binding antibody units per milliliter, thus suggesting comparable results, we found discrepant behavior between the eight investigated assays when we followed the antibody levels in a cohort of 145 convalescent patients over 1 year. While one assay yielded constant antibody levels, the others showed decreasing antibody levels to a varying extent. Therefore, the comparability of the assays must be improved regarding the long-term kinetics of antibody levels. This is a prerequisite for establishing reliable antibody level cutoffs for sufficient individual protection against SARS-CoV-2.
Keywords: SARS-CoV-2; antibody kinetics; assay comparison; neutralizing antibodies; predictive modelling.
Conflict of interest statement
The authors declare a conflict of interest. C.J.B.: Board member of Technoclone GmbH N.B.: employee of Technoclone GmbH, supply with Technoclone ELISA.
Figures


References
-
- COVID-19 dashboard by the Center for Systems Science and Engineering (CSSE) at the John Hopkins University (JHU). https://coronavirus.jhu.edu/map.html. Accessed 5 January 2022.
-
- Semmler G, Traugott MT, Graninger M, Hoepler W, Seitz T, Kelani H, Karolyi M, Pawelka E, Aragón de La Cruz S, Puchhammer-Stöckl E, Aberle SW, Stiasny K, Zoufaly A, Aberle JH, Weseslindtner L. 2021. Assessment of S1-, S2-, and NCP-specific IgM, IgA, and IgG antibody kinetics in acute SARS-CoV-2 infection by a microarray and twelve other immunoassays. J Clin Microbiol 59:e02890-20. doi: 10.1128/JCM.02890-20. - DOI - PMC - PubMed
-
- Ortega N, Ribes M, Vidal M, Rubio R, Aguilar R, Williams S, Barrios D, Alonso S, Hernández-Luis P, Mitchell RA, Jairoce C, Cruz A, Jimenez A, Santano R, Méndez S, Lamoglia M, Rosell N, Llupià A, Puyol L, Chi J, Melero NR, Parras D, Serra P, Pradenas E, Trinité B, Blanco J, Mayor A, Barroso S, Varela P, Vilella A, Trilla A, Santamaria P, Carolis C, Tortajada M, Izquierdo L, Angulo A, Engel P, García-Basteiro AL, Moncunill G, Dobaño C. 2021. Seven-month kinetics of SARS-CoV-2 antibodies and role of pre-existing antibodies to human coronaviruses. Nat Commun 12:4740. doi: 10.1038/s41467-021-24979-9. - DOI - PMC - PubMed
-
- Irsara C, Egger AE, Prokop W, Nairz M, Loacker L, Sahanic S, Pizzini A, Sonnweber T, Holzer B, Mayer W, Schennach H, Loeffler-Ragg J, Bellmann-Weiler R, Hartmann B, Tancevski I, Weiss G, Binder CJ, Anliker M, Griesmacher A, Hoermann G. 2021. Clinical validation of the Siemens quantitative SARS-CoV-2 spike IgG assay (sCOVG) reveals improved sensitivity and a good correlation with virus neutralization titers. Clin Chem Lab Med 59:1453–1462. doi: 10.1515/cclm-2021-0214. - DOI - PubMed
MeSH terms
Substances
LinkOut - more resources
Full Text Sources
Medical
Miscellaneous

