. 2022 Dec 16;82(24):4624-4640.
doi: 10.1158/0008-5472.CAN-22-0736.

PRC2-Mediated Epigenetic Suppression of Type I IFN-STAT2 Signaling Impairs Antitumor Immunity in Luminal Breast Cancer

Affiliations

PRC2-Mediated Epigenetic Suppression of Type I IFN-STAT2 Signaling Impairs Antitumor Immunity in Luminal Breast Cancer

Juyeong Hong et al. Cancer Res. .

Abstract

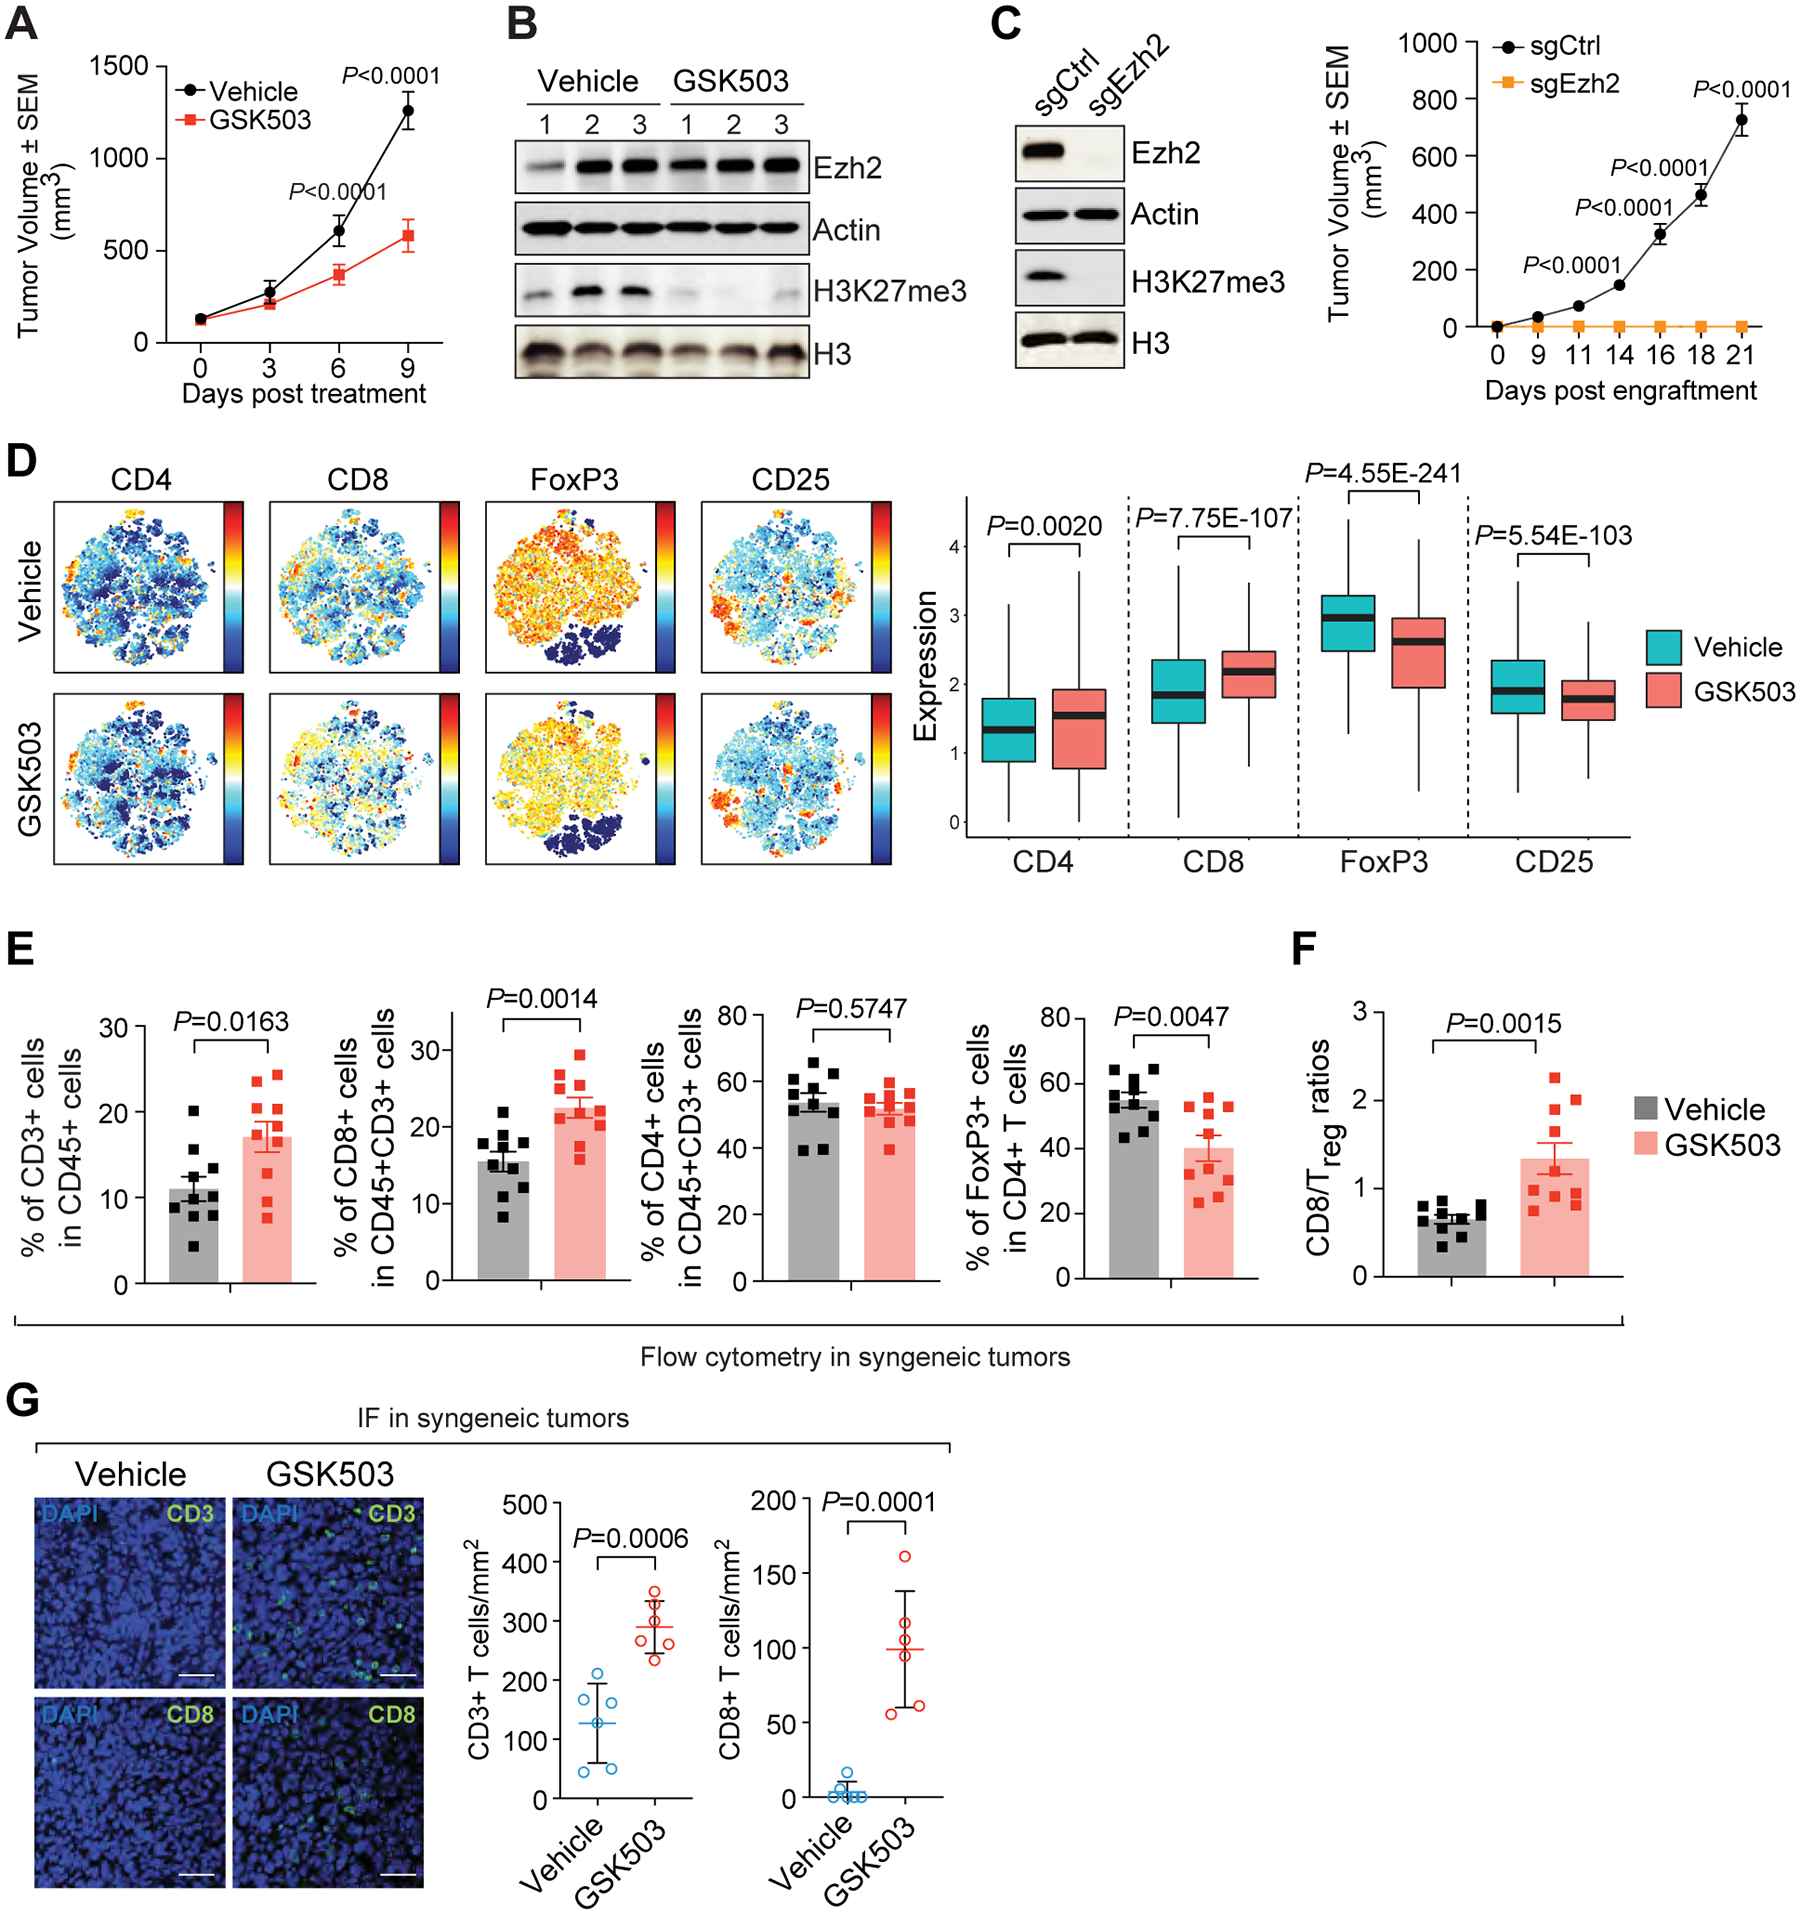
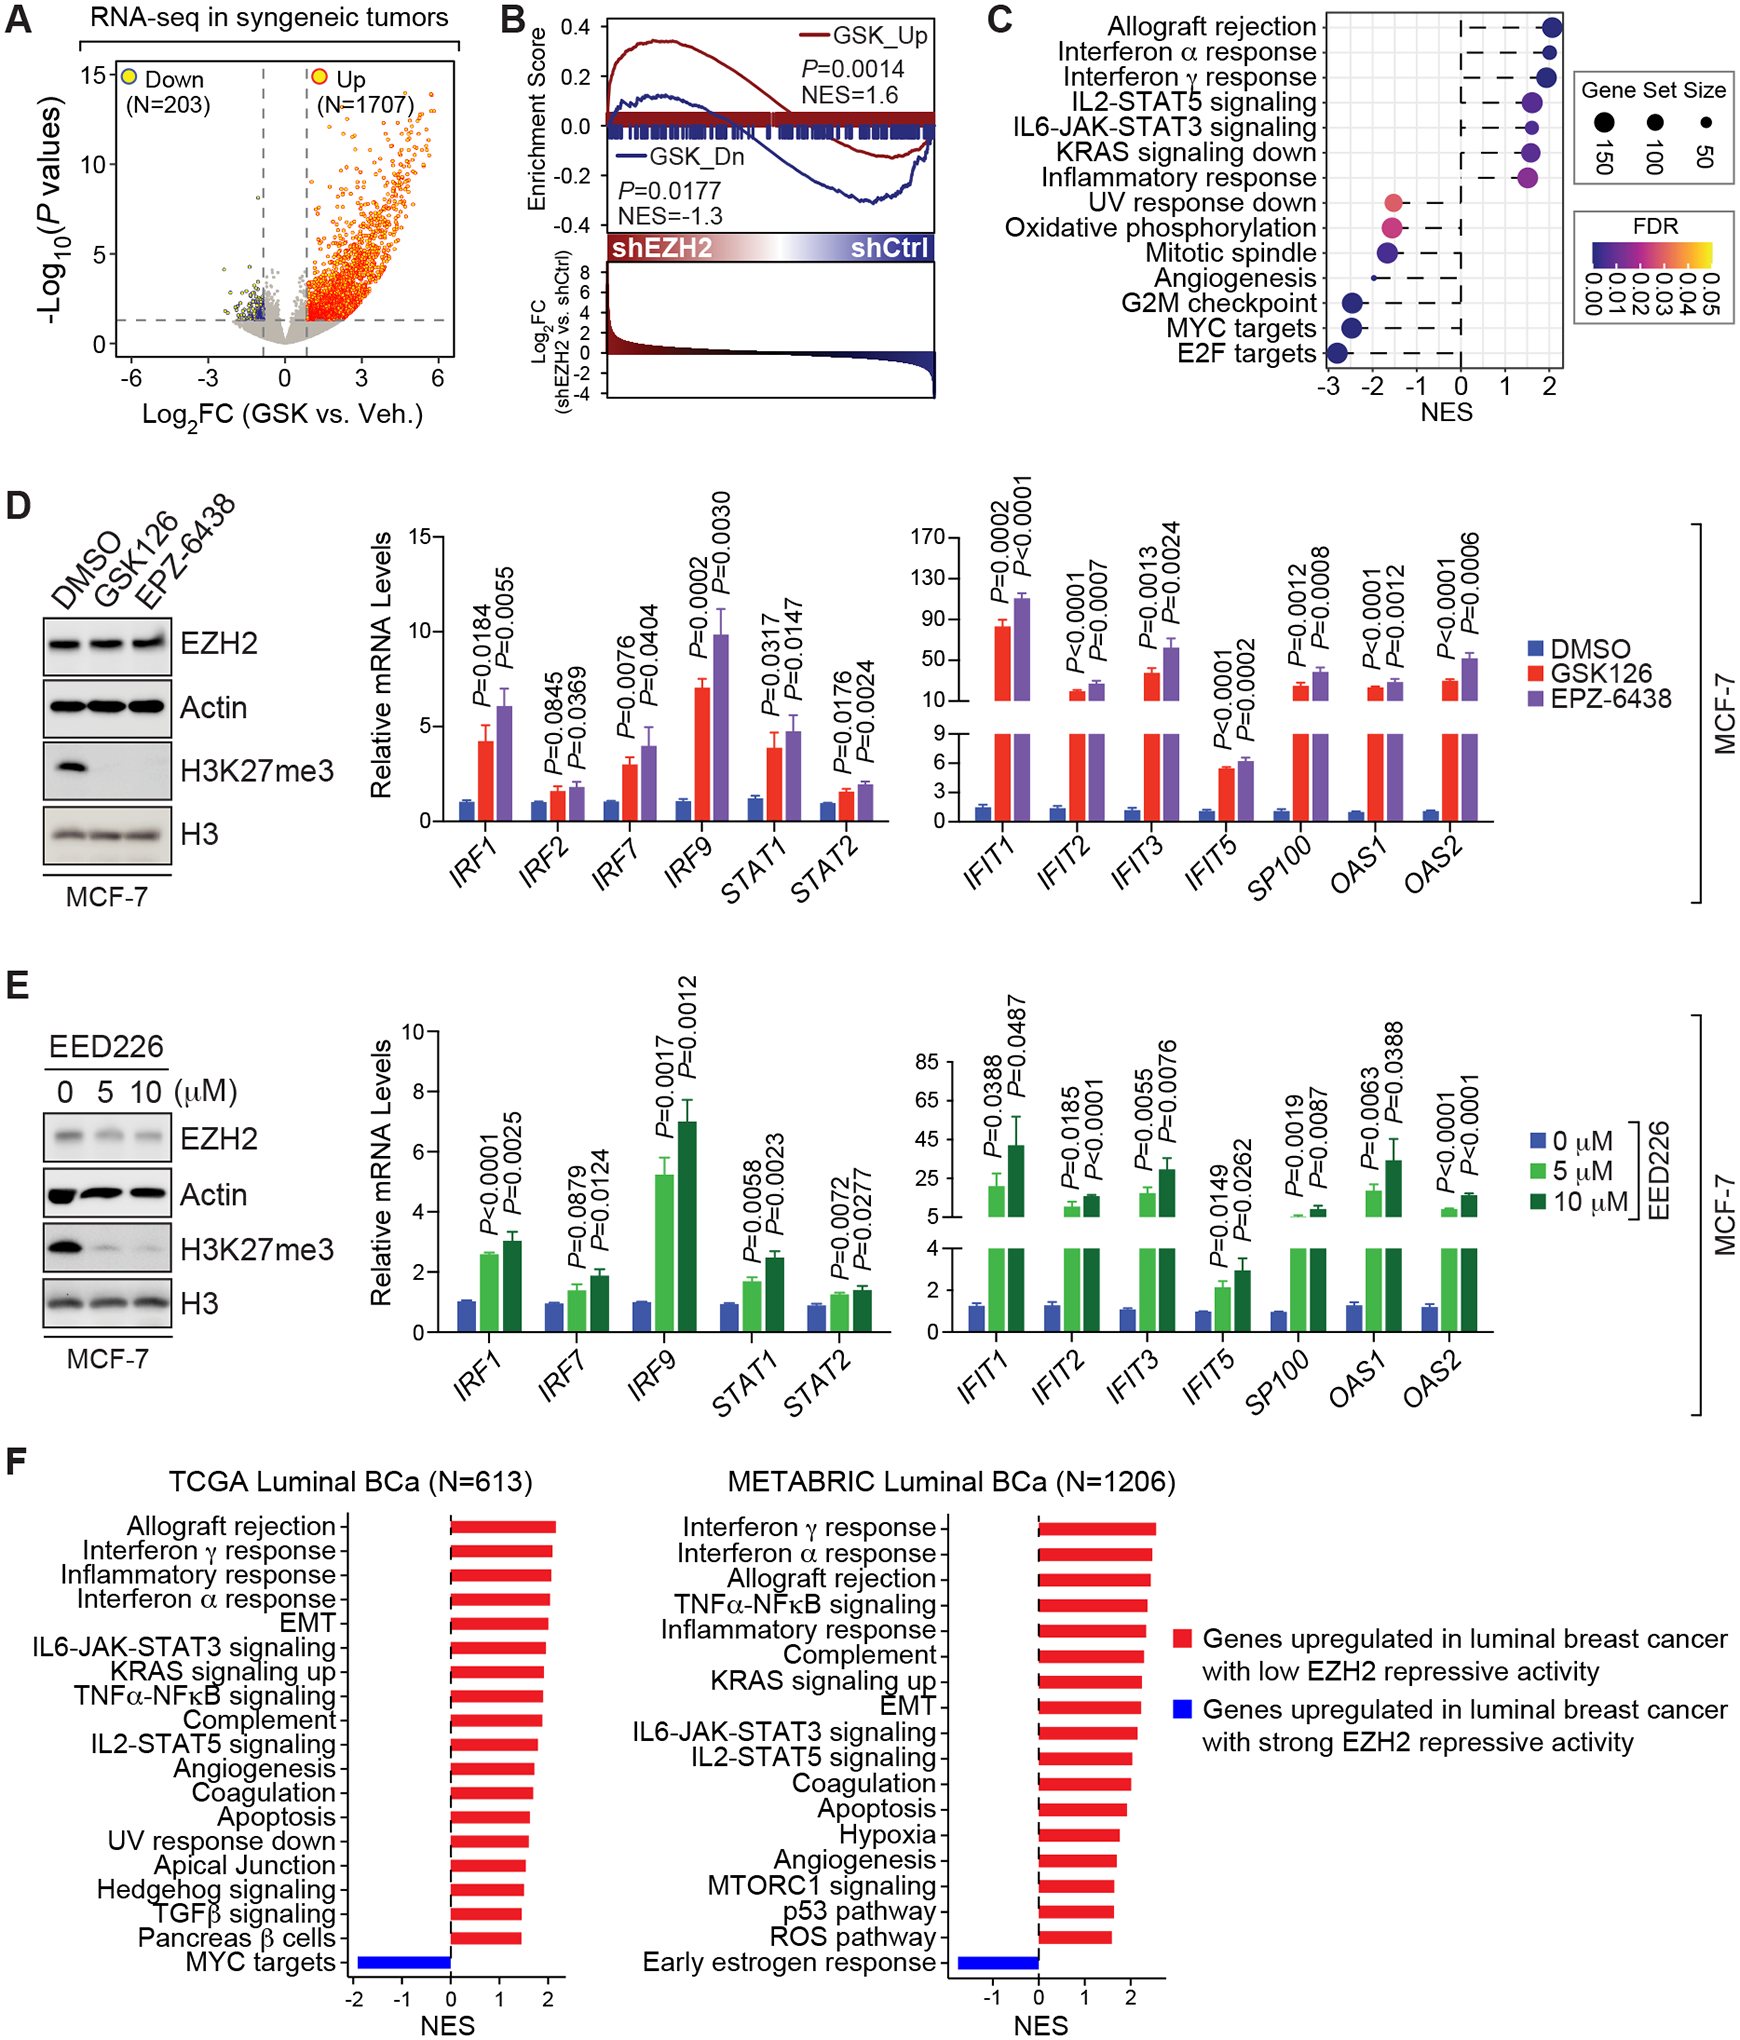
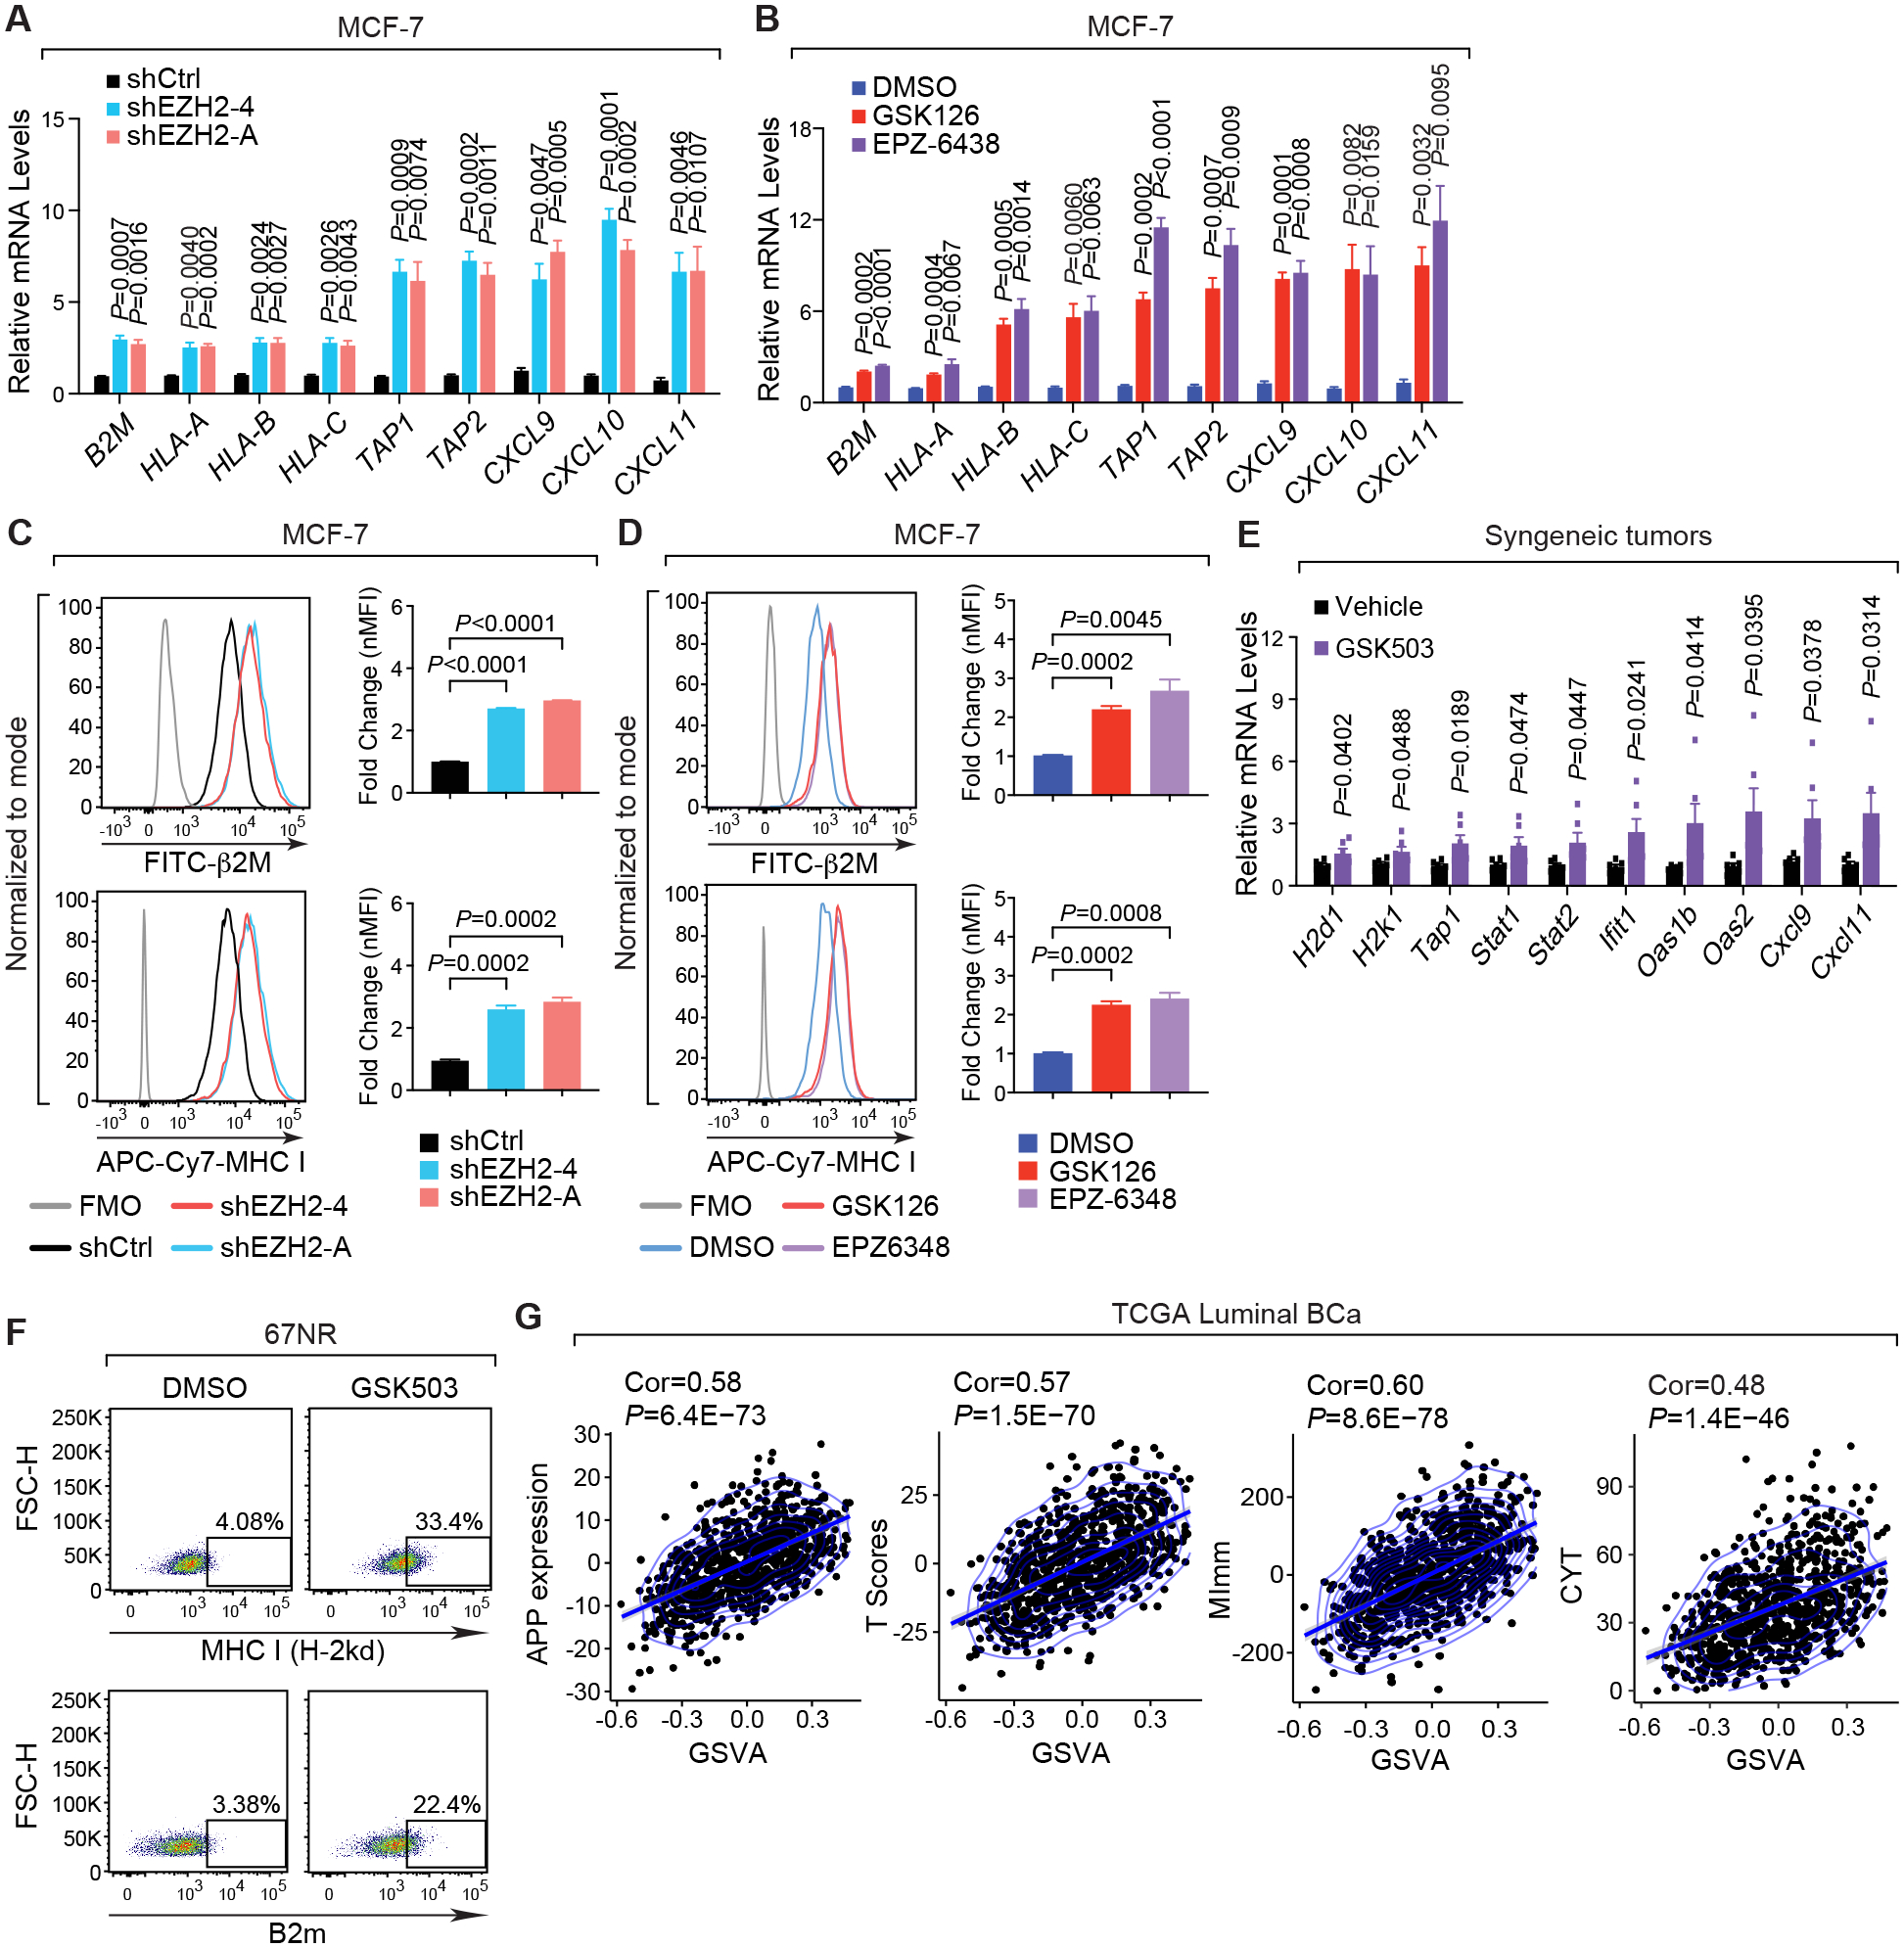
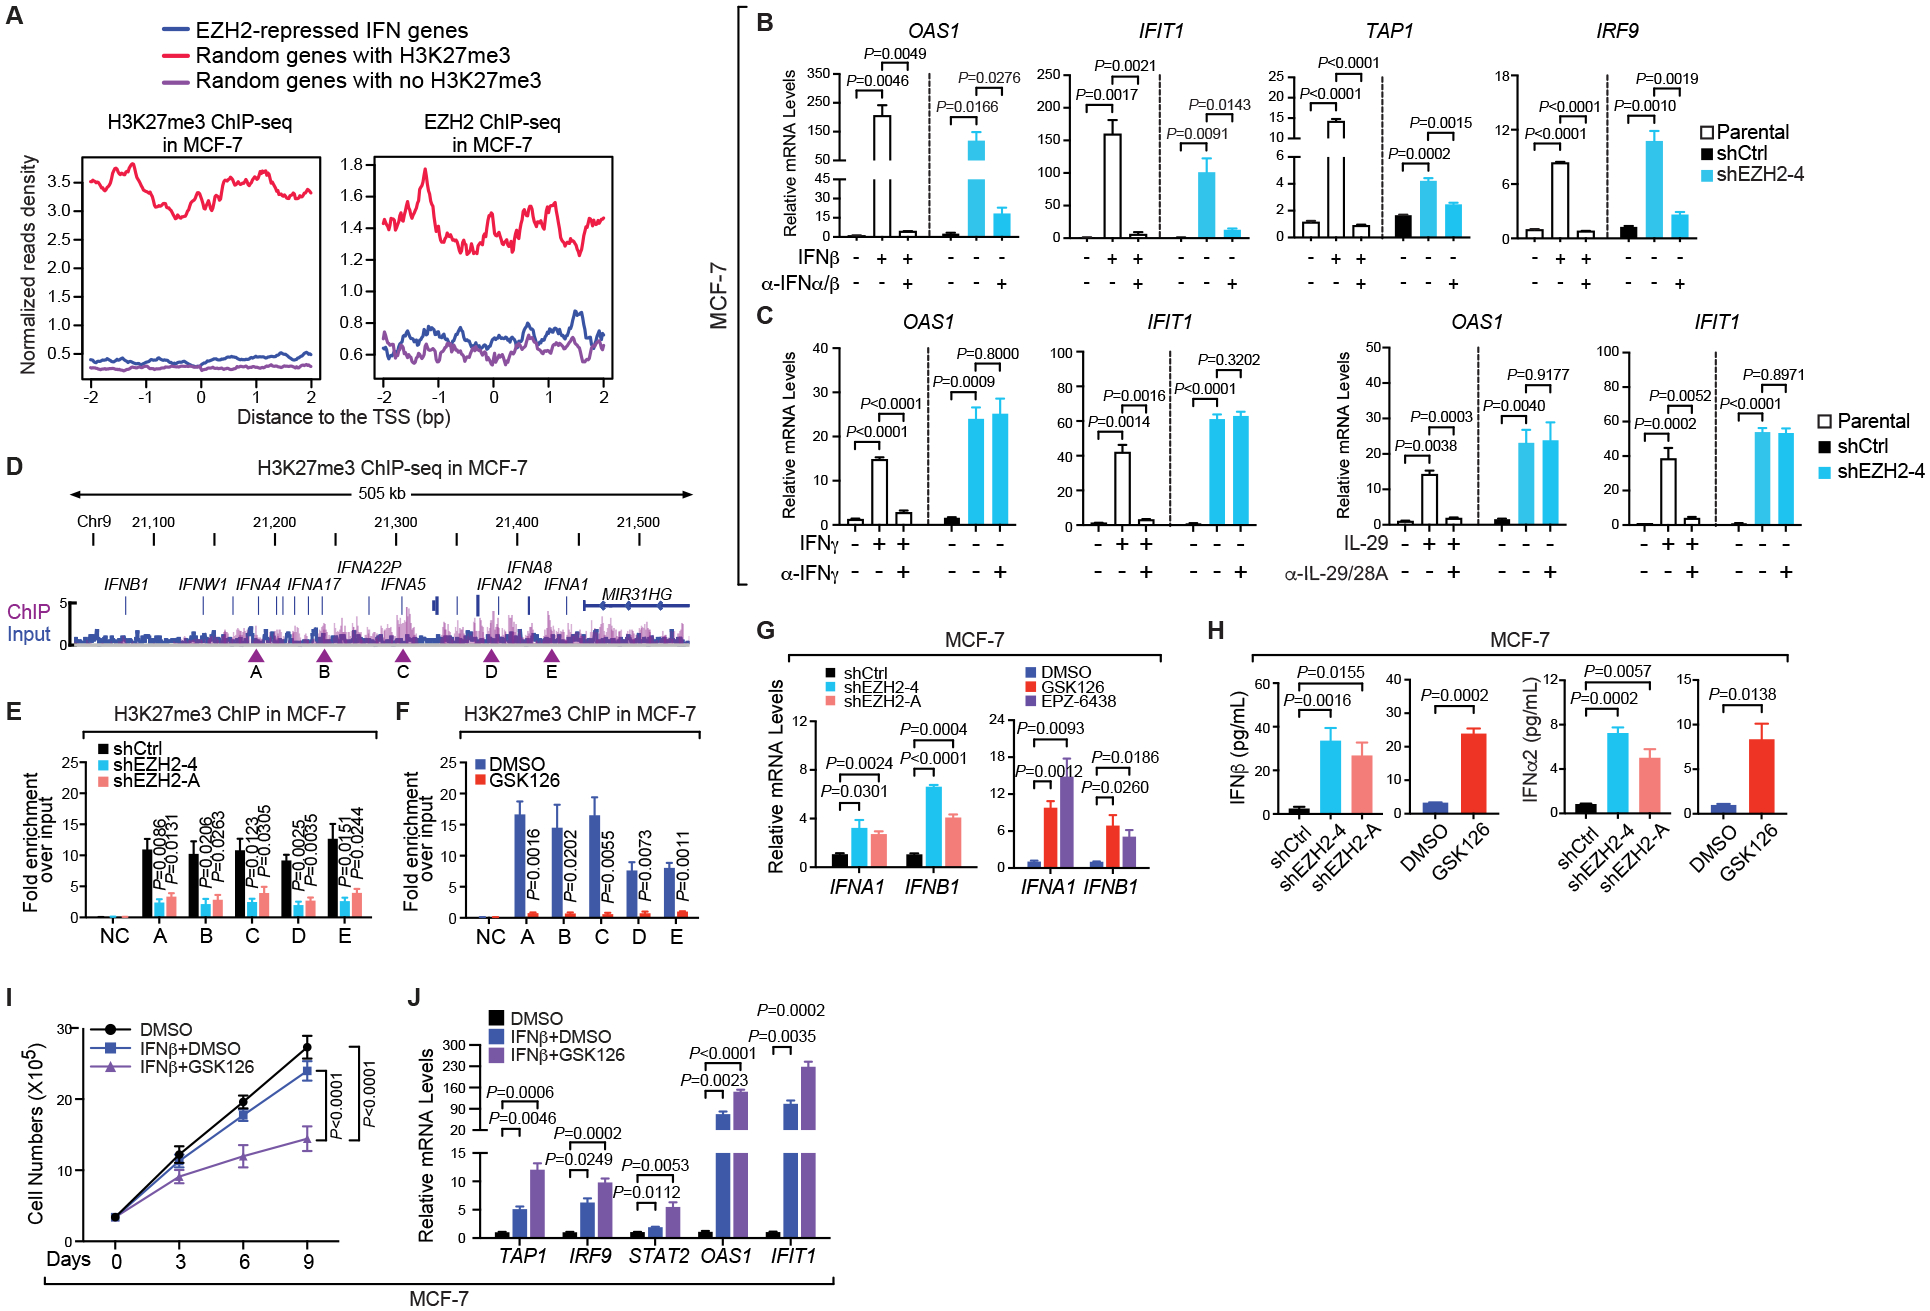
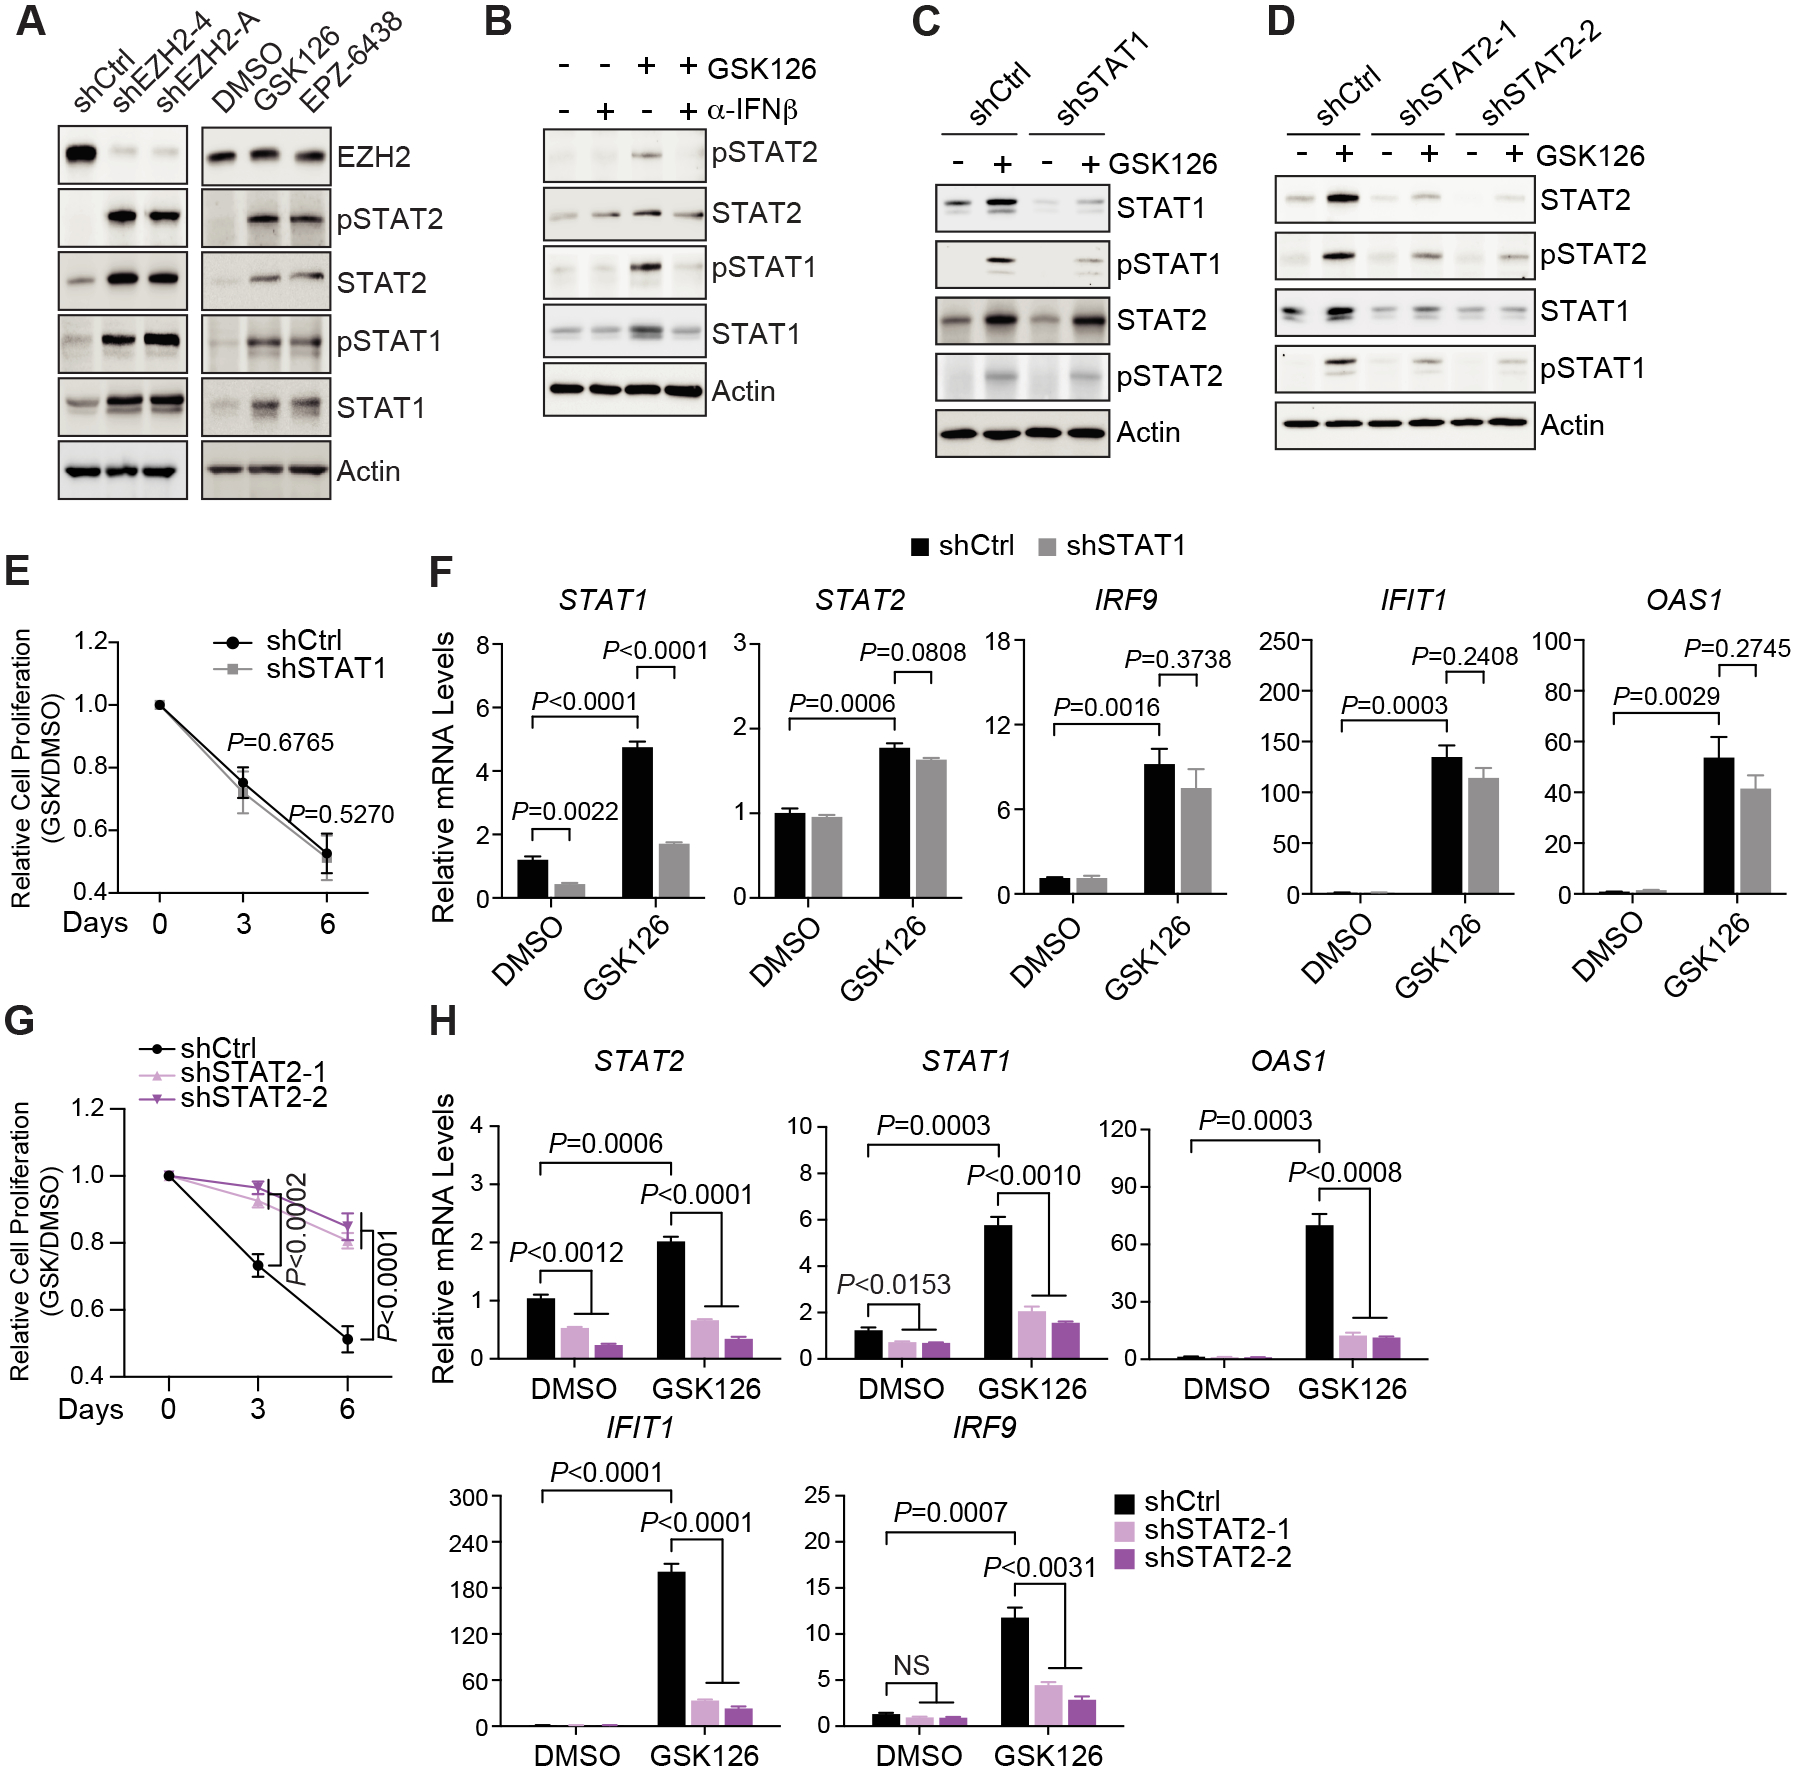
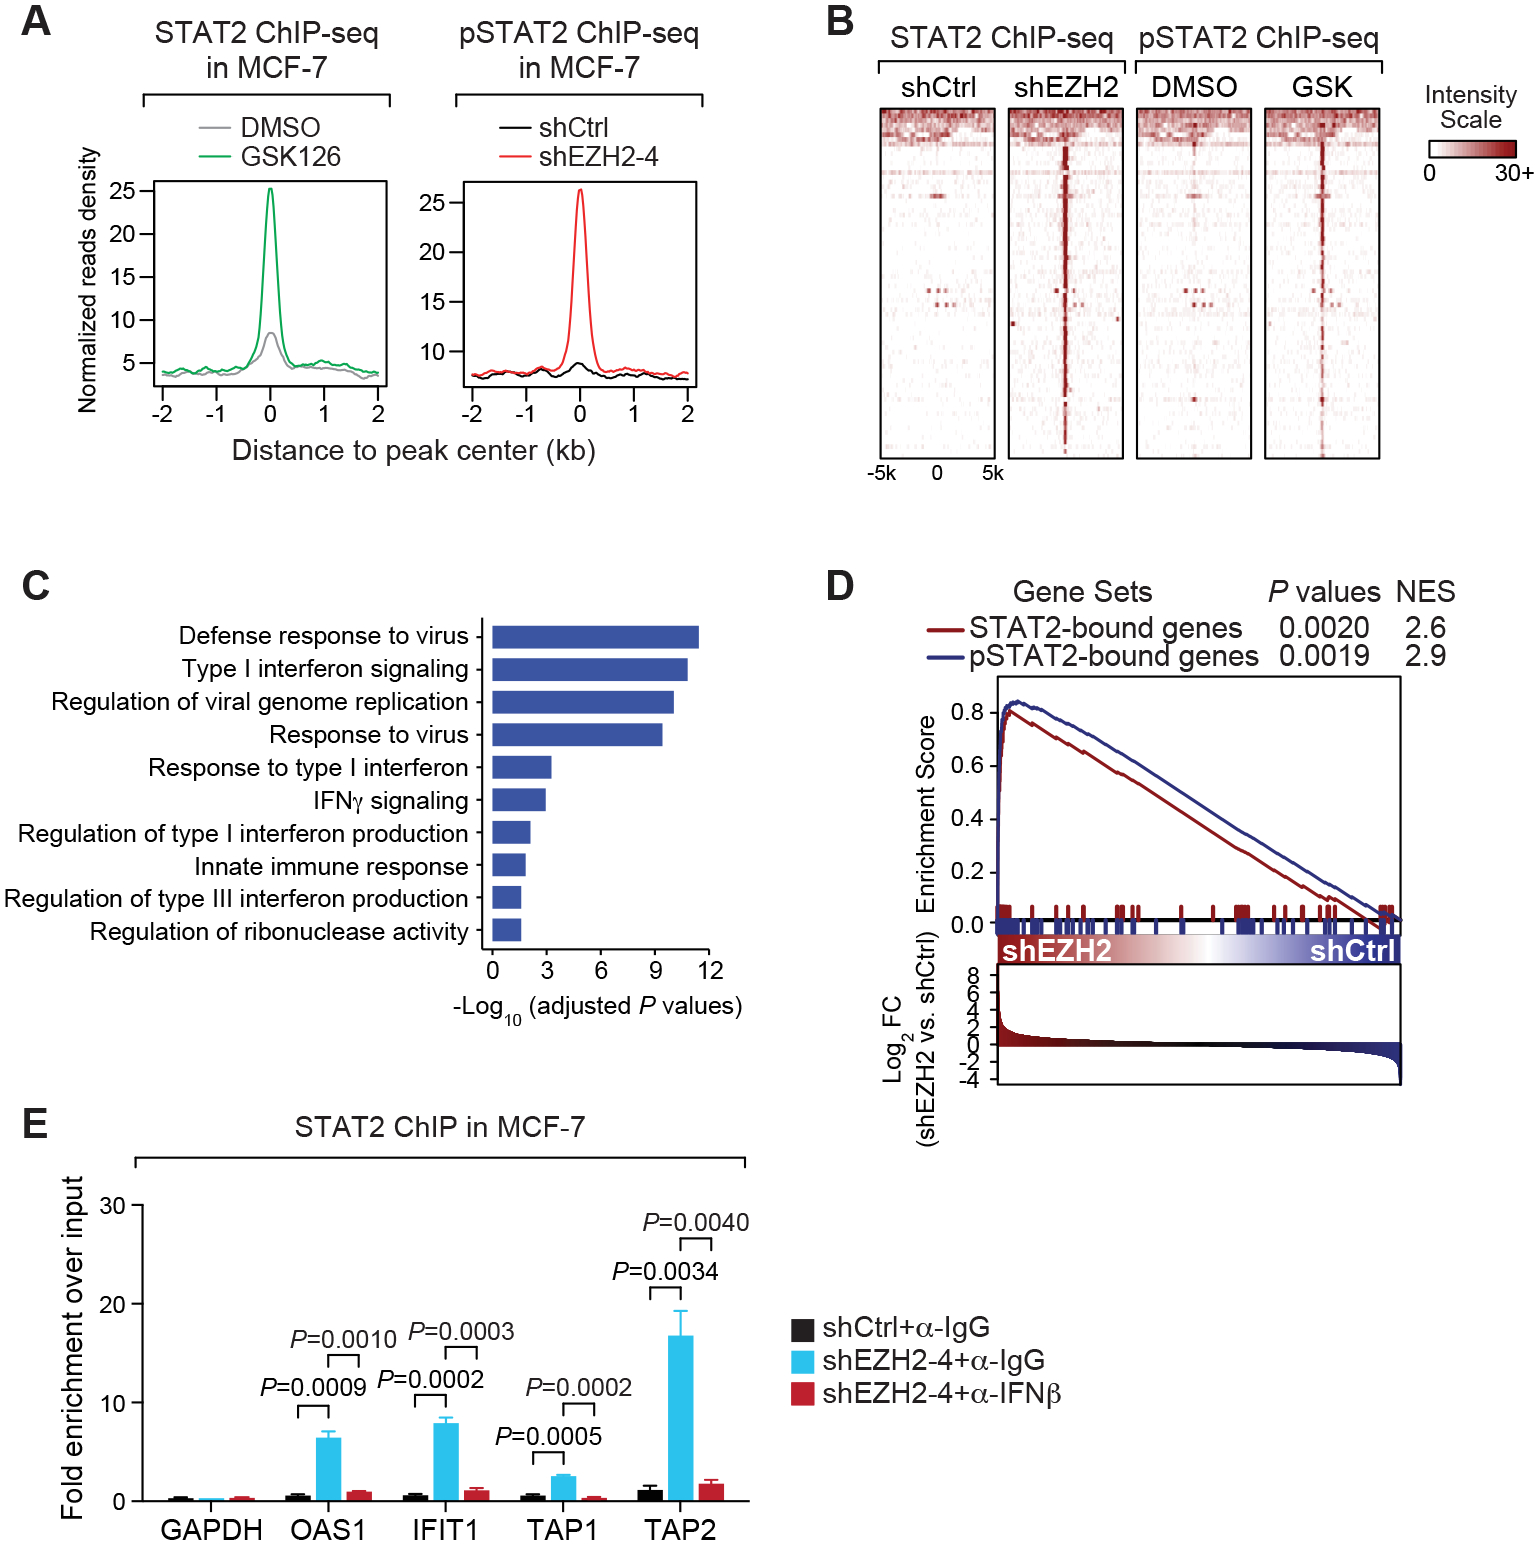
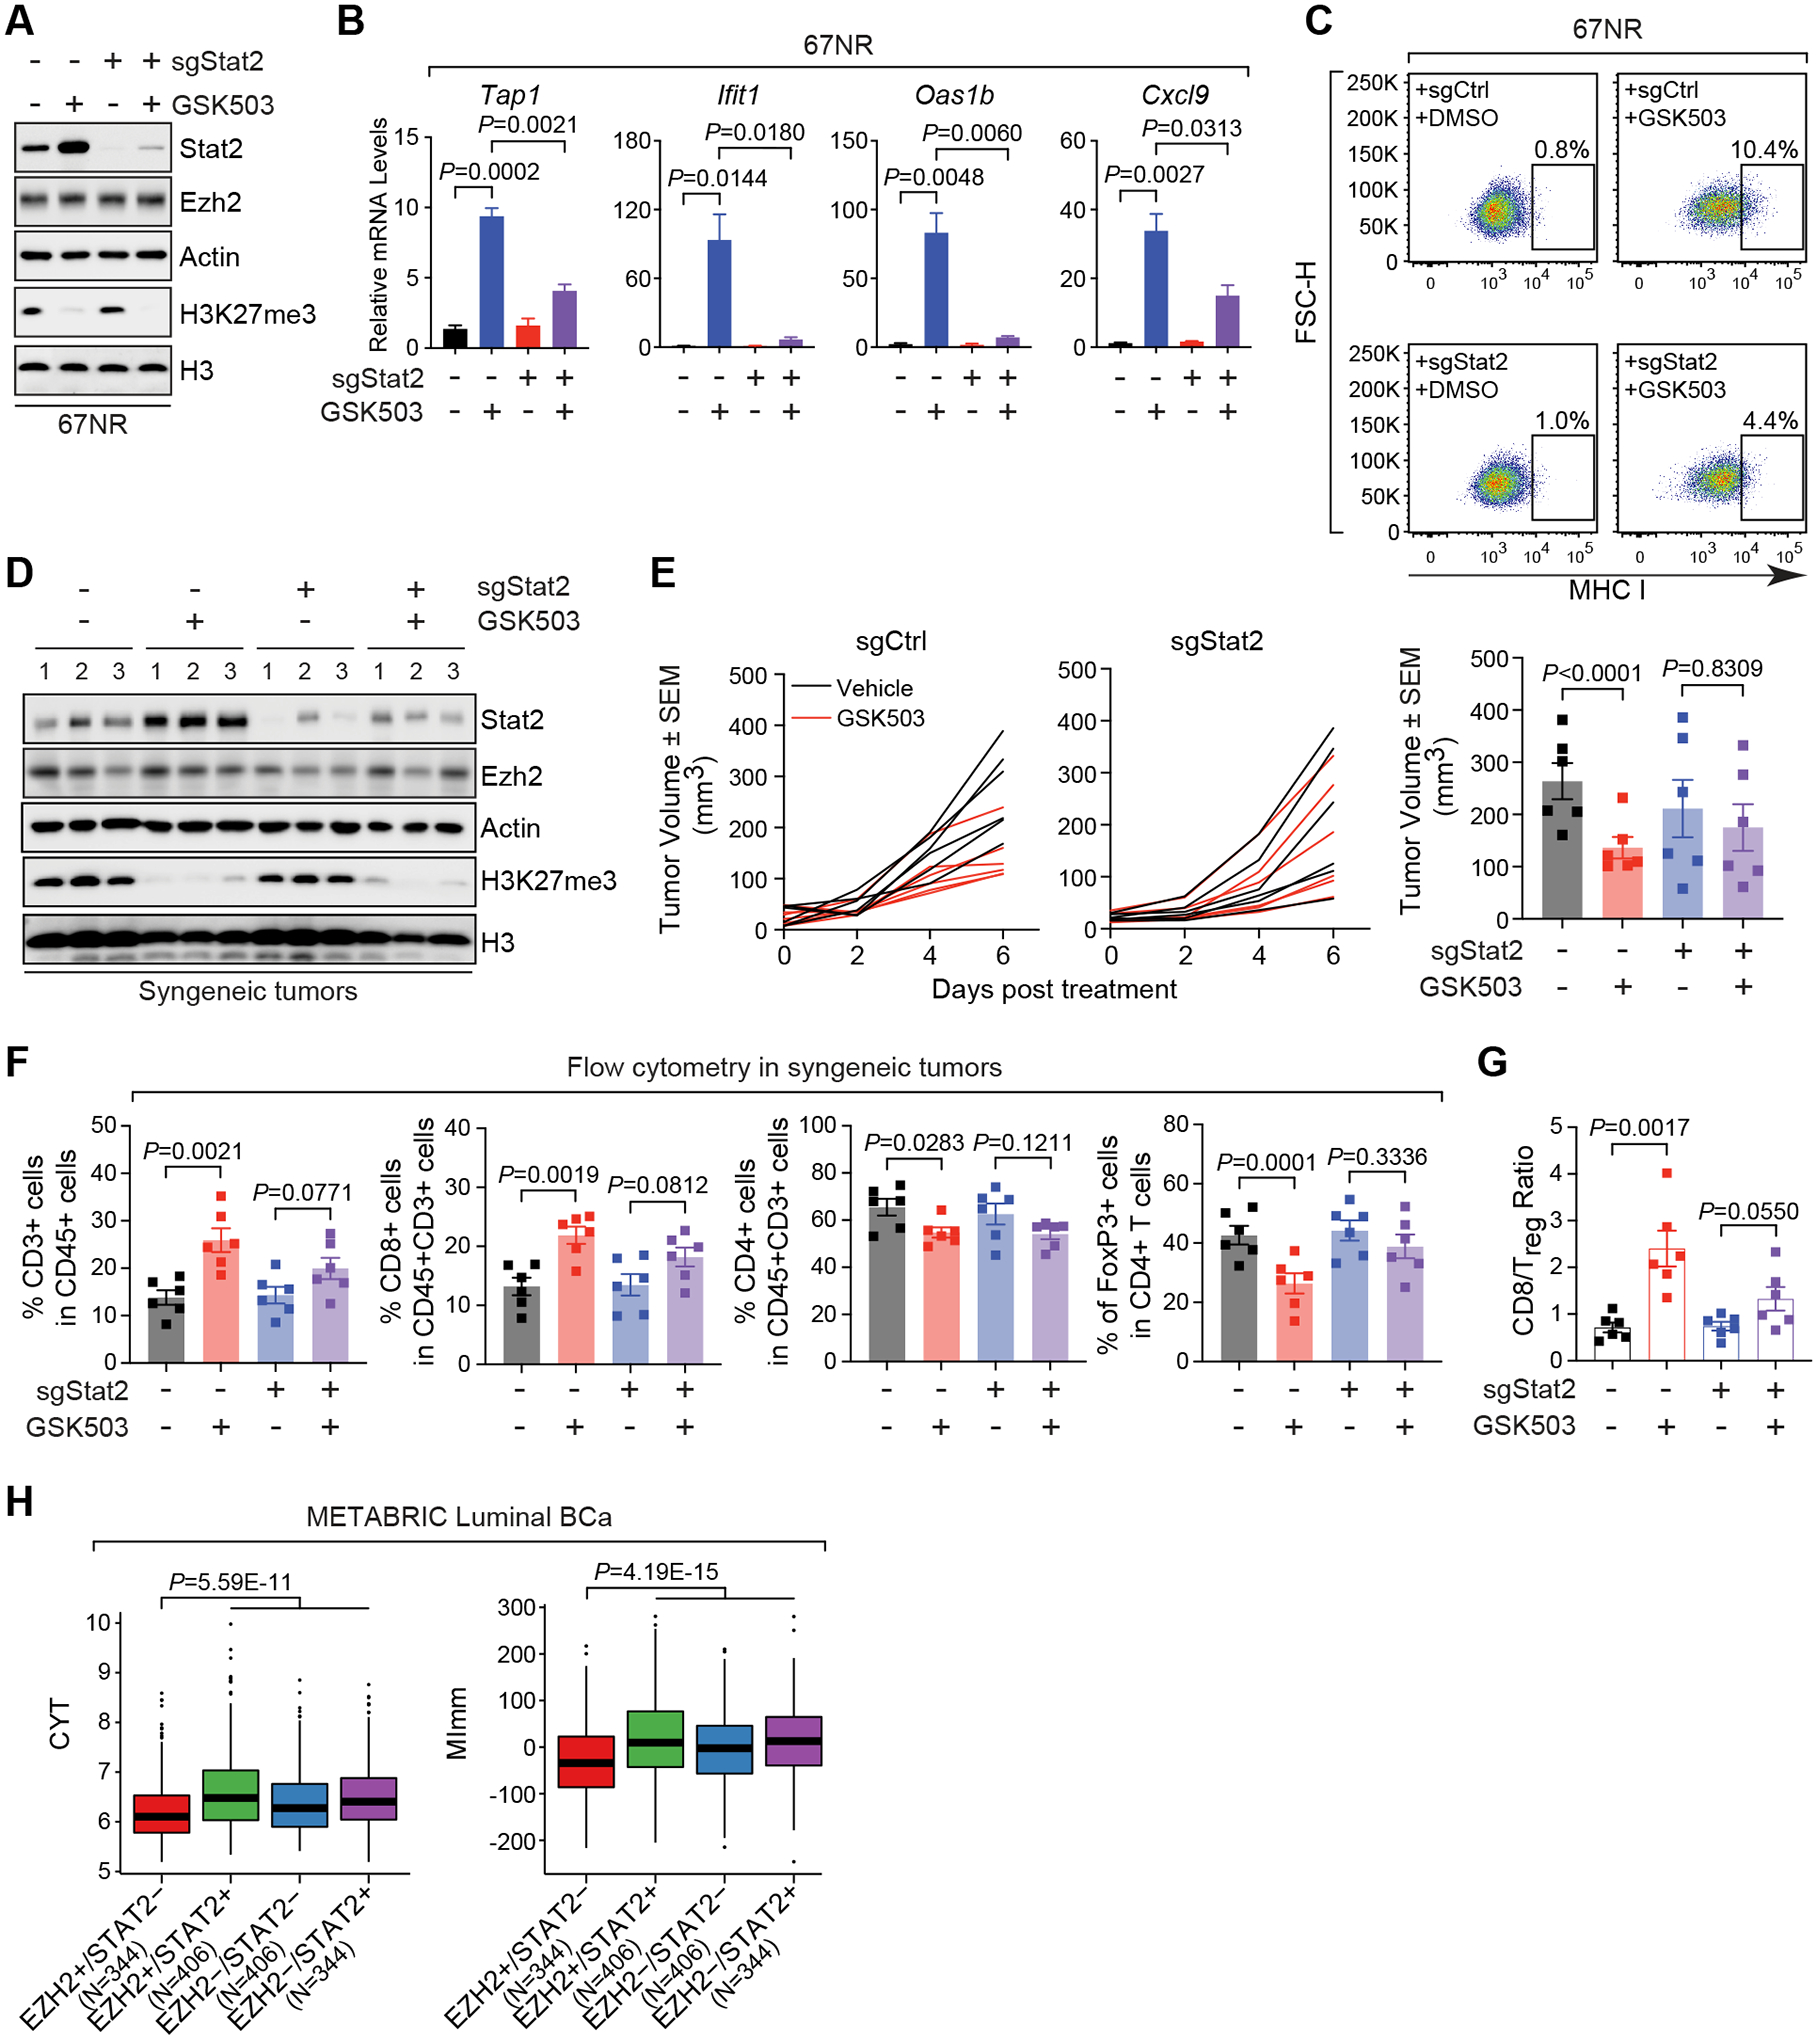
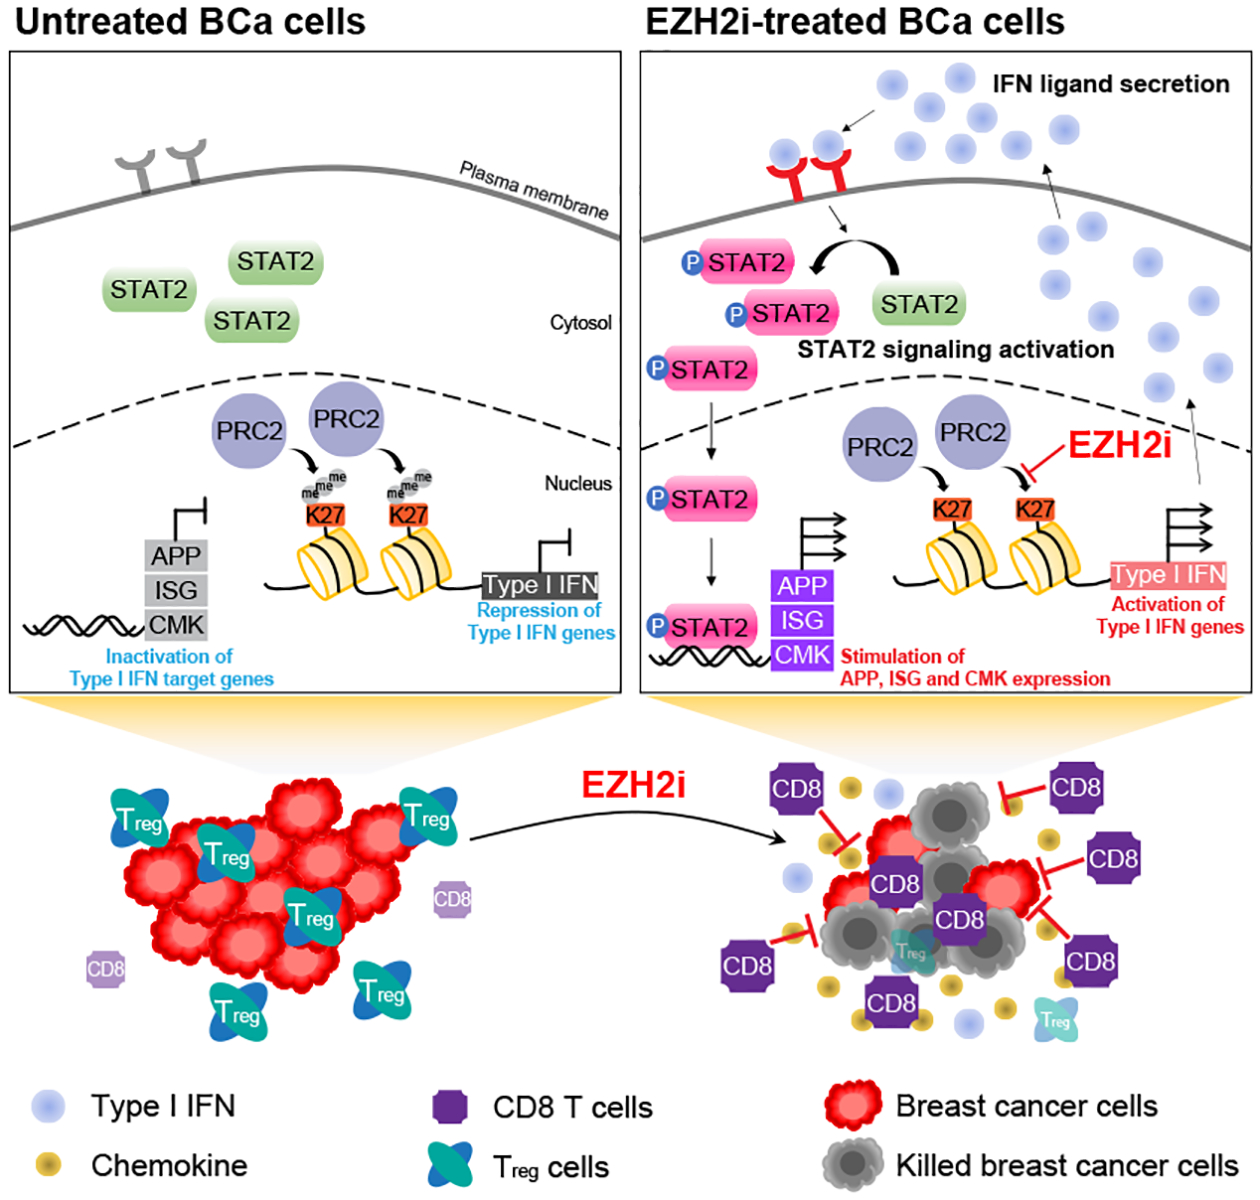
The immunosuppressive tumor microenvironment in some cancer types, such as luminal breast cancer, supports tumor growth and limits therapeutic efficacy. Identifying approaches to induce an immunostimulatory environment could help improve cancer treatment. Here, we demonstrate that inhibition of cancer-intrinsic EZH2 promotes antitumor immunity in estrogen receptor α-positive (ERα+) breast cancer. EZH2 is a component of the polycomb-repressive complex 2 (PRC2) complex, which catalyzes trimethylation of histone H3 at lysine 27 (H3K27me3). A 53-gene PRC2 activity signature was closely associated with the immune responses of ERα+ breast cancer cells. The stimulatory effects of EZH2 inhibition on immune surveillance required specific activation of type I IFN signaling. Integrative analysis of PRC2-repressed genes and genome-wide H3K27me3 landscape revealed that type I IFN ligands are epigenetically silenced by H3K27me3. Notably, the transcription factor STAT2, but not STAT1, mediated the immunostimulatory functions of type I IFN signaling. Following EZH2 inhibition, STAT2 was recruited to the promoters of IFN-stimulated genes even in the absence of the cytokines, suggesting the formation of an autocrine IFN-STAT2 axis. In patients with luminal breast cancer, high levels of EZH2 and low levels of STAT2 were associated with the worst antitumor immune responses. Collectively, this work paves the way for the development of an effective therapeutic strategy that may reverse immunosuppression in cancer.

Significance: Inhibition of EZH2 activates a type I IFN-STAT2 signaling axis and provides a therapeutic strategy to stimulate antitumor immunity and therapy responsiveness in immunologically cold luminal breast cancer.


Conflict of interest statement

Conflict of interest statement: The authors declare no potential conflicts of interest.

Figures

Figure 1.
Figure 1.. EZH2 inhibition abrogates tumor growth and triggers an antitumor immunity in syngeneic mouse model of ERα-positive (ERα+) breast cancer.
(A- B) Growth (A, n=12 per group) and immunoblotting analysis (B) of allograft tumors in 67NR-derived syngenetic mouse model upon the treatment with vehicle or 150 mg/kg GSK503. Numbers in (B), triplicates of independent allograft tumors. (C) Growth (n=14 per group) of allograft tumors established by the control (sgCtrl) or Ezh2-knockout (sgEzh2) 67NR cells. Left panel, Western blot in control and Ezh2-knockout 67NR cells with indicated antibodies. (D-F) CyTOF analysis (D) and flow cytometry analysis (E) of infiltrated lymphocytes with indicated markers and ratios of CD8+ T cells to Treg cells (F) in the allograft tumors treated with vehicle or 150 mg/kg GSK503. Left and right panel in (D), viSNE results and expression of the marker, respectively. (G) Representative images (left panel) and quantification (right panel) of fluorescent immunohistochemistry of CD3+ and CD8+ T cells in vehicle- and GSK503-treated allograft tumors. Six random microscopic views were examined in each biological replicate.
Figure 2.
Figure 2.. Interferon signaling is suppressed by PRC2 complex.
(A) Volcano plot showing genes that are significantly increased (Up) or decreased (Down) in GSK503 (GSK)-treated allograft tumors compared to vehicle (Veh.)-treated ones, which were established from 67NR cells. Horizontal and vertical dashed lines, log2-transformed fold change (Log2FC) at ±log2(1.3) and log10-transformed P values [−Log10 (P values)] at −log10(0.05), respectively; N, numbers of significantly changed genes. (B) Gene Set Enrichment Analysis (GSEA) of GSK503-upregulated (GSK_Up, red line) or -downregulated (GSK_Dn, blue line) genes from the syngeneic mouse model of breast cancer in the gene expression profiling performed in control (shCtrl) and EZH2-knockdown (shEZH2) MCF-7 cells. NES, normalized enrichment score; P values were determined by two-way ANOVA corrected for multiple comparisons. (C) Functional annotations of GSK503-upregulated (NES>0) or -downregulated (NES<0) genes identified in (A). (D-E) Immunoblotting analysis (left panel) and expression of selected interferon-stimulated genes (ISGs) (right panel) in MCF-7 cells upon treatment with 5 μM EZH2 inhibitor (GSK126 and EPZ6438) (D) or upon treatment with 0, 5 or 10 μM EED226 (E) for 7 days. (F) Top cancer hallmarks enriched in genes upregulated in patients with luminal breast cancer (Luminal BCa) displaying the lowest (red bars) or the highest (blue bars) EZH2 repressive activity. Patient information was retrieved from TCGA (19) (left panel) and METABRIC (20) (right panel) dataset. NES, normalized enrichment score; N, numbers of patients with luminal breast cancer.
Figure 3.
Figure 3.. EZH2 inhibition enhances the capability of interferon signaling to induce immune surveillance in ERα+ breast cancer cells.
(A-B) Expression of exemplary genes in MCF-7 cells where endogenous EZH2 was silenced by two specific shRNAs (shEZH2–4 and -A) (A) or inhibited by 5 μM inhibitors (GSK126 and EPZ-6438) for 8 days (B). Control shRNA (shCtrl) and DMSO serve as controls in (A) and (B), respectively. (C-D) Representative histograms (left panels) and normalized mean fluorescence intensity (nMFI) (right panels) of flow cytometry results showing the levels of MHC class-I (MHC I) and β2M proteins on the surface of MCF-7 cells upon knockdown of EZH2 (C) or treatment with EZH2 inhibitors (D) as described in (A-B). (E) Expression of selected genes in 67NR-derived allograft tumors collected from vehicle- and GSK503-treated mice. (F) Flow cytometry analysis of MHC class-I [MHC I (H-2kd)] and β2m proteins on the surface of 67NR cells treated with DMSO or 10 μM GSK503 for 8 days. (G) Correlation of EZH2 repressive activity represented by the Gene Set Variation Analysis (GSVA) scores of the 53 signature genes with the expression sum of genes involved in antigen processing and presentation (APP), T scores, MImm scores and CYT scores in patients with luminal breast cancer (Luminal BCa). Clinical information was retrieved from TCGA dataset (19).
Figure 4.
Figure 4.. Type I interferon ligands are directly silenced by H3K27me3 in ERα+ breast cancer cells.
(A) Aggregation plots showing H3K27me3 (left panel) and EZH2 (right panel) ChIP-seq signals around the transcription start sites (TSS) of indicated groups of genes in MCF-7 cells. The same numbers of genes were randomly picked from genes bound by H3K27me3 (red line) or void of the histone modification (purple line), serving as positive and negative controls respectively. (B-C) Expression of specified genes in parental, control (shCtrl) or EZH2-knockdown (shEZH2–4) MCF-7 cells treated with (+) or without (–) the indicated IFN ligands for 7 days [250 pg/mL IFNβ in (B) and 250 pg/mL IFNγ or 50 ng/mL IL-29 in (C)] in the absence (–) and presence (+) of the corresponding neutralizing antibody for 24 hours [2.5 μg/mL α-IFNα/β in (B) and 2 μg/mL α-IFNγ or 4 μg/mL α-IL-29/28A in (C)]. (D) Snapshot of Integrative Genomics Viewer (IGV) showing the enrichment of H3K27me3 ChIP-seq signals at the type I IFN gene cluster in MCF-7 cells. Arrowheads, five chromatin sites selected for ChIP-qPCR confirmation. (E-F) ChIP of H3K27me3 in MCF-7 cells infected with control shRNA (shCtrl) or EZH2-specific shRNAs (shEZH2–4 and -A) (E) or treated with DMSO or 5 μM GSK126 for 7 days (F). NC, negative control using the promoter of KIAA0066. (G-H) Expression of IFNA1 and IFNB1 genes (G) and levels of IFNα2 and IFNβ proteins in the culture medium detected by ELISA (H) in MCF-7 cells where EZH2 was silenced by two independent shRNAs (shEZH2–4 and -A) or inhibited by 5 μM inhibitors [GSK126 and EPZ-6438 in (G) and GSK126 in (H)] for 7 days. (I-J) Growth (I) and expression of specified genes (J) in MCF-7 cells treated with DMSO or 200 pg/mL IFNβ, either alone or together with 3 μM GSK126, for up to 9 days.
Figure 5.
Figure 5.. STAT2, but not STAT1, mediates the type I interferon signaling that is activated upon EZH2 inhibition.
(A-B) Western blot with specified antibodies in MCF-7 cells stably expressing two EZH2-specific shRNAs (shEZH2–4 and -A) or treated with 5 μM EZH2 inhibitors (GSK126 and EPZ-6438) for 7 days (A) or in the presence of 5 μM GSK126, either alone (–) or with (+) 2 μg/mL IFNβ-specific neutralizing antibody (α-IFNβ), for 7 days (B) (C-H) Immunoblotting analysis (C-D), cell proliferation (E and G) and expression of exemplary genes (F and H) in MCF-7 cells upon knockdown of STAT1 (shSTAT1, C and E-F) or STAT2 (shSTAT2–1 and −2, D and G-H) in the presence of 5 μM GSK126 for indicated period of time (E and G) or up to 7 days (F and H).
Figure 6.
Figure 6.. STAT2 is recruited to classical interferon-sensitive response elements around the target genes of type I interferon signaling upon EZH2 inhibition in ERα+ breast cancer cells.
(A-B) Aggregation plots (A) and heat maps (B) showing ChIP-seq signals of total STAT2 in MCF-7 cells treated with 5 μM GSK126 (GSK) for 7 days or ChIP-seq signals of Tyr690-phosphorylated STAT2 (pSTAT2) in EZH2-knockdown (shEZH2–4) MCF-7 cells. (C) Gene Ontology (GO) analysis of genes containing at least one STAT2 peak upon GSK126 treatment or at least one pSTAT2 peak upon EZH2 knockdown within 1 kb from the transcription start sites. (D) GSEA analysis of genes defined in (C) in gene expression profiling carried out in MCF-7 cells infected with control shRNA (shCtrl) or EZH2-specific shRNA (shEZH2). (E) STAT2-targeted ChIP in control (shCtrl) and EZH2-knockdown (shEZH2–4) MCF-7 cells in the presence of 2.0 μg/mL IgG isotype control (α-IgG) or 2.0 μg/mL IFNβ-specific neutralizing antibody (α-IFNβ) for 3 days. Promoter of GAPDH servers as the negative control.
Figure 7.
Figure 7.. STAT2 is essential for the inhibitory effects of EZH2 inhibitors on tumor growth and immune escape in luminal breast cancer.
(A-C) Western blot (A), expression of specified genes (B) and flow cytometry analysis of cell surface levels of MHC class-I (MHC I) proteins (C) in 67NR cells stably expressing control sgRNA (sgCtrl) or Stat2-targeting sgRNA (sgStat2) in the presence (+) and absence (–) of 10 μM GSK503 for 8 days. (D-E) Immunoblotting analysis (D) and growth (E) of allograft tumors established by inoculating control (sgCtrl) or Stat2-knockout (sgStat2) 67NR cells into immunocompetent BALB/c mice receiving vehicle or 150 mg/kg GSK503. Numbers in (D), triplicates of independent allograft tumors. Right panel in (E), Quantification of tumor sizes at the endpoint (F-G) Quantification of flow cytometry analysis of T cells with indicated markers (F) and the ratio of CD8+ T cells to Treg cells (G) in the final allograft tumors expressing Stat2-specific sgRNA (sgStat2) upon the treatment with 150 mg/kg GSK503. (H) Association of high (+) or low (–) expression of EZH2 and STAT2 genes, when considered concurrently, with CYT and MImm scores in patients with luminal breast cancer (Luminal BCa). Clinical information was retrieved from METABRIC (20) dataset. N, numbers of patients with luminal breast cancer in each specified group of EZH2 and STAT2 expression.
Figure 8.
Figure 8.. Model depicting the function of PRC2-catalyzed H3K27me3 in inactivating type I IFN-STAT2 axis in luminal breast cancer.
Pharmacological inhibition of PRC2 complex (EZH2i) releases the epigenetic silencing of genes encoding type I IFN ligands, induces an autocrine activation of the IFN signaling mediated by STAT2 and subsequently generates an antitumor microenvironment in ERα+ breast cancer (BCa) cells.

Similar articles

Cited by

References

    1. Dai E, Zhu Z, Wahed S, Qu Z, Storkus WJ, Guo ZS. Epigenetic modulation of antitumor immunity for improved cancer immunotherapy. Mol Cancer 2021;20:171. - PMC - PubMed
    1. Gan L, Yang Y, Li Q, Feng Y, Liu T, Guo W. Epigenetic regulation of cancer progression by EZH2: from biological insights to therapeutic potential. Biomark Res 2018;6:10. - PMC - PubMed
    1. Cao R, Zhang Y. SUZ12 is required for both the histone methyltransferase activity and the silencing function of the EED-EZH2 complex. Mol Cell 2004;15:57–67 - PubMed
    1. Cao Q, Wang X, Zhao M, Yang R, Malik R, Qiao Y, et al. The central role of EED in the orchestration of polycomb group complexes. Nat Commun 2014;5:3127. - PMC - PubMed
    1. Cao R, Wang L, Wang H, Xia L, Erdjument-Bromage H, Tempst P, et al. Role of histone H3 lysine 27 methylation in Polycomb-group silencing. Science 2002;298:1039–43 - PubMed

Publication types

MeSH terms