. 2022 Dec 16;82(24):4670-4679.
doi: 10.1158/0008-5472.CAN-22-0787.

Therapy-Induced Senescence Enhances the Efficacy of HER2-Targeted Antibody-Drug Conjugates in Breast Cancer

Affiliations

Therapy-Induced Senescence Enhances the Efficacy of HER2-Targeted Antibody-Drug Conjugates in Breast Cancer

Santiago Duro-Sánchez et al. Cancer Res. .

Abstract

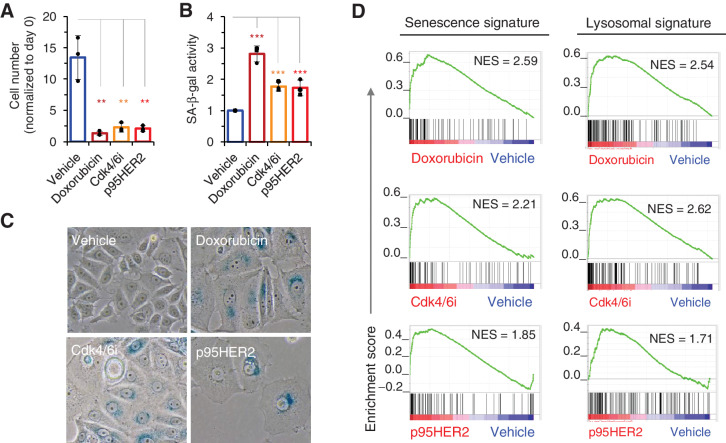
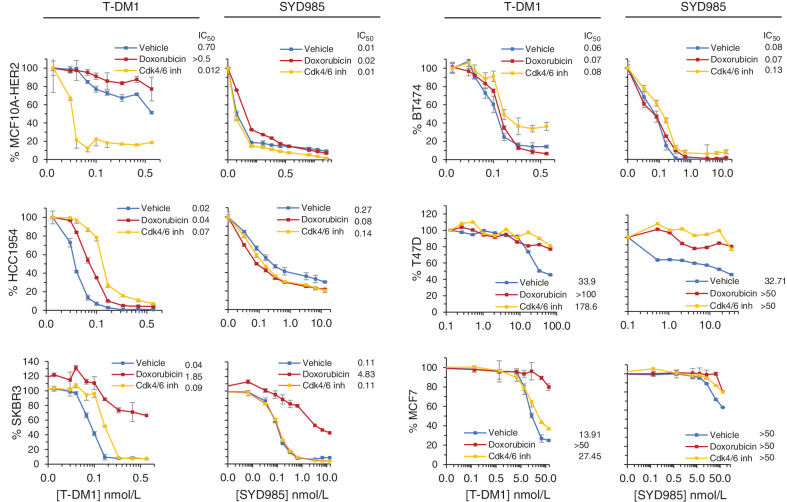
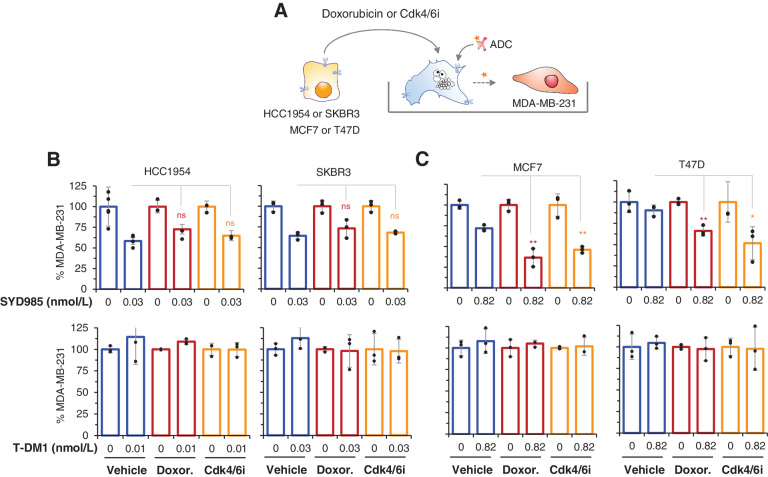
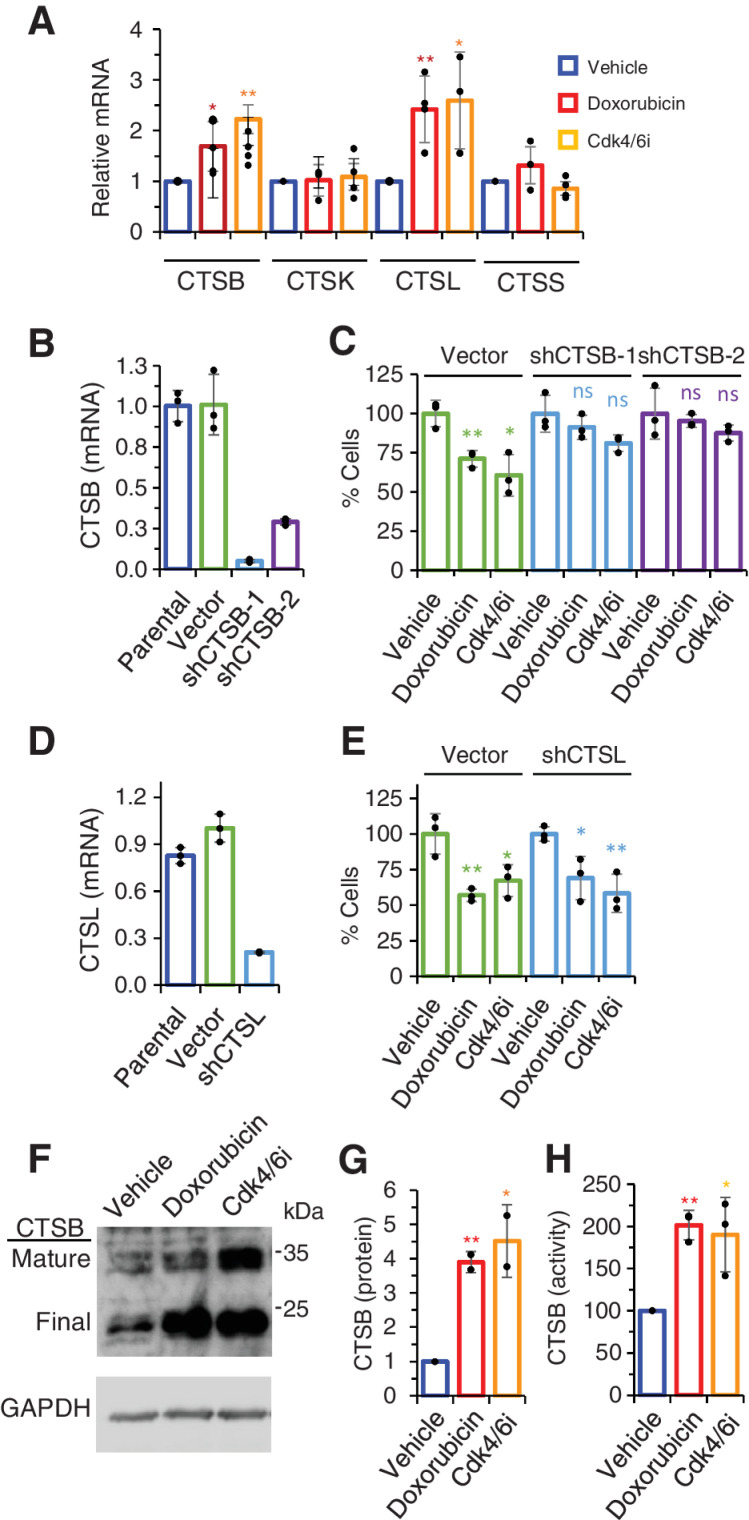
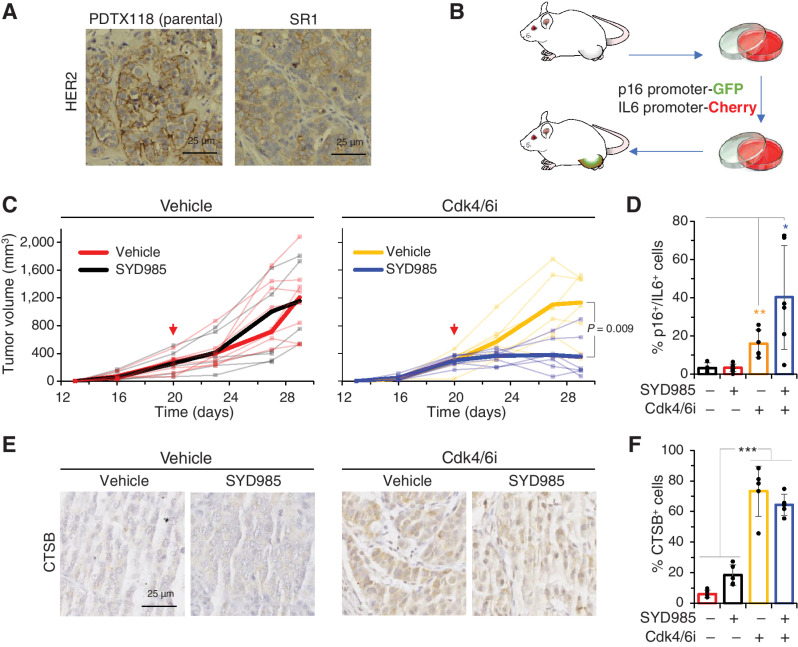
Antibody-drug conjugates (ADC) are antineoplastic agents recently introduced into the antitumor arsenal. T-DM1, a trastuzumab-based ADC that relies on lysosomal processing to release the payload, is approved for HER2-positive breast cancer. Next-generation ADCs targeting HER2, such as [vic-]trastuzumab duocarmazine (SYD985), bear linkers cleavable by lysosomal proteases and membrane-permeable drugs, mediating a bystander effect by which neighboring antigen-negative cells are eliminated. Many antitumor therapies, like DNA-damaging agents or CDK4/6 inhibitors, can induce senescence, a cellular state characterized by stable cell-cycle arrest. Another hallmark of cellular senescence is the enlargement of the lysosomal compartment. Given the relevance of the lysosome to the mechanism of action of ADCs, we hypothesized that therapies that induce senescence would potentiate the efficacy of HER2-targeting ADCs. Treatment with the DNA-damaging agent doxorubicin and CDK4/6 inhibitor induced lysosomal enlargement and senescence in several breast cancer cell lines. While senescence-inducing drugs did not increase the cytotoxic effect of ADCs on target cells, the bystander effect was enhanced when HER2-negative cells were cocultured with HER2-low cells. Knockdown experiments demonstrated the importance of cathepsin B in the enhanced bystander effect, suggesting that cathepsin B mediates linker cleavage. In breast cancer patient-derived xenografts, a combination treatment of CDK4/6 inhibitor and SYD985 showed improved antitumor effects over either treatment alone. These data support the strategy of combining next-generation ADCs targeting HER2 with senescence-inducing therapies for tumors with heterogenous and low HER2 expression.

Significance: Combining ADCs against HER2-positive breast cancers with therapies that induce cellular senescence may improve their therapeutic efficacy by facilitating a bystander effect against antigen-negative tumor cells.


Figures

Figure 1. Diverse senescence inducers increase lysosomal function. A, MCF7 cells were treated with vehicle, doxorubicin (50 nmol/L), the Cdk4/6i palbociclib (700 nmol/L) or induced to express p95HER2 for 4 or 5 days. Then, cells were counted; n = 3. B, SA-β-gal activity was quantified using Galacto-Light Plus beta-Galactosidase Reporter Gene Assay System Kit (Applied Biosystems) from cells treated as in A. Results were normalized to those of cells treated with vehicle; n = 4. C, Representative pictures of SA-β-gal staining of MCF7 cells treated as in A. D, Transcriptomic profiles of cells treated as in A were determined by RNA-seq. senescence and lysosomal GSEA signatures in treated cells were compared with that in cells treated with vehicle. P value corresponds to the NOM P value obtained by GSEA in the HALLMARK database.
Figure 1.
Diverse senescence inducers increase lysosomal function. A, MCF7 cells were treated with vehicle, doxorubicin (50 nmol/L), the Cdk4/6i palbociclib (700 nmol/L) or induced to express p95HER2 for 4 or 5 days. Then, cells were counted; n = 3. B, SA-β-gal activity was quantified using Galacto-Light Plus β-Galactosidase Reporter Gene Assay System Kit (Applied Biosystems) from cells treated as in A. Results were normalized to those of cells treated with vehicle; n = 4. C, Representative pictures of SA-β-gal staining of MCF7 cells treated as in A. D, Transcriptomic profiles of cells treated as in A were determined by RNA-seq. Senescence and lysosomal GSEA signatures in treated cells were compared with that in cells treated with vehicle. P value corresponds to the NOM P value obtained by GSEA in the HALLMARK database. **, P < 0.01; ***, P < 0.001.
Figure 2. Effect of doxorubicin or Cdk4/6i on the sensitivity to T-DM1 or SYD985. The indicated cell lines were treated with a concentration of doxorubicin (ranging from 12.5 to 50 nmol/L, depending on cell line, for 4 days) or Cdk4/6i (700 to 3,000 nmol/L, for 5 days), replated and treated with different concentrations of T-DM1 or SYD985 for 7 additional days without doxorubicin or Cdk4/6i. Then, cell numbers were estimated with the crystal violet staining assay.
Figure 2.
Effect of doxorubicin or Cdk4/6i on the sensitivity to T-DM1 or SYD985. The indicated cell lines were treated with a concentration of doxorubicin (ranging from 12.5 to 50 nmol/L, depending on cell line, for 4 days) or Cdk4/6i (700 to 3,000 nmol/L for 5 days), replated and treated with different concentrations of T-DM1 or SYD985 for 7 additional days without doxorubicin or Cdk4/6i. Then, cell numbers were estimated with the Crystal Violet staining assay.
Figure 3. Effect of doxorubicin or Cdk4/6i on the bystander effect of SYD985. A, Schematic showing the experimental procedure. The indicated cells were treated with doxorubicin or Cdk4/6i for 4 or 5 days, respectively. Then, cells were harvested and cococultured with MDA-MB-231 cells expressing luciferase and cocultures were treated with SYD985 or T-DM1 for 5 additional days. At the end of the experiment, MDA-MB-231/luc cells were quantified by luminescence. B and C, Luminescence, quantified as described in A, was determined at the end of the experiments and normalized to cells treated with vehicle. n ≥ 3.
Figure 3.
Effect of doxorubicin or Cdk4/6i on the bystander effect of SYD985. A, Schematic showing the experimental procedure. The indicated cells were treated with doxorubicin or Cdk4/6i for 4 or 5 days, respectively. Then, cells were harvested and cococultured with MDA-MB-231 cells expressing luciferase and cocultures were treated with SYD985 or T-DM1 for 5 additional days. At the end of the experiment, MDA-MB-231/luc cells were quantified by luminescence. B and C, Luminescence, quantified as described in A, was determined at the end of the experiments and normalized to cells treated with vehicle. n ≥ 3. ns, nonsignificant; *, P < 0.05; **, P < 0.01.
Figure 4. Role of cathepsins on the bystander effect of SYD985. A, Levels of the indicated cathepsins were determined by qRT-PCR in MCF7 cells treated as in Fig. 1A; n ≥ 3. B, Levels of mRNA encoding CTSB in parental MCF7 cells or the same cells stably transfected with the empty vector or two different shRNA (sh) targeting CTSB. Results were normalized to parental cells; n = 3. C, As described in Fig. 3A, cocultures were performed to analyze the bystander effect of SYD985 upon knockdown of CTSB; n = 3. D and E, The role of Cathepsin L on the bystander effect of SYD985 was analyzed as in B and C. MCF7 cells treated as indicated were lysed and lysates analyzed by Western blot analysis with anti-CTSB antibodies (F and G) or processed to determine CTSB activity with a specific assay (H); n = 3.
Figure 4.
Role of cathepsins on the bystander effect of SYD985. A, Levels of the indicated cathepsins were determined by qRT-PCR in MCF7 cells treated as in Fig. 1A. n ≥ 3. B, Levels of mRNA encoding CTSB in parental MCF7 cells or the same cells stably transfected with the empty vector or two different shRNA (sh) targeting CTSB. Results were normalized to parental cells. n = 3. C, As described in Fig. 3A, cocultures were performed to analyze the bystander effect of SYD985 upon knockdown of CTSB. n = 3. D and E, The role of cathepsin L on the bystander effect of SYD985 was analyzed as in B and C. F–H, MCF7 cells treated as indicated were lysed and lysates analyzed by Western blot analysis with anti-CTSB antibodies (F and G) or processed to determine CTSB activity with a specific assay (H). n = 3. *, P < 0.05; **, P < 0.01.
Figure 5. Effect of the combination Cdk4/6i-SYD985 on a PDTXs resistant to SYD985. A, IHC analysis of HER2 in the parental PDTX or SR1, the corresponding resistant PDTX derived from it. B, Schematic showing the generation of SR1 tumors expressing reporters under the control of human p16 or IL6 promoters. Briefly, cells from SR1 were transiently cultured, infected with virus encoding the reporters as described in ref. 25 and reimplanted into immunodeficient mice. C, PDTXs expressing the reporters described in B were implanted into NOD.SCID mice and volumes were monitored periodically. As indicated by the arrow, control group (treated with vehicle) and Cdk4/6i group (treated with palbociclib at 50 mg/kg/day) were treated with 10 mg/kg of SYD985 in single dose fashion. Narrow lines represent the growth of individual tumors, wide lines represent averages. D, At the end of the experiment, the number of double-positive cells for IL6 and p16 was quantified from independent tumors by flow cytometry; n = 5. E and F, IHC analysis of CTSB in tumors treated as in C. Results from five different fields were quantified and the results are shown as averages ± SD.
Figure 5.
Effect of the combination Cdk4/6i-SYD985 on a PDTX resistant to SYD985. A, IHC analysis of HER2 in the parental PDTX or SR1, the corresponding resistant PDTX derived from it. B, Schematic showing the generation of SR1 tumors expressing reporters under the control of human p16 or IL6 promoters. Briefly, cells from SR1 were transiently cultured, infected with virus encoding the reporters as described in ref. , and reimplanted into immunodeficient mice. C, PDTXs expressing the reporters described in B were implanted into NOD.SCID mice and volumes were monitored periodically. As indicated by the arrow, control group (treated with vehicle) and Cdk4/6i group (treated with palbociclib at 50 mg/kg/day) were treated with 10 mg/kg of SYD985 in single dose fashion. Narrow lines represent the growth of individual tumors, wide lines represent averages. D, At the end of the experiment, the number of double-positive cells for IL6 and p16 was quantified from independent tumors by flow cytometry. n = 5. E and F, IHC analysis of CTSB in tumors treated as in C. Results from five different fields were quantified and the results are shown as averages ± SD. *, P < 0.05; **, P < 0.01; ***, P < 0.001.

Similar articles

Cited by

References

    1. Pegram MD, Miles D, Tsui CK, Zong Y. HER2-Overexpressing/amplified breast cancer as a testing ground for antibody-drug conjugate drug development in solid tumors. Clin Cancer Res 2019;26:775–86. - PubMed
    1. Modi S, Saura C, Yamashita T, Park YH, Kim S-B, Tamura K, et al. . Trastuzumab deruxtecan in previously treated HER2-positive breast cancer. N Engl J Med 2020;382:610–21. - PMC - PubMed
    1. Cortés J, Kim S-B, Chung W-P, Im S-A, Park YH, Hegg R, et al. . LBA1 trastuzumab deruxtecan (T-DXd) vs trastuzumab emtansine (T-DM1) in patients (Pts) with HER2+ metastatic breast cancer (mBC): results of the randomized phase III DESTINY-Breast03 study. Ann Oncol 2021;32:S1287–8.
    1. Cerami E, Gao J, Dogrusoz U, Gross BE, Sumer SO, Aksoy BA, et al. . The cBio cancer genomics portal: an open platform for exploring multidimensional cancer genomics data. Cancer Discov 2012;2:401–4. - PMC - PubMed
    1. Phillips GDL, Li G, Dugger DL, Crocker LM, Parsons KL, Mai E, et al. . Targeting HER2-positive breast cancer with trastuzumab-DM1, an antibody-cytotoxic drug conjugate. Cancer Res 2008;68:9280–90. - PubMed

Publication types