. 2022 Oct 12:11:e80578.
doi: 10.7554/eLife.80578.

Interoperability of RTN1A in dendrite dynamics and immune functions in human Langerhans cells

Affiliations

Interoperability of RTN1A in dendrite dynamics and immune functions in human Langerhans cells

Małgorzata Anna Cichoń et al. Elife. .

Abstract

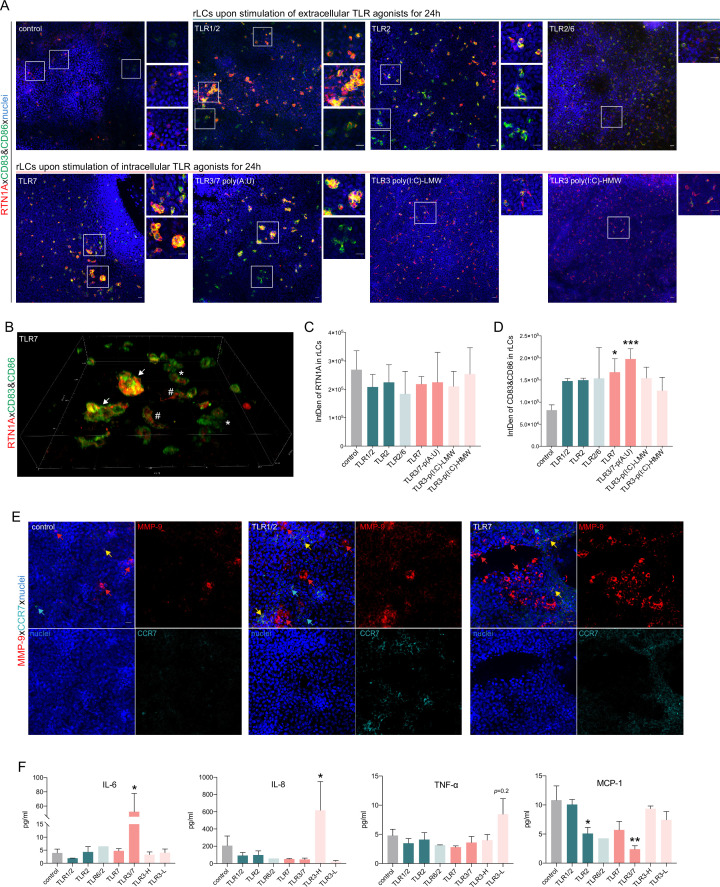
Skin is an active immune organ where professional antigen-presenting cells such as epidermal Langerhans cells (LCs) link innate and adaptive immune responses. While Reticulon 1A (RTN1A) was recently identified in LCs and dendritic cells in cutaneous and lymphoid tissues of humans and mice, its function is still unclear. Here, we studied the involvement of this protein in cytoskeletal remodeling and immune responses toward pathogens by stimulation of Toll-like receptors (TLRs) in resident LCs (rLCs) and emigrated LCs (eLCs) in human epidermis ex vivo and in a transgenic THP-1 RTN1A+ cell line. Hampering RTN1A functionality through an inhibitory antibody induced significant dendrite retraction of rLCs and inhibited their emigration. Similarly, expression of RTN1A in THP-1 cells significantly altered their morphology, enhanced aggregation potential, and inhibited the Ca2+ flux. Differentiated THP-1 RTN1A+ macrophages exhibited long cell protrusions and a larger cell body size in comparison to wild-type cells. Further, stimulation of epidermal sheets with bacterial lipoproteins (TLR1/2 and TLR2 agonists) and single-stranded RNA (TLR7 agonist) resulted in the formation of substantial clusters of rLCs and a significant decrease of RTN1A expression in eLCs. Together, our data indicate involvement of RTN1A in dendrite dynamics and structural plasticity of primary LCs. Moreover, we discovered a relation between activation of TLRs, clustering of LCs, and downregulation of RTN1A within the epidermis, thus indicating an important role of RTN1A in LC residency and maintaining tissue homeostasis.

Keywords: Langerhans cells; RTN1A; Toll-like receptors; cytoskeleton; dendrites; epidermis; human; immunology; inflammation.


Conflict of interest statement

MC, KP, JL, LW, CS, PS, AE No competing interests declared

Figures

Figure 1.
Figure 1.. Impairment of Reticulon 1A (RTN1A) functionality instigates a roundish morphology in resident Langerhans cells (rLCs).
(A) Experimental workflow demonstrating the cultivation of human epidermal sheets with an α-RTN1A antibody (ab) and the isotype for indicated time points and subsequent analysis strategies. (B–C) Representative immunofluorescence (IF) images of isotype- and α-RTN1A-treated epidermal sheets at indicated time points stained for CD207 (green), a secondary ab (red) to visualize the uptake of the isotype and α-RTN1A ab by rLCs and nuclear counterstaining with 4′,6-diamidino-2-phenylindole (DAPI) (blue). Zoom-ins of the boxed areas are also shown as 3D projections underneath. RTN1A+ rLCs: yellow arrows, RTN1A- rLCs: white arrows. n=3, scale bar: 20 μm. (D) Representative IF images showing RTN1A, CD207, vimentin, and DAPI staining in untreated (UT), isotype- and α-RTN1A-treated human epidermal sheets after 24 hr of cultivation. Co-localization of RTN1A with vimentin: pinkish arrows, rLCs with partially retracted dendrites: white arrows. n=4, scale bar: 20 μm. (E, F) Enumeration, percentage, and distribution of dendritic and roundish rLCs in epidermal sheets upon 24 hr of culture and indicated treatment. (E) Data are shown as standard error of the mean (SEM) from four fields of view (FOVs) of four donors and were analyzed using two-way ANOVA with Tukey’s multiple-comparison test. (F) Data represent mean of four donors. *p≤0.05, **p≤0.01.
Figure 1—figure supplement 1.
Figure 1—figure supplement 1.. The frequency of RTN1A protein expression in resident Langerhans cells (rLCs) and emigrated LCs (eLCs).
(A.) Percentage of total Reticulon 1A+ (RTN1A+) resident Langerhans cells (rLCs) and emigrated LCs (eLCs), analyzed with flow cytometry. Viable rLCs and eLCs were gated for CD1a and CD207. Data shown as standard error of the mean (SEM), each dot represents one donor. rLCs: n=4, eLCs = n = 5. (B, C) Frequency of RTN1A expression in LCs. Representative dot blots showing flow cytometry analysis of (B) freshly isolated rLCs and (C) eLCs, stained for CD207, CD1a, and RTN1A. Quantification of the percentage of double-positive LCs s shown. Data shown as standard error of the mean (SEM), each dot represents one donor. CD207: n=2–4, CD1a: n=5.
Figure 2.
Figure 2.. Inhibition of Reticulon 1A (RTN1A) in resident Langerhans cells (rLCs) significantly alters dendrite length and distribution.
(A) 3D projections of epidermal sheets upon 24 hr of culture, indicated treatment, and vimentin (VIM) staining (left panel). Shown are single rLC 3D trajectories based on intermediate filament expression (right panel). Scale bar: 10 μm. (B, C) Evaluation of the average rLC branch lengths and Sholl analysis of rLC dendricity upon 24 hr of culture and indicated treatments. Four fields of view (FOVs) were evaluated of four donors and data analyzed using two-way ANOVA with Tukey‘s multiple-comparison test, ns = not significant. *p≤0.05, ****p≤0.0001.
Figure 3.
Figure 3.. Hampering Reticulon 1A (RTN1A) function decreases the Langerhans cell (LC) migration potential and alters the marker expression in emigrated LCs (eLCs).
(A, B) Enumeration and ab uptake of pre-gated CD207+CD1a+ eLCs, collected from culture wells with epidermal sheets at indicated time points and analyzed via flow cytometry. (A) Data are presented as standard error of the mean (SEM) from triplicates of three donors. Ordinary one-way ANOVA with Tukey’s multi-comparison test was used. *p≤0.05. (B) Data from triplicates, including three donors, are shown as mean fold change to untreated (UT) eLCs. (C) Marker expression profile of pre-gated CD207+ eLCs upon 24 hr of culture, treatment, and flow cytometry analysis. Data shown represent mean ± SEM of three donors and were analyzed using two-way ANOVA Tukey’s multi-comparison test. *p≤0.05. (D) Adhesion molecule concentrations in supernatants of cultivated epidermal sheets with indicated 24 hr treatments and subsequent LEGENDplex bead array measurement. Data are shown as SEM from duplicates of four donors and were analyzed using two-way ANOVA with Tukey’s multiple-comparison test. *p≤0.05, **p≤0.01.
Figure 4.
Figure 4.. Expression of Reticulon 1A (RTN1A) in the myeloid THP-1 cell line affects the cell size.
(A) Workflow for the generation of THP-1 RTN1A+ cells and their comparative analysis with THP-1 wild-type (wt) cells. (B) Representative immunofluorescence (IF) images of THP-1 wt and THP-1 RTN1A+ cells on adhesion slides stained for RTN1A, vimentin (VIM), and nuclei (4′,6-diamidino-2-phenylindole [DAPI]). n=4; scale bar: 10 μm. (C) Comparative evaluation of the cell area revealed substantial divergences between THP-1 wt and THP-1 RTN1A+ cells. Data are shown as standard error of the mean (SEM) from four fields of view (FOVs; n=4) and were analyzed using unpaired, two-tailed Student’s t test. ****p≤0.0001. (D, E) Representative IF images and quantification using Manders’ coefficient of RTN1A co-localization with filamentous proteins in a THP-1 RTN1A+ cell within three-cell compartments: bottom, middle, and top of the cell (right panel). Scale bar: 10 μm. Data are shown as SEM (10 cells/4 FOVs; n=2), and analyzed using two-way ANOVA with Tukey‘s multiple-comparison test. *p≤0.05, ****p≤0.0001. (F) Evaluation of the cell number and proliferation rate of THP-1 wt and THP-1 RTN1A+ cells within the time period indicated. Data presented as SEM were analyzed with two-way ANOVA, Sidak’s multiple-comparison test (n=3). *p<0.05, **p≤0.01, ***p≤0.001.
Figure 4—figure supplement 1.
Figure 4—figure supplement 1.. Expression of RTN1A in THP-1 cells leads to constriction of intermediate filaments and their colocalization with RTN1A.
(A) Representative immunofluorescence (IF) images of THP-1 wild-type (wt) and THP-1 Reticulon 1A+ (RTN1A+) cells on adhesion slides stained with vimentin (VIM) and demonstrated as LUT-fire. THP-1 RTN1A+ cells display markedly more condensed intermediate filament structures in comparison to THP-1 wt cells. Scale bar: 10 μm. (B) Representative IF image of THP-1 RTN1A+ cells stained for RTN1A, F-actin, VIM, and nuclei. Image is shown as montage of Z-stack slices.
Figure 5.
Figure 5.. Reticulon 1A (RTN1A) considerably alters the morphology of THP-1 RTN1A+ macrophages (Mφs) as well as enhances aggregate formation and impairs Ca2+ flux in THP-1 RTN1A+ cells.
(A) Workflow for the differentiation and comparative analysis of THP-1 RTN1A+ Mφs and THP-1 wild-type (wt) Mφs. (B) Representative bright-field (BF) and immunofluorescence images (IF; co-staining with RTN1A, F-actin, vimentin [VIM], and 4′,6-diamidino-2-phenylindole [DAPI]) of THP-1 wt Mφs and THP-1 RTN1A+ Mφs. Scale bar: BF: 31 and IF: 10 μm, n=4. (C, D) Comparative analysis of cell body size and average length of cell protrusions of differentiated THP-1 wt Mφs and THP-1 RTN1A+ Mφs. Data were analyzed using unpaired, two-tailed Student’s t test, n=4. ****p≤0.0001. (E) Comparative co-localization between RTN1A, F-actin, and VIM using Manders’ coefficient. Data shown are standard error of the mean (SEM), n=4. ****p≤0.0001. (F) Representative BF image of THP-1 wt and THP-1 RTN1A+ cells forming aggregates during culture. Scale bar: 100 µm. (G) Enumeration of THP-1 wt and THP-1 RTN1A+ cell aggregates. Data are demonstrated as SEM from four fields of view per passage and analyzed using unpaired, two-tailed Student’s t test, n=6. (H) Adhesion molecule concentrations in supernatants after 48 hr of THP-1 wt and THP-1 RTN1A+ cell cultivation, measured in duplicates with LEGENDplex bead array. Data are shown as SEM from three different passages and were analyzed using unpaired, two-tailed Student’s t test. *p≤0.05. (I, J) Ratiomeric analysis of early and late phase calcium flux in THP-1 wt and THP-1 RTN1A+ cells using Fura-3 calcium indicator, ionomycin (n=5), and thapsigargin (n=4). Unpaired two-tailed t test was used for the response to both ionomycin and thapsigargin. ****p≤0.0001.
Figure 5—figure supplement 1.
Figure 5—figure supplement 1.. Enumeration of small and big THP-1 wild-type (wt) and THP-1 Reticulon 1A+ (RTN1A+) cell aggregates per 0.7 mm2 from four fields of view (FOVs).
The size of cellular aggregates was defined based on their area (small ~312.5 µm2 and big ~637.6 µm2). n=6.
Figure 6.
Figure 6.. Emigrated LCs (eLCs) significantly decrease Reticulon 1A (RTN1A) expression upon stimulation with TLR1/2, TLR2, and TLR7 agonists.
(A) Graphical presentation for the stimulation of epidermal sheets with TLR agonists and analysis. (B) Representative FACS blots of RTN1A expression in pre-gated eLCs upon stimulation of epidermal sheets with TLR1/2 (Pam3CSK4), TLR2 (Listeria monocytogenes), TLR2/6 (mycoplasma salivarium), TLR7 (imiquimod), TLR3/7 [polyadenylic:polyuridylic acid (poly(A:U))], and TLR3 [low and high molecular weight polyinosinic:polycytidylic acid (LMW and HMW poly(I:C))] for 24 hr. (C, D) The percentage and geometric mean fluorescence intensity (gMFI) of RTN1A in eLCs are shown as standard error of the mean (SEM) of triplicates, and analyzed using two-way ANOVA with Tukey‘s multiple-comparison test. *p≤0.05, **p≤0.01, ***p≤0.001. Some p values were not significant (ns), yet indicative of a trend for the reduction of RTN1A expression intensity. (E) Recovery of the RTN1A protein expression (% of RTN1A+ eLCs) after 48 hr of cultivation with indicated TLR agonists. Data shown represent mean ± SEM of triplicates from three donors.
Figure 6—figure supplement 1.
Figure 6—figure supplement 1.. Expression pattern of RTN1A protein within TLR-activated eLCs and their quantification.
(A) Gating strategy for emigrated Langerhans cells (eLCs) as analyzed with flow cytometry. (B, C) Reticulon 1A (RTN1A) distribution within TLR-activated eLCs and their quantification. Data shown represent mean ± standard error of the mean (SEM) of triplicates from four donors. Data set was analyzed using two-way ANOVA, Dunnett’s multiple-comparison test. *p0.05.
Figure 7.
Figure 7.. Stimulation of epidermal sheets with TLR1/2, TLR2, and TLR7 agonists initiates cluster formation of resident Langerhans cells (rLCs).
(A) Representative immunofluorescence (IF) images of untreated (control) and indicated TLR-treated epidermal sheets upon 24 hr of culture stained with Reticulon 1A (RTN1A) (red), CD83, CD86 (green), and 4′,6-diamidino-2-phenylindole (DAPI) (blue). n=5, scale bar: 20 μm. (B) 3D projection of rLCs in an epidermal sheet after incubation with a TLR7 agonist for 24 hr (A). rLCs form big (arrow) and small (asterisk) clusters yet were also visible as single activated dendritic rLCs (hashtag). (C, D) Expression intensity of indicated markers in rLCs upon culture and treatment. Data are shown as standard error of the mean (SEM) representing four fields of view of five donors, analyzed with two-way ANOVA Tukey’s multiple-comparison test. *p0.05,***p0.001. (E) Representative IF images of untreated (control) and TLR-stimulated epidermal sheets stained for MMP-9, CCR-7, and 4′,6-diamidino-2-phenylindole (DAPI). n=2, scale bar: 20 μm. (F) Inflammatory cyto- and chemokine concentrations in supernatants of epidermal sheet cultures after 24 hr, measured in duplicates with LEGENDplex bead array. Data are shown as SEM of four donors and analyzed using two-way ANOVA with Durrett’s multiple-comparison test. *p0.05, **p0.01.
Figure 7—figure supplement 1.
Figure 7—figure supplement 1.. Resident Langerhans cells (rLCs) do not proliferate in clusters upon TLR stimulation and produce elevated levels of IL-10 and IL-23.
(A) Representative immunofluorescence images of epidermal sheets after 24 hr of cultivation only or treatment with TLR 1/2, and TLR7 agonists. Epidermal sheets were stained for Ki67 (green) and nuclei (blue). n=2, scale bar: 20 μm. (B,C) Inflammatory cyto- and chemokines concentration measured in supernatants of epidermal sheet cultures after 24 hr, with LEGENDplex bead array. Data are shown as SEM from four donors and analyzed using two-way ANOVA with Durrett’s multiple-comparison test and were not significant.
Figure 8.
Figure 8.. Summary and overview on the function of Reticulon 1A (RTN1A).
Inhibition of RTN1A protein in resident Langerhans cells (LCs) in human epidermis ex vivo caused dendrite retraction, induced cell adhesion, and reduced LC migration. Stimulation of LCs with TLR agonists downregulated RTN1A expression and induced cluster formation (upper panel). Furthermore, expression of RTN1A in THP-1 cells altered cell size, morphology, calcium release from endoplasmic reticulum (ER) stores and cell aggregation in vitro (lower panel).
Author response image 1.

References

    1. Battaglia RA, Delic S, Herrmann H, Snider NT. Vimentin on the move: new developments in cell migration. F1000Research. 2018;7:1–10. doi: 10.12688/f1000research.15967.1. - DOI - PMC - PubMed
    1. Battin C, Hennig A, Mayrhofer P, Kunert R, Zlabinger GJ, Steinberger P, Paster W. A human monocytic NF-κB fluorescent reporter cell line for detection of microbial contaminants in biological samples. PLOS ONE. 2017;12:e0178220. doi: 10.1371/journal.pone.0178220. - DOI - PMC - PubMed
    1. Baya Mdzomba J, Joly S, Rodriguez L, Dirani A, Lassiaz P, Behar-Cohen F, Pernet V. Nogo-A-targeting antibody promotes visual recovery and inhibits neuroinflammation after retinal injury. Cell Death & Disease. 2020;11:101. doi: 10.1038/s41419-020-2302-x. - DOI - PMC - PubMed
    1. Bernimoulin MP, Zeng XL, Abbal C, Giraud S, Martinez M, Michielin O, Schapira M, Spertini O. Molecular basis of leukocyte rolling on PSGL-1. predominant role of core-2 O-glycans and of tyrosine sulfate residue 51. The Journal of Biological Chemistry. 2003;278:37–47. doi: 10.1074/jbc.M204360200. - DOI - PubMed
    1. Berridge MJ, Bootman MD, Roderick HL. Calcium signalling: dynamics, homeostasis and remodelling. Nature Reviews. Molecular Cell Biology. 2003;4:517–529. doi: 10.1038/nrm1155. - DOI - PubMed