. 2022 Oct 25;94(42):14652-14658.
doi: 10.1021/acs.analchem.2c02870. Epub 2022 Oct 12.

Fast Mass Microscopy: Mass Spectrometry Imaging of a Gigapixel Image in 34 Minutes

Affiliations

Fast Mass Microscopy: Mass Spectrometry Imaging of a Gigapixel Image in 34 Minutes

Aljoscha Körber et al. Anal Chem. .

Erratum in

Abstract

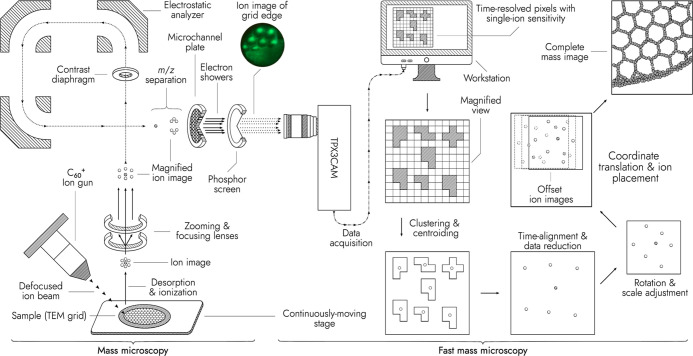
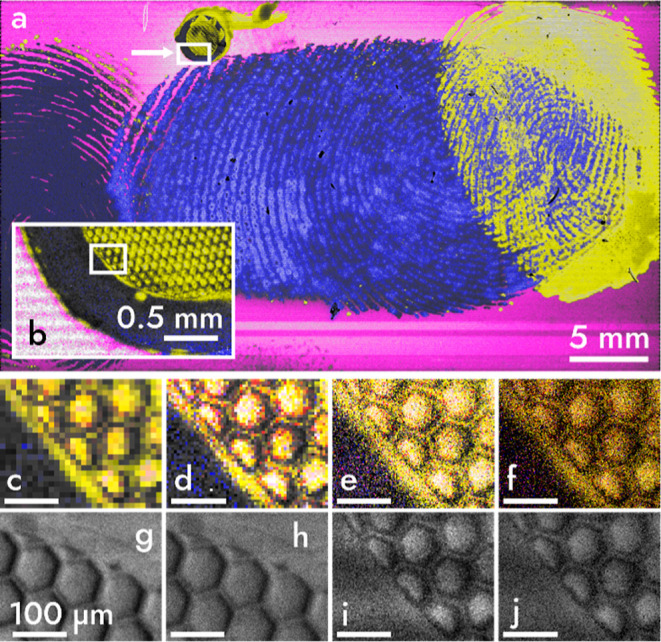
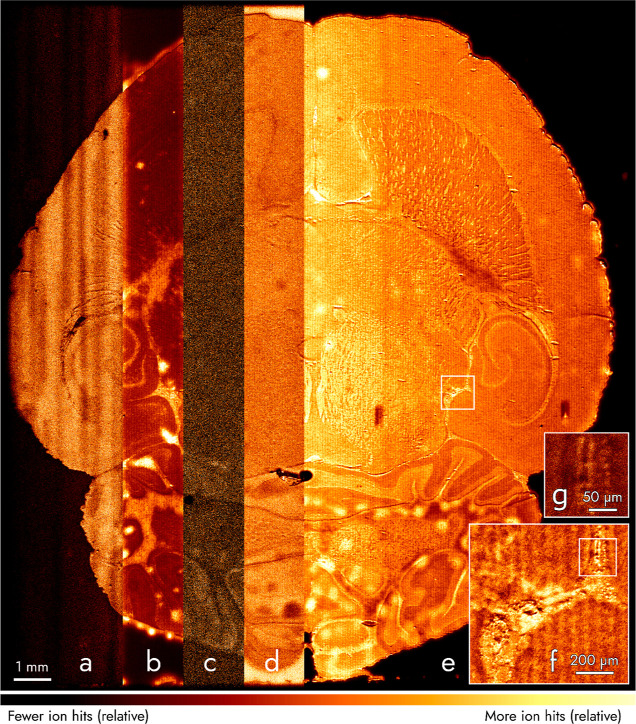
Mass spectrometry imaging (MSI) maps the spatial distributions of chemicals on surfaces. MSI requires improvements in throughput and spatial resolution, and often one is compromised for the other. In microprobe-mode MSI, improvements in spatial resolution increase the imaging time quadratically, thus limiting the use of high spatial resolution MSI for large areas or sample cohorts and time-sensitive measurements. Here, we bypass this quadratic relationship by combining a Timepix3 detector with a continuously sampling secondary ion mass spectrometry mass microscope. By reconstructing the data into large-field mass images, this new method, fast mass microscopy, enables orders of magnitude higher throughput than conventional MSI albeit yet at lower mass resolution. We acquired submicron, gigapixel images of fingerprints and rat tissue at acquisition speeds of 600,000 and 15,500 pixels s-1, respectively. For the first image, a comparable microprobe-mode measurement would take more than 2 months, whereas our approach took 33.3 min.


Conflict of interest statement

The authors declare no competing financial interest.

Figures

Figure 1
Figure 1
Scheme of the mass microscope modified with a TPX3CAM detector. A defocused C60+ ion beam irradiates a sample on a quickly and continuously moving stage, generating an ion image. The ion image is extracted into a TOF analyzer and magnified. The mass-separated ion image is projected onto a microchannel plate (MCP), producing electron showers. The electrons are converted into photons by a P43 phosphor screen. The photons are recorded with the TPX3CAM. The data are clustered and time-aligned to sets of single-ion impact coordinates. Ion coordinates are translated to sample stage coordinates and a larger ion image of the stage-scanned sample surface is constructed. A photo of the phosphor screen (top-left corner) shows the distribution of surface ions when the fullerene ion beam irradiates the edge of a TEM grid.
Figure 2
Figure 2
Mass image of a 42 × 23.5 mm2 area recorded in 33.3 min (a) A false-color mass image of three fingerprints and a TEM grid on an ITO slide with blue, magenta, and yellow colors mapped to mass-to-charge values (m/z) of 55, 115, and 23 m/z, which are tentatively assigned to either C4H7+ or C3H3O+, In+, and Na+, respectively. A white arrow in (a) points to a box indicating an intermediate zoom (b) of the TEM grid, displayed at a pixel size of 10 μm. A white box in (b) highlights the region of the grid used for magnification in (c–f) that are viewed with pixel sizes of 10 (c), 5 (d), 2 (e), and 0.9 (f) μm. Total ion count (TIC) images (g–j) are shown in gray at pixel sizes of 2 (g,i) and 0.9 (h,j) μm. Images (g,h) are of an identically sized grid imaged at slower speed and show increased ion counts. Viewed at a pixel size of 0.9 μm, the image is >1.2 gigapixels.
Figure 3
Figure 3
Mass image of a 16.5 × 18 mm2 area of a rat brain section. Areas (a–e) correspond to m/z values attributed to cholesterol (summed ion hits for M+ at m/z 386 and [M–H2O + H]+ at 369, respectively), Na+ (m/z 23), monoacylglycerides and their fragments (m/z 338 summed with 354 and 361), C7H7+ (m/z 91), and K+ (m/z 39), respectively, and are viewed with a pixel size of 5 μm. Regions in white boxes in (e,f) are magnified in (f,g) with pixel sizes of 2 and 0.5 μm, respectively. Each area (a–g) was normalized to the most intense pixel within that area. Viewed at a pixel size of 0.5 μm, the image is ≈1.2 gigapixels.

References

    1. Benninghoven A. Chemical Analysis of Inorganic and Organic Surfaces and Thin Films by Static Time-of-Flight Secondary Ion Mass Spectrometry (TOF-SIMS). Angew. Chem., Int. Ed. Engl. 1994, 33, 1023–1043. 10.1002/anie.199410231. - DOI
    1. Gilmore I. S. SIMS of Organics—Advances in 2D and 3D Imaging and Future Outlook. J. Vac. Sci. Technol., A 2013, 31, 050819.10.1116/1.4816935. - DOI
    1. McPhail D. S. Applications of Secondary Ion Mass Spectrometry (SIMS) in Materials Science. J. Mater. Sci. 2006, 41, 873–903. 10.1007/s10853-006-6568-x. - DOI
    1. Chughtai K.; Heeren R. M. A. Mass Spectrometric Imaging for Biomedical Tissue Analysis. Chem. Rev. 2010, 110, 3237–3277. 10.1021/cr100012c. - DOI - PMC - PubMed
    1. McDonnell L. A.; Heeren R. M. A. Imaging Mass Spectrometry. Mass Spectrom. Rev. 2007, 26, 606–643. 10.1002/mas.20124. - DOI - PubMed

Publication types

MeSH terms