Review
. 2023 Jul 1;147(7):826-836.
doi: 10.5858/arpa.2021-0635-RA.

Building the Model

Affiliations
Review

Building the Model

He S Yang et al. Arch Pathol Lab Med. .

Abstract

Context.—: Machine learning (ML) allows for the analysis of massive quantities of high-dimensional clinical laboratory data, thereby revealing complex patterns and trends. Thus, ML can potentially improve the efficiency of clinical data interpretation and the practice of laboratory medicine. However, the risks of generating biased or unrepresentative models, which can lead to misleading clinical conclusions or overestimation of the model performance, should be recognized.

Objectives.—: To discuss the major components for creating ML models, including data collection, data preprocessing, model development, and model evaluation. We also highlight many of the challenges and pitfalls in developing ML models, which could result in misleading clinical impressions or inaccurate model performance, and provide suggestions and guidance on how to circumvent these challenges.

Data sources.—: The references for this review were identified through searches of the PubMed database, US Food and Drug Administration white papers and guidelines, conference abstracts, and online preprints.

Conclusions.—: With the growing interest in developing and implementing ML models in clinical practice, laboratorians and clinicians need to be educated in order to collect sufficiently large and high-quality data, properly report the data set characteristics, and combine data from multiple institutions with proper normalization. They will also need to assess the reasons for missing values, determine the inclusion or exclusion of outliers, and evaluate the completeness of a data set. In addition, they require the necessary knowledge to select a suitable ML model for a specific clinical question and accurately evaluate the performance of the ML model, based on objective criteria. Domain-specific knowledge is critical in the entire workflow of developing ML models.


Figures

Figure 1.
Figure 1.
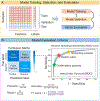
Four major components in the workflow of developing machine learning (ML) models: data collection (A), data preprocessing (B), ML model development (C), and ML model evaluation (D). The analysis of laboratory data may require several iterations of the above steps. Abbreviations: AUC, area under the receiving operating characteristic curve; EHR, electronic health record.
Figure 2.
Figure 2.
Illustration of different dimension reduction algorithms on the same synthetic data set. A, The synthetic data points were sampled from a mixture of four 3-dimensional Gaussian distributions. High-dimensional data in the real world may not be Gaussian or with clear clusters. Here, different colors are used to represent different Gaussian distributions as a simplified example. B, The first 2 principal components of the principal component analysis (PCA) on the original data. In this example, PCA is not able to distinguish original data in the linearly transformed 2-dimensional space. C, The first 2 dimensions of the original data transformed by t-distributed stochastic neighbor embedding (t-SNE) analysis, which is a nonlinear dimension reduction technique. PCA analysis is used for initialization before t-SNE to keep the global structure of the original data. Here, t-SNE analysis can distinguish different data clusters in a 2-dimensional space. D, The first 2 dimensions of the original data transformed by unified manifold approximation and projection (UMAP) analysis, another nonlinear dimensionality reduction technique. UMAP analysis successfully distinguishes 4 data clusters in a lower space after PCA initialization.
Figure 3.
Figure 3.
Evaluation criteria of ML models. A, The workflow of training, selection, and evaluation of ML models. When selecting ML models, it is common to split data into training, validation, and test sets. The model is trained on the training set and specific hyperparameters are selected based on the model performance on the validation set. Final model evaluation is performed on the unseen test set. B, Evaluation criteria for the binary ML classification model. The ROC curve and AUROC are the most commonly used metrics for model evaluation. The x-axis of the ROC curve is the false-positive rate (1 – specificity), and the y-axis is the true-positive rate (sensitivity). The red star represents the operating point determined by the maximum Youden index where the sum of sensitivity and specificity is the highest on the curve. The yellow and green stars represent the operating points used for screening (high sensitivity) and confirmatory (high specificity) purposes, respectively. Once an operating point is selected, confusion matrix as well as precision, recall, accuracy, and F1 score can be calculated to summarize the performance of a model. Abbreviations: AUROC, area under the receiver operating characteristic curve; FN, false negative; FP, false positive; ML, machine learning; ROC, receiver operating characteristic; TN, true negative; TP, true positive.

References

    1. Jordan MI, Mitchell TM. Machine learning: trends, perspectives, and prospects. Science. 2015;349(6245):255–260. - PubMed
    1. Luo Y, Szolovits P, Dighe AS, Baron JM. Using machine learning to predict laboratory test results. Am J Clin Pathol. 2016;145(6):778–788. - PubMed
    1. Rosenbaum MW, Baron JM. Using machine learning-based multianalyte delta checks to detect wrong blood in tube errors. Am J Clin Pathol. 2018;150(6): 555–566. - PubMed
    1. Mitani T, Doi S, Yokota S, Imai T, Ohe K. Highly accurate and explainable detection of specimen mix-up using a machine learning model. Clin Chem Lab Med. 2020;58(3):375–383. - PubMed
    1. Benirschke RC, Gniadek TJ. Detection of falsely elevated point-of-care potassium results due to hemolysis using predictive analytics. Am J Clin Pathol. 2020;154(2):242–247. - PubMed