. 2022 Oct 12;17(10):e0273520.
doi: 10.1371/journal.pone.0273520. eCollection 2022.

Mitochondrial fitness and cancer risk

Affiliations

Mitochondrial fitness and cancer risk

Andrew V Kossenkov et al. PLoS One. .

Abstract

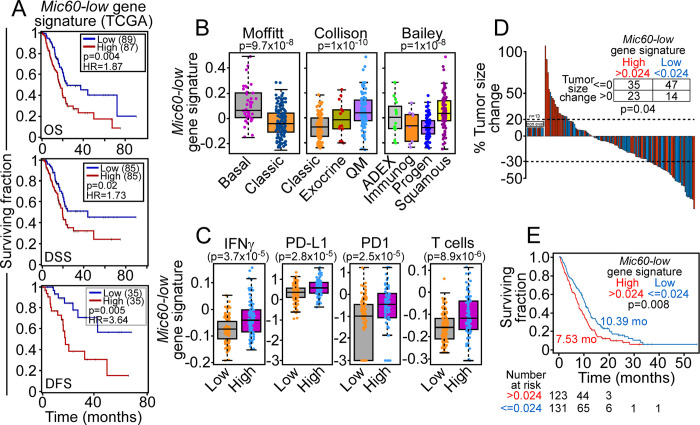
Changes in metabolism are a hallmark of cancer, but molecular signatures of altered bioenergetics to aid in clinical decision-making do not currently exist. We recently identified a group of human tumors with constitutively reduced expression of the mitochondrial structural protein, Mic60, also called mitofilin or inner membrane mitochondrial protein (IMMT). These Mic60-low tumors exhibit severe loss of mitochondrial fitness, paradoxically accompanied by increased metastatic propensity and upregulation of a unique transcriptome of Interferon (IFN) signaling and Senescence-Associated Secretory Phenotype (SASP). Here, we show that an optimized, 11-gene signature of Mic60-low tumors is differentially expressed in multiple malignancies, compared to normal tissues, and correlates with poor patient outcome. When analyzed in three independent patient cohorts of pancreatic ductal adenocarcinoma (PDAC), the Mic60-low gene signature was associated with aggressive disease variants, local inflammation, FOLFIRINOX failure and shortened survival, independently of age, gender, or stage. Therefore, the 11-gene Mic60-low signature may provide an easily accessible molecular tool to stratify patient risk in PDAC and potentially other malignancies.


Conflict of interest statement

The authors have declared that no competing interests exist.

Figures

Fig 1
Fig 1. Differential expression of a Mic60-low gene signature in cancer.
(A) TCGA tumor sets with RNA-seq data from matching normal tissues were examined for differential expression of the 11-gene Mic60-low gene signature in cancer vs. normal samples (ratio) by Wilcoxon rank-sum test. The number of tumor and normal tissue samples is indicated per each condition. Broken line, ratio of 1; red color scale, significance p value; ns, not significant. (B) Differential expression of the 11-gene Mic60-low gene signature in patient-derived tumor-free normal brain margins (MG), LGG or GBM by qPCR. The expression intensity of each gene is visualized in a heatmap. (C) The indicated representative genes in the Mic60-low gene signature were analyzed for spatial distribution in patient-derived GBM samples using the Ivy Glioblastoma Atlas Project dataset. The various GBM intratumoral compartments are indicated. (D) Kaplan-Meier survival curves of high vs. low expression of the Mic60-low gene signature in TCGA datasets of GBM-LGG, kidney renal clear cell carcinoma (KIRC), kidney renal papillary cell carcinoma (KIRP) and uveal melanoma (UVM). The number of patients per condition, p value and hazard ratio (HR) are indicated.
Fig 2
Fig 2. Characterization of Mic60 in pancreatic cancer.
(A) Heterogeneous expression of Mic60 in PDAC patients by IHC. Top Left, arrows, perinuclear and cytoplasmic expression in normal pancreatic acini (x400). Top Right, perinuclear (arrow) and apical (arrowhead) cytoplasmic expression in high-grade pancreatic intraepithelial neoplasia (x400). Bottom Left, transition between Mic60-positive well differentiated tumor (double arrows) and Mic60-negative high-grade basaloid regions (single arrow) within the same tumor gland (x400). Bottom right, absent stain in high-grade basaloid PDAC (x400). A histoscore of Mic60 staining intensity was as follows: 0, absent; 1, low; 2, medium; 3, high. (B) PDAC cell lines PANC-1 (top) or CAPAN-2 (bottom) were transfected with control non-targeting siRNA (siCtrl) or Mic60-directed siRNA (siMic60) and analyzed by Western blotting. (C) The conditions are as in (B) and transfected cell lines were analyzed for differential expression of the indicated genes in the Mic60-low gene signature by qPCR. Mean±SEM (n = 3). *, p = 0.01–0.04; **, p = 0.001–0.004; ***, p<0.0001. (D-G) The conditions are as in (B) and transfected PANC-1 (D-E) or CAPAN-2 (F-G) cells were analyzed for cell motility and representative images of DAPI-stained nuclei of migrated or invaded cells were visualized by fluorescence microscopy (D-F) and quantified (E-G). Mean±SEM (n = 3). ***, p<0.0001.
Fig 3
Fig 3. Mic60-low gene signature and PDAC risk.
(A) Kaplan-Meier plots of PDAC overall survival (OS), disease-specific survival (DSS) and disease-free status (DFS) determined by univariate Cox regression tests in the TCGA datasets (N = 32). (B) Expression of the 11-gene Mic60-low gene signature in PDAC molecular subtypes by Wilcoxon rank sum test (Moffitt) and Kruskal Wallis test (Collison, Bailey). QM, quasimesenchymal; ADEX, aberrantly differentiated endocrine exocrine; Immunogen, immunogenic; Progen, pancreatic progenitor. (C) Modulation of inflammation-associated markers, IFNγ, PD-L1, PD1 and T cells all by Wilcoxon test. (D) Waterfall plot of tumor size changes in PDAC patients treated with FOLFIRINOX by Wilcoxon test. non-eval, non-evaluable. (E) Kaplan-Meier survival curve of PDAC overall survival (95% CI: 0.533–0.9118). Analyses were carried out by single-sample Gene Set Enrichment Analysis (ssGSEA) with Mic60-low gene signature high (>0.024) or low (< = 0.024) and Wilcoxon test.

References

    1. Hanahan D, Weinberg RA. Hallmarks of cancer: the next generation. Cell. 2011;144(5):646–74. doi: 10.1016/j.cell.2011.02.013 . - DOI - PubMed
    1. Ward PS, Thompson CB. Metabolic reprogramming: a cancer hallmark even warburg did not anticipate. Cancer Cell. 2012;21(3):297–308. Epub 2012/03/24. doi: 10.1016/j.ccr.2012.02.014 ; PubMed Central PMCID: PMC3311998. - DOI - PMC - PubMed
    1. Potter M, Newport E, Morten KJ. The Warburg effect: 80 years on. Biochem Soc Trans. 2016;44(5):1499–505. doi: 10.1042/BST20160094 ; PubMed Central PMCID: PMC5095922. - DOI - PMC - PubMed
    1. Martinez-Reyes I, Cardona LR, Kong H, Vasan K, McElroy GS, Werner M, et al.. Mitochondrial ubiquinol oxidation is necessary for tumour growth. Nature. 2020;585(7824):288–92. Epub 2020/07/10. doi: 10.1038/s41586-020-2475-6 ; PubMed Central PMCID: PMC7486261. - DOI - PMC - PubMed
    1. Tan AS, Baty JW, Dong LF, Bezawork-Geleta A, Endaya B, Goodwin J, et al.. Mitochondrial genome acquisition restores respiratory function and tumorigenic potential of cancer cells without mitochondrial DNA. Cell Metab. 2015;21(1):81–94. doi: 10.1016/j.cmet.2014.12.003 . - DOI - PubMed

Publication types

MeSH terms

LinkOut - more resources