. 2022 Oct 14;8(41):eabn8367.
doi: 10.1126/sciadv.abn8367. Epub 2022 Oct 12.

Upper cortical layer-driven network impairment in schizophrenia

Affiliations

Upper cortical layer-driven network impairment in schizophrenia

Mykhailo Y Batiuk et al. Sci Adv. .

Abstract

Schizophrenia is one of the most widespread and complex mental disorders. To characterize the impact of schizophrenia, we performed single-nucleus RNA sequencing (snRNA-seq) of >220,000 neurons from the dorsolateral prefrontal cortex of patients with schizophrenia and matched controls. In addition, >115,000 neurons were analyzed topographically by immunohistochemistry. Compositional analysis of snRNA-seq data revealed a reduction in abundance of GABAergic neurons and a concomitant increase in principal neurons, most pronounced for upper cortical layer subtypes, which was substantiated by histological analysis. Many neuronal subtypes showed extensive transcriptomic changes, the most marked in upper-layer GABAergic neurons, including down-regulation in energy metabolism and up-regulation in neurotransmission. Transcription factor network analysis demonstrated a developmental origin of transcriptomic changes. Last, Visium spatial transcriptomics further corroborated upper-layer neuron vulnerability in schizophrenia. Overall, our results point toward general network impairment within upper cortical layers as a core substrate associated with schizophrenia symptomatology.


Figures
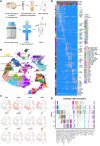
Fig. 1.
Fig. 1.. snRNA-seq analysis of the DLPFC from patients with schizophrenia and matched controls.
(A) Experimental design of the snRNA-seq measurements. FACS, fluorescence-activated cell sorting. (B) UMAP representation of the measured nuclei, colored by subtypes. (C) Expression of marker genes for major cortical cell types, visualized on the UMAP embedding: GABAergic interneurons, principal neurons, and glia; additional markers distinguish families of GABAergic interneurons and principal neurons. (D) Heatmap showing expression of markers for specific neuronal subtypes. (E) Estimated cortical layer positions of the neuronal subtypes. These are predictions based on Allen Institute data (32, 33) with manual cortical layer microdissections before nuclei isolation and sequencing. Because of manual layer dissections, small degree of mispositioning of subtypes (e.g., principal neurons in layer 1) is expected.
Fig. 2.
Fig. 2.. Compositional and transcriptomic changes in the cortex of patients with schizophrenia.
(A) Cell density differences between schizophrenia and control groups analyzed using UMAP embedding. Left: Visualization of control and schizophrenia cells. Middle: Cell density visualized from the control and schizophrenia samples, using UMAP embedding. Right: Statistical assessment of the cell density differences. Student’s t test was used, visualized as a z score. (B) Change in neuronal composition evaluated by compositional data analysis. Top cell types distinguishing composition of control and schizophrenia samples are shown. The x axis indicates the separating coefficient for each cell type, with the positive values corresponding to neurons with increased abundance in schizophrenia and negative values to decreased abundance. The boxplots and individual data points show uncertainty based on bootstrap resampling of samples and cells (for full plot, see fig. S6C). Red line represents cutoff for significance of adjusted (by the Benjamini-Hochberg method) P values (significant cell types are above the line). ***P = 0.0001 to 0.001. (C and D) Boxplots showing the magnitude of transcriptional change between control and schizophrenia states for medium-resolution (C) and high-resolution (D) annotations. The magnitude is assessed on the basis of a Pearson linear correlation coefficient, normalized by the medium variation within control and schizophrenia groups (see Materials and Methods). The cell types are ordered on the basis of the mean distance, with the most affected cell types shown on the right. The distribution here arises as a result of comparisons of different pairs of patients/controls. The lower panels show the predicted cortical layer positions. Multiple correction was done by Benjamini-Hochberg. *P = 0.01 to 0.05. ns, not significant. (E) Boxplots showing interindividual gene expression distances (based on Pearson correlation) within control and schizophrenia samples, averaged across all neuronal cell types. ****P = 0.00001 to 0.0001. (F) Multidimensional scaling visualization of the similarity of gene expression between all samples, based on the distances shown in (E).
Fig. 3.
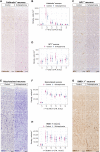
Fig. 3.. Changes in density and distribution of CR+, PV+, VIP, and ID2 interneuron subtypes in the cortex of patients with schizophrenia.
(A) Experimental scheme for immunohistochemical (IHC) analysis. (B and C) Representative images and layer-wise IHC quantification of CR+ neurons in the DLPFC in patients with schizophrenia (SCZ) and control individuals (CTR); linear mixed model analysis with Bonferroni multiple comparison correction. Scale bars, 100 μm. (D) Heatmap showing expression of major markers for subgrouping of ID2 and VIP subtypes of GABAergic interneurons. (E and F) Overview of simultaneous CR IHC and smFISH of VIP and CRH mRNAs, and representative confocal images for three subgroups of ID2 and VIP subtypes that could be distinguished on the basis of triple CR/VIP/CRH labeling in L2 DLPFC. Scale bars, 100 mm. (G to I) Quantification of density for CR+/VIP+/CRH+ (VIP_CRH, VIP_ABI3BP, and VIP_TYR), CR+/VIP/CRH+ (ID2_PAX6), and CR+/VIP/CRH (ID2_NCKAP5 and VIP_SSTR1) subgroups of ID2 and VIP subtypes; linear mixed model analysis with Bonferroni multiple comparison correction. (J and K) Representative images and layer-wise quantification of PV+ neurons in the DLPFC in patients with schizophrenia and control subjects; linear mixed model analysis with Bonferroni multiple comparison correction. Scale bars, 100 μm. Diamonds on all plots represent means; error bars, ±SD.
Fig. 4.
Fig. 4.. Changes in density and distribution of CB+and NPY+ interneurons and excitatory neurons in the DLPFC in schizophrenia.
(A and B) Representative immunohistochemical (IHC) images and layer-wise quantification of GABAergic interneurons that express CB in the DLPFC in patients with schizophrenia and control subjects. (C and D) Representative IHC images and layer-wise quantification of GABAergic interneurons that express NPY neurons in the DLPFC in patients with schizophrenia and control subjects. (E and F) Representative IHC images and layer-wise quantification of Nissl-labeled neurons in the DLPFC in patients with schizophrenia and control subjects. (G and H) Representative IHC images and layer-wise quantification of principal neurons labeled by SMI31.1 in the DLPFC in patients with schizophrenia and control subjects. Diamonds on all plots represent means; error bars, ±SD. Analysis of cell densities on (B), (D), (F), and (H) was done using linear mixed model analysis with Bonferroni multiple comparison correction.
Fig. 5.
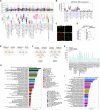
Fig. 5.. Schizophrenia-associated changes in the DEGs and pathways.
(A) Fraction of all DEGs with predicted cortical layer positions below. Line inside the box represents median, and lower and upper hinges of the box correspond to the first and third quartiles. Upper and lower whiskers correspond to the smallest and the largest values. (B) Expression levels of CHRFAM7A across neuronal subtypes in the DLPFC identified by snRNA-seq. CR+ subtypes are highlighted in blue; P values were estimated by Wald test in DESeq2, multiple comparison correction by the Benjamini-Hochberg method. Diamond represents median. (C) Representative images for detection of CHRFAM7A mRNA in L2 CR+ neurons of schizophrenia and control subjects. Scale bars, 20 μm. (D) Quantification of proportion of L2 CR+ neurons that colocalize with CHRFAM7A mRNA in schizophrenia and control DLPFC (n = 3 control + 3 schizophrenia, means ± SD) and CHRFAM7A mRNA levels in L2 CR+ neurons. (E) DEGs were determined for antipsychotic-positive (100) and antipsychotic-negative (47) bulk RNA-seq samples for the DLPFC of schizophrenia patients. Overlap between antipsychotic-associated DEGs and DEGs for control versus schizophrenia in our snRNA-seq dataset was identified by hypergeometric test. Benjamini-Hochberg–adjusted P values. (F and G) DEGs were determined for placebo versus haloperidol/clozapine bulk RNA-seq samples for the DLPFC of rhesus macaque (n = 34). Overlap between drug treatment DEGs and DEGs for control versus schizophrenia in our snRNA-seq dataset was identified by hypergeometric test. Benjamini-Hochberg–adjusted P values. (H and I) List of GO terms significantly enriched in the set of top down- and up-regulated genes in the neuronal subtypes from schizophrenia DLPFC, compared to controls. Top 3 GO terms by adjusted P value per each cell type are shown. Colored by neuronal subtype. UL, upper layers. UL GO terms are in bold. Bonferroni-adjusted P values are shown. Dotted line represents P value significance cutoff. The full list of significant GO terms is in figs. S10 and S11.
Fig. 6.
Fig. 6.. Transcription factor networks in schizophrenia and enrichment of DEGs in genetic association with schizophrenia.
(A and B) Transcription factor (TF) enrichment in DEG genes was estimated based on the z score of the DEGs and was normalized for the purpose of hierarchical clustering. Overall, expression of 267 unique transcription factors across all cell types was estimated, which were further analyzed with hierarchical clustering to identify differentially enriched regulators associated with schizophrenia (see fig. S13 for the complete heatmap). NES, Normalized enrichment score. (C and D) Hypergeometric testing to identify significant overlap between DEGs in our dataset with genes relevant for schizophrenia from the DisGeNET database (60) and from the SFARI database. Black dotted line indicates P value cutoff. P values were adjusted using Bonferroni correction. (E) Linkage disequilibrium score regression analysis to estimate correlation between DEGs and with the largest schizophrenia GWAS dataset (61). L2_CUX2_LAMP5_PDGFD subtype (marked in red) showed significant correlation after adjusting P value by Bonferroni correction. Dotted line, significance cutoff.
Fig. 7.
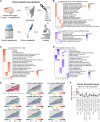
Fig. 7.. Spatial transcriptomics analysis identified local transcriptional and compositional perturbations.
(A) Experimental scheme for spatial transcriptomics. (B) Individual GO terms in neuronal subtypes in the DLPFC of patients with schizophrenia that were enriched in up-regulated genes in both snRNA-seq and spatial transcriptomics data. GO term P values were Benjamini-Hochberg–corrected. (C and D) Clusters of GO terms in neuronal subtypes in the DLPFC of patients with schizophrenia that were enriched in up/down-regulated genes in spatial transcriptomics data. Visium spots were aggregated by cortical layer (L1-L6) for DE analysis. P values represent Bonferroni-corrected values of 0.05 or lower. (E) Spatial location of a selected set of neuronal cell types in Visium data. The location was estimated using Stereoscope cell subtype deconvolution from Visium mini-bulk data. Subtype location largely recapitulates expected spatial distribution demonstrated in Fig. 1E. Fractions of deconvoluted cell subtypes per Visium spot are shown on top of the representative tissue slice. Neuronal subtypes correspond to subtypes identified using snRNA-seq in Fig. 1B. Non-neuronal cell types were predicted using Allen Institute Cell Types Database: RNA-Seq Data Human M1 - 10x Genomics reference dataset (84). The detailed location of all subtypes across all samples is demonstrated in fig. S14. (F) Changes in neuronal composition in the DLPFC of patients with schizophrenia that were identified in the spatial transcriptomics data. Normality was tested using Shapiro-Wilk test, and equality of variances was tested using Levene’s test. As part of the data was not normally distributed, independent two-group Mann-Whitney U test was used to test significance of differences for all group pairs. Multiple comparison correction was done using the Benjamini-Hochberg method. Line inside the box represents median, and lower and upper hinges of the box correspond to the first and third quartiles. Upper and lower whiskers correspond to the smallest and the largest values, and not more than 1.5× interquartile range.

References

    1. GBD 2017 Disease and Injury Incidence and Prevalence Collaborators , Global, regional, and national incidence, prevalence, and years lived with disability for 354 Diseases and Injuries for 195 countries and territories, 1990–2017: A systematic analysis for the Global Burden of Disease Study 2017. Lancet 392, 1789–1858 (2018). - PMC - PubMed
    1. Millan M. J., Andrieux A., Bartzokis G., Cadenhead K., Dazzan P., Fusar-Poli P., Gallinat J., Giedd J., Grayson D. R., Heinrichs M., Kahn R., Krebs M. O., Leboyer M., Lewis D., Marin O., Marin P., Meyer-Lindenberg A., McGorry P., McGuire P., Owen M. J., Patterson P., Sawa A., Spedding M., Uhlhaas P., Vaccarino F., Wahlestedt C., Weinberger D., Altering the course of schizophrenia: Progress and perspectives. Nat. Rev. Drug Discov. 15, 485–515 (2016). - PubMed
    1. Owen M. J., Sawa A., Mortensen P. B., Schizophrenia. Lancet 388, 86–97 (2016). - PMC - PubMed
    1. Lewis D. A., Hashimoto T., Volk D. W., Cortical inhibitory neurons and schizophrenia. Nat. Rev. Neurosci. 6, 312–324 (2005). - PubMed
    1. Skene N. G., Bryois J., Bakken T. E., Breen G., Crowley J. J., Gaspar H. A., Giusti-Rodriguez P., Hodge R. D., Miller J. A., Muñoz-Manchado A. B., O’Donovan M. C., Owen M. J., Pardiñas A. F., Ryge J., Walters J. T. R., Linnarsson S., Lein E. S.; Major Depressive Disorder Working Group of the Psychiatric Genomics Consortium, Sullivan P. F., Hjerling-Leffler J., Genetic identification of brain cell types underlying schizophrenia. Nat. Genet. 50, 825–833 (2018). - PMC - PubMed

MeSH terms