. 2022 Oct 14;8(41):eabo7527.
doi: 10.1126/sciadv.abo7527. Epub 2022 Oct 12.

Synaptic ensembles between raphe and D1R-containing accumbens shell neurons underlie postisolation sociability in males

Affiliations

Synaptic ensembles between raphe and D1R-containing accumbens shell neurons underlie postisolation sociability in males

Ja Eun Choi et al. Sci Adv. .

Abstract

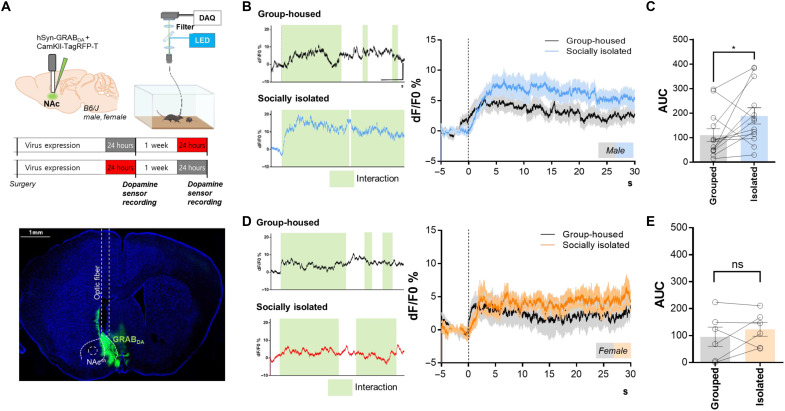
Social animals expend considerable energy to maintain social bonds throughout their life. Male and female mice show sexually dimorphic behaviors, yet the underlying neural mechanisms of sociability and their dysregulation during social disconnection remain unknown. Dopaminergic neurons in dorsal raphe nucleus (DRNTH) is known to contribute to a loneliness-like state and modulate sociability. We identified that activated subpopulations in DRNTH and nucleus accumbens shell (NAcsh) during 24 hours of social isolation underlie the increase in isolation-induced sociability in male but not in female mice. This effect was reversed by chemogenetically and optogenetically inhibiting the DRNTH-NAcsh circuit. Moreover, synaptic connectivity among the activated neuronal ensembles in this circuit was increased, primarily in D1 receptor-expressing neurons in NAcsh. The increase in synaptic density functionally correlated with elevated dopamine release into NAcsh. Overall, specific synaptic ensembles in DRNTH-NAcsh mediate sex differences in isolation-induced sociability, indicating that sex-dependent circuit dynamics underlie the expression of sexually dimorphic behaviors.


Figures

Fig. 1.
Fig. 1.. Behavioral and electrophysiological changes in DRNTH neurons following 24 hours of social isolation.
(A) Experimental scheme of group-housing and social isolation for the three-chamber test. (B) In male mice, a significant increase in time spent with the social target is detected in the socially isolated mice compared to the group-housed mice (Grouped, n = 16, 75.52 ± 3.095; Isolated, n = 17, 86.01 ± 1.878%; **P = 0.0062). (C) In female mice, social isolation does not alter time spent with the social target (Grouped, n = 10, 72.16 ± 2.927; Isolated, n = 10, 75.56 ± 2.776; P = 0.4106). ns, not significant. (D) Dopaminergic neurons in DRN of TH::cre;Ai14 mouse. Scale bar, 50 μm. In male mice, DRNTH neuronal excitability (delivery of a 200-pA current pulse) shows a robust increase after 2 hours of isolation (Grouped, n = 17 from five mice, 2.529 ± 0.6131; Isolated, n = 19, from four mice, 4.789 ± 0.8257; *P = 0.0383). Example trace of grouped (black color) and isolated (blue color). Scale bar, 50 mV, 100 ms. (E) In female mice, DRNTH neurons exhibit no difference in excitability between group-housing and social isolation (Grouped, n = 24 from three mice, 3.250 ± 0.8281; Isolated, n = 18 from two mice, 1.833 ± 0.4591; P = 0.1798). Example trace of grouped (black color) and isolated (red color). Scale bar, 50 mV, 100 ms. (F) Experimental scheme for viral injection into the DRN of TH::cre mice and timeline of the behavioral task. (G) Chemogenetic inhibition of the DRNTH neurons during social isolation decreases the time spent with the social target following isolation (Saline, n = 6, 85.51 ± 2.237; CNO, n = 9, 74.35 ± 3.157; *P = 0.0224). All unpaired t test.
Fig. 2.
Fig. 2.. Isolation-activated DRNTH neurons are required for increased sociability after 24 hours of isolation.
(A) Experimental scheme for ex vivo patch-clamp recording. DOX, doxycycline. (B) Confocal images showing TH-positive neurons in the DRN expressing tdTomato (magenta color) and isolation-activated DRNTH neurons expressing mEmeraldNuc (cyan color). Scale bar, 100 μm. (C) Isolation-activated DRNTH (mEmerald+) neurons show a higher number of spikes (on delivery of a 200-pA current pulse) compared to isolation-nonactivated DRNTH (mEmerald) neurons in a male-specific manner (left; mEmerald, n = 15 from six mice, 4.067 ± 0.8134; mEmerald+, n = 12 from six mice, 7.167 ± 1.325; *P = 0.0480; right; mEmerald, n = 15 from five mice, 4.067 ± 1.419; mEmerald+, n = 15 from five mice, 4.600 ± 0.8772; unpaired t test, P = 0.7516). Example traces of mEmerald (black color) and mEmerald+ (green color). Scale bars, 50 mV, 100 ms. (D and F) Schematic of virus injection and behavior schemes for labeling isolation-activated (D) and group-house–activated DRNTH neurons (F). (E) Inhibition of isolation-activated DRNTH neurons abolishes social interaction (Saline, n = 4, 82.01 ± 2.515; CNO, n = 7, 71.13 ± 3.071; *P = 0.0400). (G) Inhibiting the group-house–activated DRNTH neurons does not affect social interaction (Saline, n = 5, 75.48 ± 2.473; CNO, n = 5, 79.23 ± 4.934; P = 0.5160). (H) Schematic of the virus injection and behavioral paradigm for reactivation ratio. (I) Representative images of DRN in Iso-Iso mice. Activated DRNTH neurons through the first isolation experience are labeled with mCherry. The second isolation-activated neurons are immunostained with c-fos in Alexa Fluor 488+. Scale bar, 100 μm. (J) Reactivation ratio is significantly higher in Iso-Iso compared to Gro-Iso (Gro-Iso, n = 7, 5.969 ± 1.457; Iso-Iso, n = 5, 17.07 ± 2.814; **P = 0.0034). All unpaired t test.
Fig. 3.
Fig. 3.. Optical inhibition of the DRNTH-NAcsh circuit suppresses social interaction following 24-hour isolation.
(A) Visualization of the axonal projections of DRNTH neurons using SeeDB2 method (scale bar, 1000 μm). (B) Illustration of virus injection site in Ai14 mouse. Representative image of DRN showing the monosynaptically connected tdTomato neurons (magenta) and immunostained TH-positive neurons (cyan). Scale bar, 100 μm. Among tdTomato-labeled cells, approximately 42% were TH positive. (C) Illustration of virus-injected regions and implanted optic fibers. Changes in GRABDA fluorescence in response to DRNTH axon terminal activation. (D) Experimental scheme for the photoinhibition of DRNTH terminals in NAcsh with group-housed and socially isolated mice. Representative image of bilateral placement of optic fiber on the eYFP-labeled axons from DRNTH. Scale bar, 1000 μm. (E and F) In socially isolated male mice, inhibiting DRNTH to NAcsh circuit significantly suppresses social interaction time in the three-chamber test (E) (eYFP, n = 8, P = 0.3424; eNpHR, n = 10, *P = 0.0410) and in juvenile interaction test (F) (eYFP, n = 6, P = 0.6937; eNpHR, n = 7, *P = 0.0265). (G) In group-housed male mice, inhibition of DRNTH-NAcsh do not attenuate sociability (eYFP, n = 5, P = 0.0803; eNpHR, n = 6, P = 0.9370). (H and I) In socially isolated female mice, DRNTH-NAcsh circuit inhibition does not suppress the social interaction time both in the three-chamber test (H) (eYFP, n = 10, P = 0.7231; eNpHR, n = 9, P = 0.9905) and in the juvenile interaction test (I) (eYFP, n = 10, P = 0.9685; eNpHR, n = 7, P = 0.7661). (J) In group-housed female mice, inhibiting DRNTH to NAc terminals does not change the sociability level (eYFP, n = 3, P = 0.9740; eNpHR, n = 5, P = 0.4471). All paired t test.
Fig. 4.
Fig. 4.. Male-specific increase of in vivo dopamine transmission in NAcsh following 24-hour isolation.
(A) Experimental schematic for in vivo fiber photometry with dopamine sensors and the expression image of GRABDA. Scale bar, 1000 μm. DAQ, Data acquisition; LED, Light emitting diode. (B) Representative trace of group-housed and socially isolated male mouse interacting with juvenile stranger mouse. Interaction bouts are indicated by shaded green areas. Scale bar, 10 dF/F0%, 10 s. Socially isolated mice show higher GRABDA fluorescence compared to group-housed mice. The moment before testing when the interaction ensued was denoted as 0 s. (C) Significantly larger area under curve (AUC) in isolated mice (n = 13; paired t test; *P = 0.0435). (D) Representative trace of group-housed and socially isolated female mice interacting with sex-matched juvenile mouse. Interaction bouts are shown in green. Scale bars, 10 dF/F0%, 10 s. (E) Comparable AUC in group-housed and socially isolated females (n = 6; paired t test; P = 0.3688).
Fig. 5.
Fig. 5.. Isolated male mice show increased spine density between isolation-activated DRNTH-NAcsh neuronal ensembles.
(A) Schematics of dual-eGRASP that distinguishes the synapses depending on their inputs from DRNTH on a single NAcsh dendrite. (B) Illustration of AAV constructs and the combinations used in DRN and NAc. (C) Illustration of virus injection sites and timeline of the experimental protocol to label the synapses with dual-eGRASP. (D) Representative image of post-GRASP expressed in NAcsh. Scale bar, 1000 μm. Illustration of the four types of synapses between DRNTH and NAcsh neurons. The isolation-nonactivated NAc neurons are shown in gray, and the isolation-activated NAc neurons are shown in red. The cyan-eGRASP signals (in cyan circles) are the synapses that come from isolation-nonactivated DRNTH neurons. The yellow-eGRASP signals (in yellow circles) are the synapses that come from isolation-activated DRNTH neurons. (E) Representative images of dual-eGRASP in isolation-activated and isolation-nonactivated NAcsh dendrite with cyan-eGRASP and yellow-eGRASP puncta in both sexes. Scale bars, 5 μm. (F) In male mice, isolation-activated DRNTH neurons have higher synaptic density with isolation-activated NAcsh neurons compared to isolation-nonactivated NAcsh neurons. Each data point represents a dendrite (n = 37 for NAc nonactivated dendrites, n = 40 for NAc-activated dendrites, from six mice; Mann-Whitney two-tailed test; ***P < 0.0001). (G) In female mice, isolation did not change spine density between the activated populations (n = 35 for NAc nonactivated dendrites, n = 33 for NAc-activated dendrites, from six mice; Mann-Whitney two-tailed test; P = 0.0949). (H) Representative image of dual-eGRASP signals on dendritic shaft (white arrow) and spine head/neck (blue arrow) in isolation-activated NAcsh dendrites. The percentage of cyan-eGRASP and yellow-eGRASP on dendritic shaft and spine head/neck, in isolated males and female. Scale bar, 2 μm.
Fig. 6.
Fig. 6.. D1R-expressing neurons of NAcsh are required for sociability following isolation.
(A) Labeling of isolation-activated NAcsh neurons. Scale bar, 100 μm. (B) In isolated male mice, the neuronal excitability (delivery of a 50-pA current pulse) is significantly higher in the mEmeraldNuc+ neurons (mEmeraldNuc, n = 17; 1.000 ± 0.4287; mEmeraldNuc+, n = 17; 5.412 ± 1.018; unpaired t test; ***P = 0.0004). In isolated female mice, mEmeraldNuc+ and mEmeraldNuc neurons show comparable excitability (mEmeraldNuc, n = 18; 1.000 ± 0.4918; mEmeraldNuc+, n = 16; 1.813 ± 0.7595; unpaired t test; P = 0.3656). Each group from three mice. Scale bar, 50 mV, 100 ms. (C) Experimental scheme with D1R-eGFP and D2R-eGFP mice. (D) Labeling of isolation-activated NAcsh neurons. Scale bars, 50 μm. D1R-expressing neurons show higher activation ratio (mCherryNuc+ eGFP+/mCherryNuc+) than D2R-expressing neurons (D1, n = 36 from four mice; 13.03 ± 1.449; D2, n = 17 from two mice; 7.543 ± 2.126; unpaired t test; *P = 0.0373). (E and G) Experimental scheme of chemogenetically inhibiting D1R-expressing neurons (E) and D2R-expressing neurons (G) during three-chamber test. (F) Inhibition of D1R-expressing neurons abolish isolation-induced social interaction (n = 6; paired t test; **P = 0.0054). (H) Isolation-induced sociability remains intact, although D2R-expressing neurons are inhibited during the three-chamber test (n = 7; paired t test; P = 0.6365). (I and K) Experimental scheme of bilateral intracranial infusion of D1R antagonist (I) and D2R antagonist (K) into the NAcsh of isolated male mice. (J) Isolation-induced sociability is significantly attenuated after infusing D1R antagonist (Saline, n = 8; 86.03 ± 3.214; antagonist, n = 9; 73.79 ± 4.218; unpaired t test; *P = 0.0389). (L) Isolation-induced sociability is not affected by D2R antagonist infusion (Saline, n = 7; 83.52 ± 3.849; antagonist, n = 12; 80.33 ± 2.794; unpaired t test; P = 0.5055).

Similar articles

Cited by

References

    1. Baumeister R. F., Leary M. R., The need to belong: Desire for interpersonal attachments as a fundamental human motivation. Psychol. Bull. 117, 497–529 (1995). - PubMed
    1. Van Loo P. L. P., de Groot A. C., Van Zutphen B. F. M., Baumans V., Do male mice prefer or avoid each other’s company? influence of hierarchy, kinship, and familiarity. J. Appl. Anim. Welf. Sci. 4, 91–103 (2001).
    1. Thoenig R. H., Solitary confinement-punishment within the letter of the law, or psychological torture. Wisconsin Law Rev. , 223–311 (1972).
    1. Cacioppo J. T., Hughes M. E., Waite L. J., Hawkley L. C., Thisted R. A., Loneliness as a specific risk factor for depressive symptoms: Cross-sectional and longitudinal analyses. Psychol. Aging 21, 140–151 (2006). - PubMed
    1. Fone K. C. F., Porkess M. V., Behavioural and neurochemical effects of post-weaning social isolation in rodents—Relevance to developmental neuropsychiatric disorders. Neurosci. Biobehav. Rev. 32, 1087–1102 (2008). - PubMed