Metabolic labeling unveils alterations in the turnover of HDL-associated proteins during diabetes progression in mice
- PMID: 36223521
- PMCID: PMC9722254
- DOI: 10.1152/ajpendo.00158.2022
Metabolic labeling unveils alterations in the turnover of HDL-associated proteins during diabetes progression in mice
Abstract
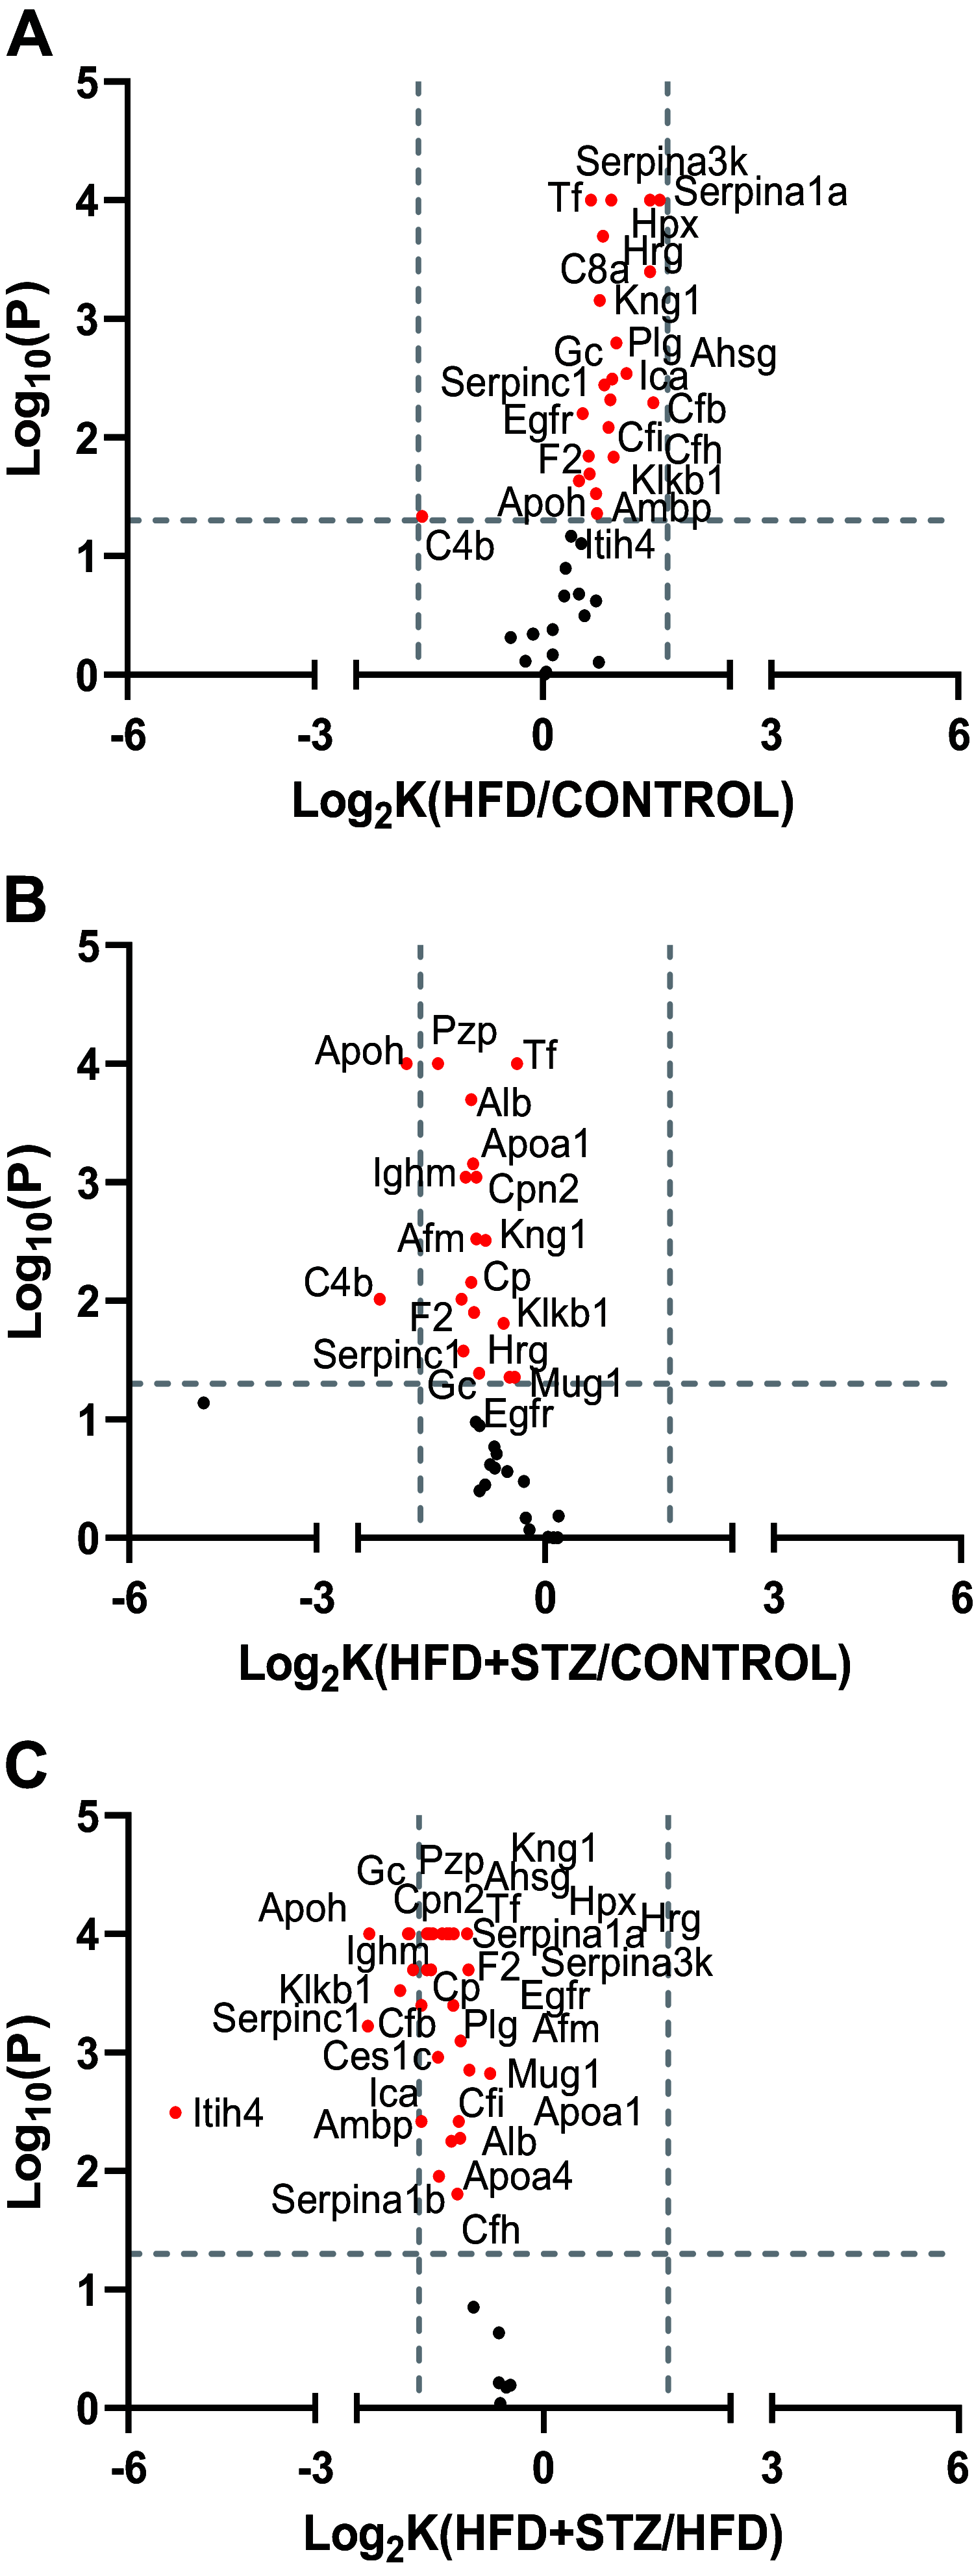
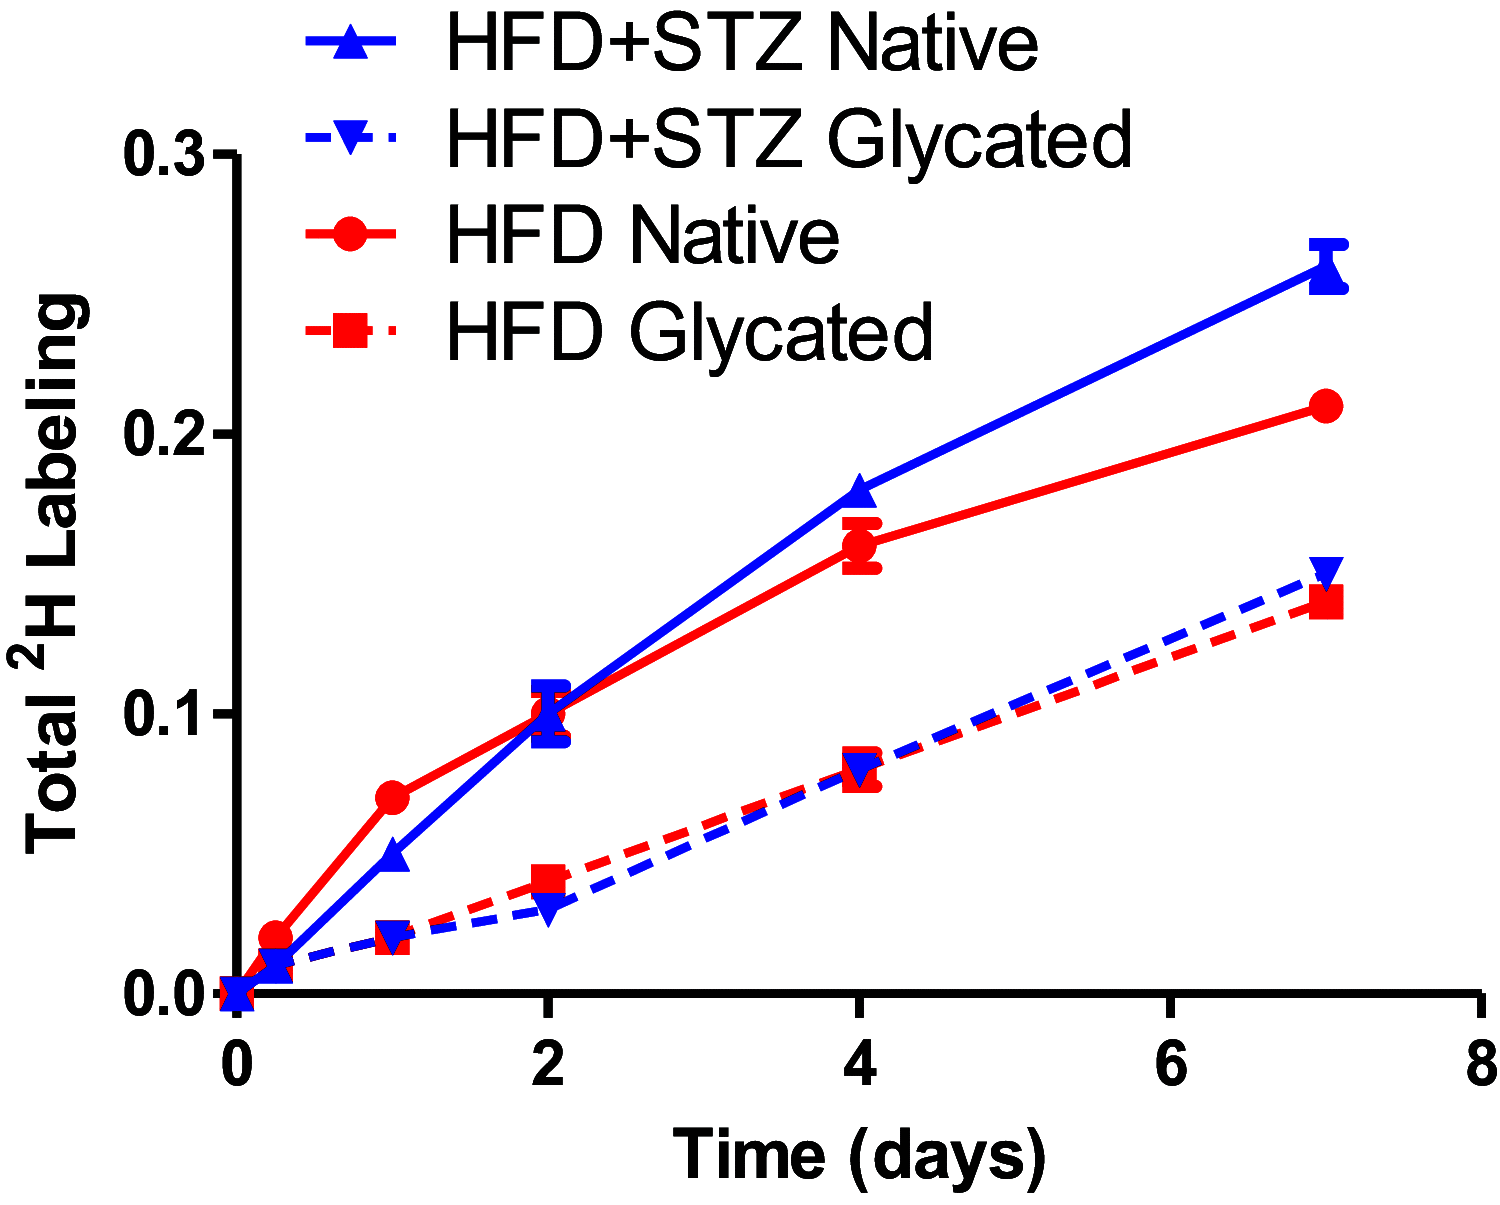
Several aspects of diabetes pathophysiology and complications result from hyperglycemia-induced alterations in the structure and function of plasma proteins. Furthermore, insulin has a significant influence on protein metabolism by affecting both the synthesis and degradation of proteins in various tissues. To understand the role of progressive hyperglycemia on plasma proteins, in this study, we measured the turnover rates of high-density lipoprotein (HDL)-associated proteins in control (chow diet), prediabetic [a high-fat diet (HFD) for 8 wk] or diabetic [HFD for 8 wk with low-dose streptozotocin (HFD + STZ) in weeks 5-8 of HFD] C57BL/6J mice using heavy water (2H2O)-based metabolic labeling approach. Compared with control mice, HFD and HFD + STZ mice showed elevations of fasting plasma glucose levels in the prediabetic and diabetic range, respectively. Furthermore, the HFD and HFD + STZ mice showed increased hepatic triglyceride (TG) levels, total plasma cholesterol, and plasma TGs. The kinetics of 40 proteins were quantified using the proteome dynamics method, which revealed an increase in the fractional synthesis rate (FSR) of HDL-associated proteins in the prediabetic mice compared with control mice, and a decrease in FSR in the diabetic mice. The pathway analysis revealed that proteins with altered turnover rates were involved in acute-phase response, lipid metabolism, and coagulation. In conclusion, prediabetes and diabetes have distinct effects on the turnover rates of HDL proteins. These findings suggest that an early dysregulation of the HDL proteome dynamics can provide mechanistic insights into the changes in protein levels in these conditions.NEW & NOTEWORTHY This study is the first to examine the role of gradual hyperglycemia during diabetes disease progression on HDL-associated protein dynamics in the prediabetes and diabetic mice. Our results show that the fractional synthesis rate of HDL-associated proteins increased in the prediabetic mice whereas it decreased in the diabetic mice compared with control mice. These kinetic changes can help to elucidate the mechanism of altered protein levels and HDL dysfunction during diabetes disease progression.
Keywords: HDL; heavy water; mass spectrometry; proteomics; type 2 diabetes.
Conflict of interest statement
No conflicts of interest, financial or otherwise, are declared by the authors.
Figures


Similar articles
-
Early Pro-Inflammatory Remodeling of HDL Proteome in a Model of Diet-Induced Obesity: 2H2O-Metabolic Labeling-Based Kinetic Approach.Int J Mol Sci. 2020 Oct 10;21(20):7472. doi: 10.3390/ijms21207472. Int J Mol Sci. 2020. PMID: 33050482 Free PMC article.
-
Myricitrin Ameliorates Hyperglycemia, Glucose Intolerance, Hepatic Steatosis, and Inflammation in High-Fat Diet/Streptozotocin-Induced Diabetic Mice.Int J Mol Sci. 2020 Mar 9;21(5):1870. doi: 10.3390/ijms21051870. Int J Mol Sci. 2020. PMID: 32182914 Free PMC article.
-
High fat diet attenuates hyperglycemia, body composition changes, and bone loss in male streptozotocin-induced type 1 diabetic mice.J Cell Physiol. 2018 Feb;233(2):1585-1600. doi: 10.1002/jcp.26062. Epub 2017 Aug 4. J Cell Physiol. 2018. PMID: 28631813 Free PMC article.
-
Alleviative effects of 20(R)-Rg3 on HFD/STZ-induced diabetic nephropathy via MAPK/NF-κB signaling pathways in C57BL/6 mice.J Ethnopharmacol. 2021 Mar 1;267:113500. doi: 10.1016/j.jep.2020.113500. Epub 2020 Oct 19. J Ethnopharmacol. 2021. PMID: 33091499
-
Establishment of type 2 diabetes mellitus models using streptozotocin after 3 months high-fat diet in Bama minipigs.Anim Biotechnol. 2023 Dec;34(7):2295-2312. doi: 10.1080/10495398.2022.2088548. Epub 2022 Jun 24. Anim Biotechnol. 2023. PMID: 35749713
Cited by
-
Dynamic evolution of left ventricular strain and microvascular perfusion assessed by speckle tracking echocardiography and myocardial contrast echocardiography in diabetic rats: Effect of dapagliflozin.Front Cardiovasc Med. 2023 Feb 23;10:1109946. doi: 10.3389/fcvm.2023.1109946. eCollection 2023. Front Cardiovasc Med. 2023. PMID: 36910521 Free PMC article.
References
-
- Saeedi P, Petersohn I, Salpea P, Malanda B, Karuranga S, Unwin N, Colagiuri S, Guariguata L, Motala AA, Ogurtsova K, Shaw JE, Bright D, Williams R; IDF Diabetes Atlas Committee. Global and regional diabetes prevalence estimates for 2019 and projections for 2030 and 2045: Results from the International Diabetes Federation Diabetes Atlas, 9th edition. Diabetes Res Clin Pract 157: 107843, 2019. doi:10.1016/j.diabres.2019.107843. - DOI - PubMed
Publication types
MeSH terms
Substances
Grants and funding
LinkOut - more resources
Full Text Sources
Medical
Miscellaneous

