. 2023 Feb 9;141(6):620-633.
doi: 10.1182/blood.2022017010.

Whole-genome analysis identifies novel drivers and high-risk double-hit events in relapsed/refractory myeloma

Affiliations

Whole-genome analysis identifies novel drivers and high-risk double-hit events in relapsed/refractory myeloma

Naser Ansari-Pour et al. Blood. .

Abstract

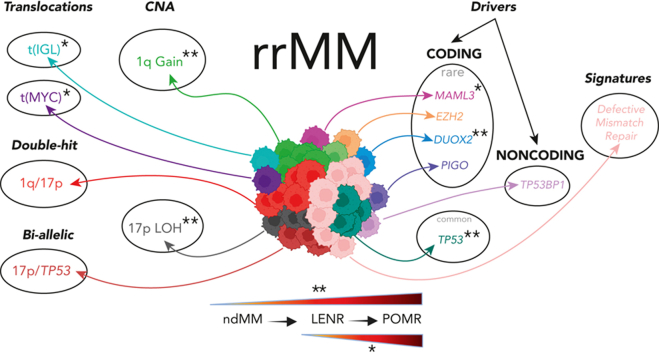
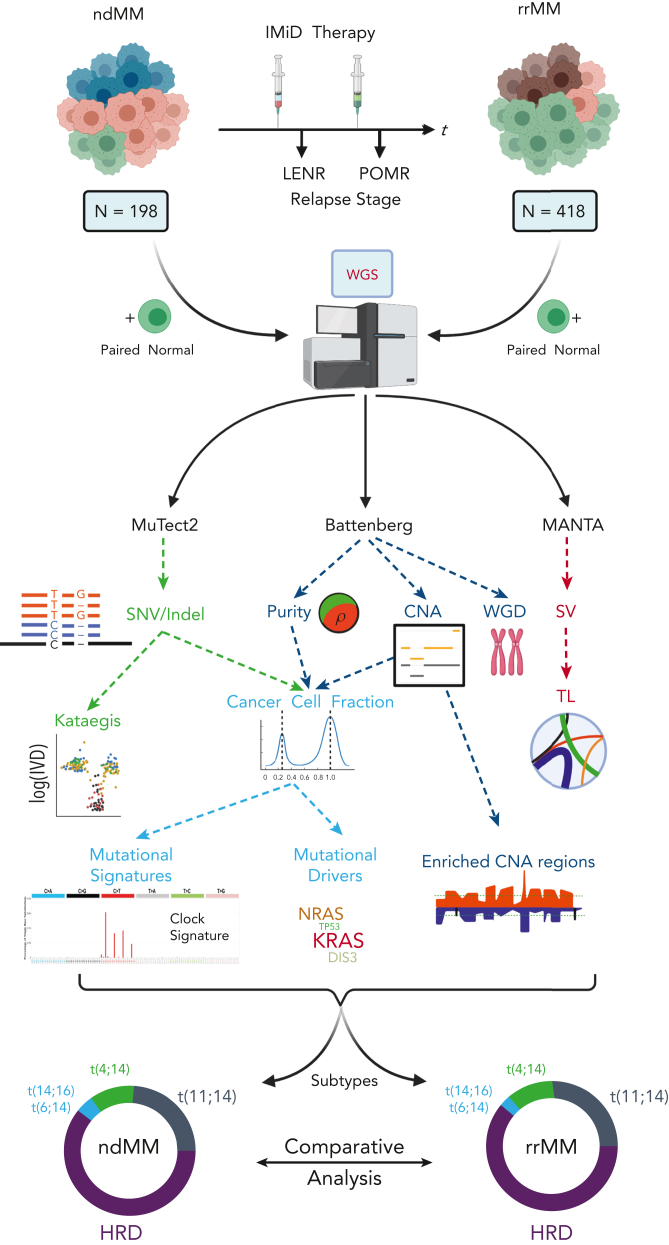
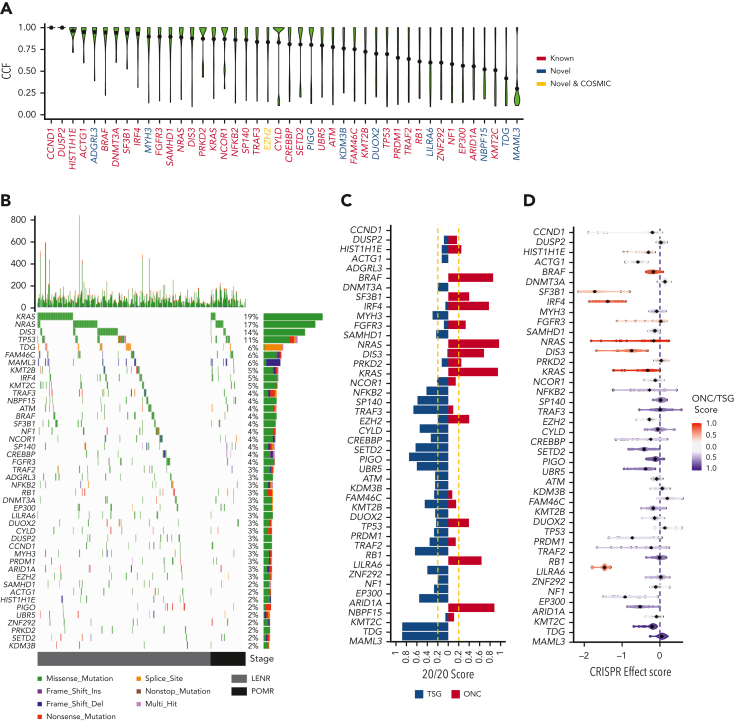
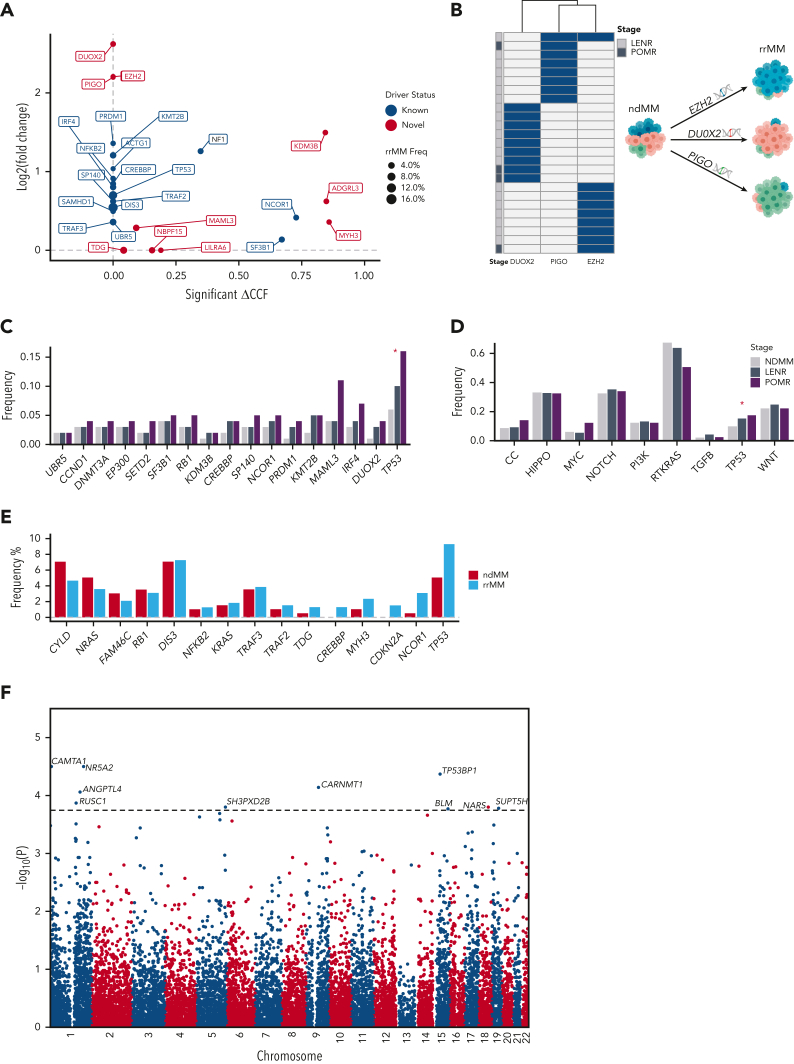
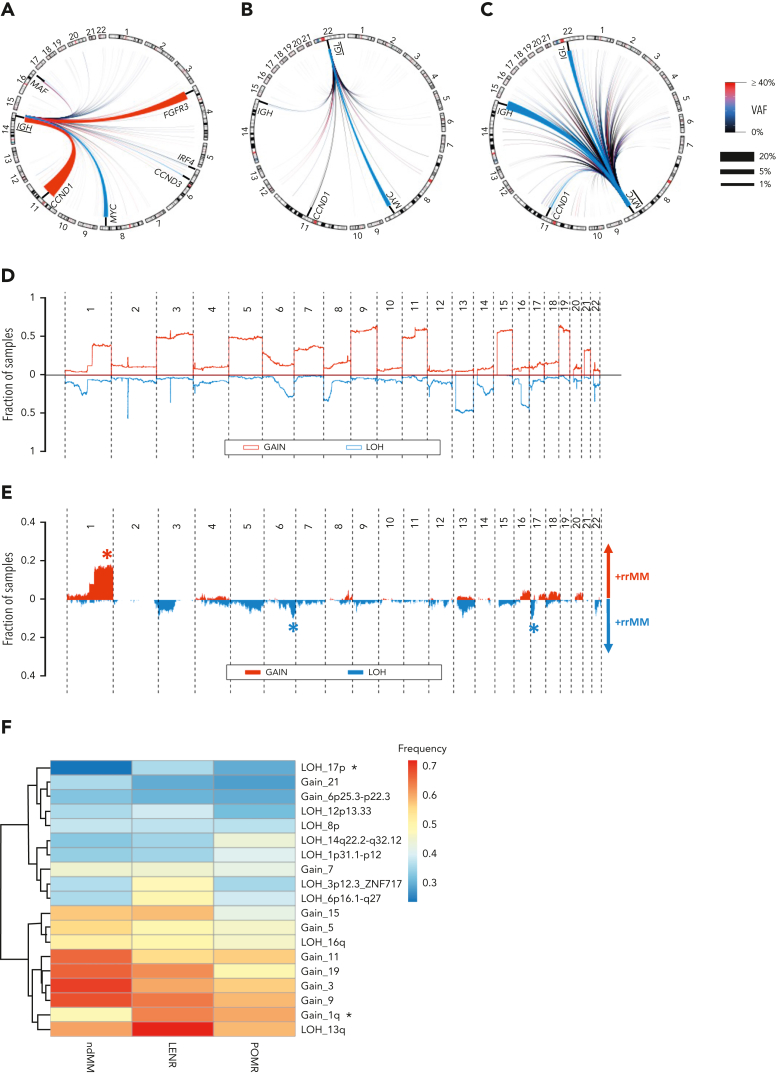
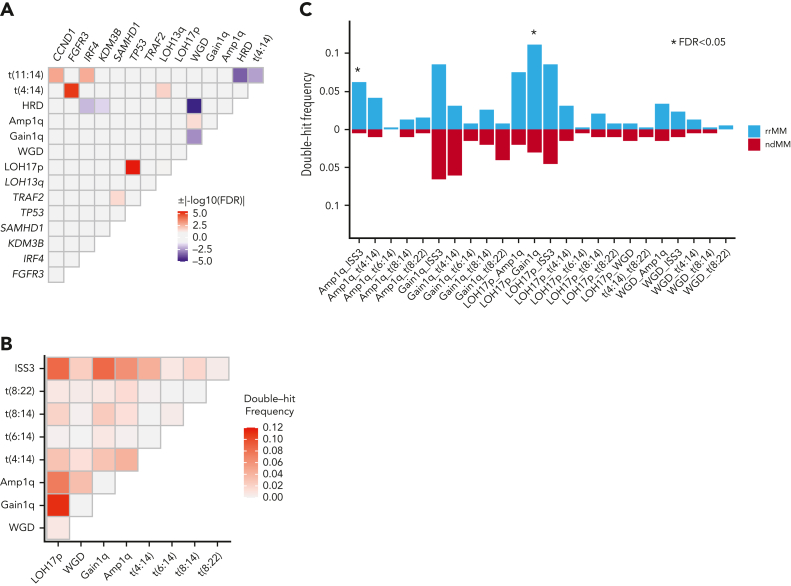
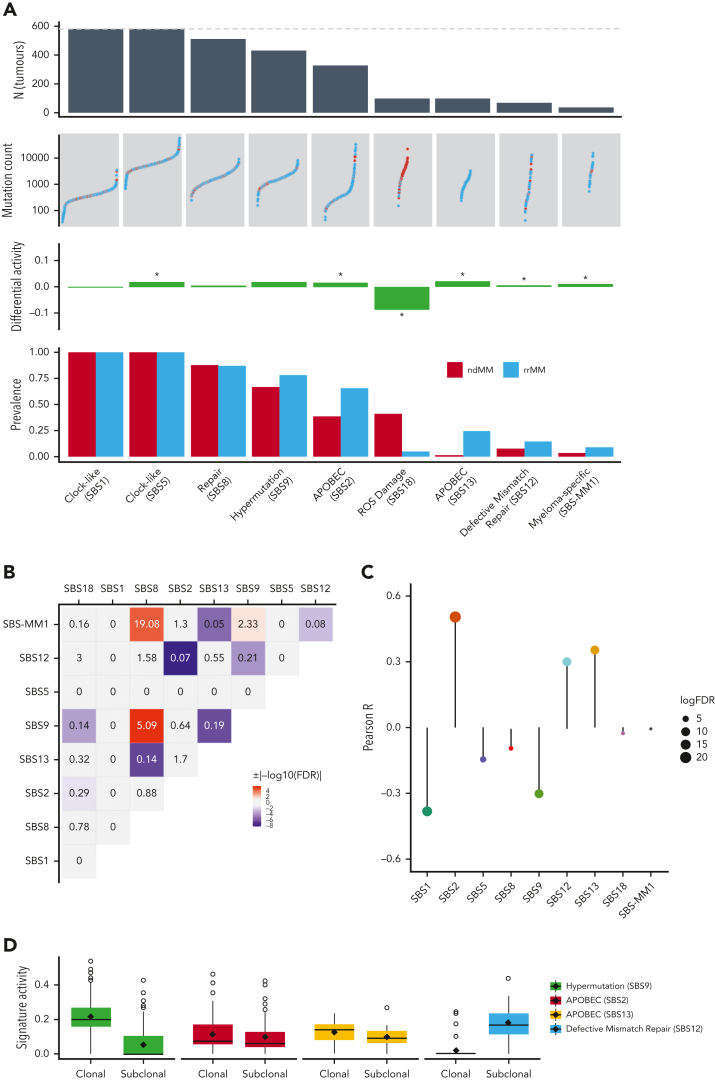
Large-scale analyses of genomic data from patients with newly diagnosed multiple myeloma (ndMM) have been undertaken, however, large-scale analysis of relapsed/refractory MM (rrMM) has not been performed. We hypothesize that somatic variants chronicle the therapeutic exposures and clonal structure of myeloma from ndMM to rrMM stages. We generated whole-genome sequencing (WGS) data from 418 tumors (386 patients) derived from 6 rrMM clinical trials and compared them with WGS from 198 unrelated patients with ndMM in a population-based case-control fashion. We identified significantly enriched events at the rrMM stage, including drivers (DUOX2, EZH2, TP53), biallelic inactivation (TP53), noncoding mutations in bona fide drivers (TP53BP1, BLM), copy number aberrations (CNAs; 1qGain, 17pLOH), and double-hit events (Amp1q-ISS3, 1qGain-17p loss-of-heterozygosity). Mutational signature analysis identified a subclonal defective mismatch repair signature enriched in rrMM and highly active in high mutation burden tumors, a likely feature of therapy-associated expanding subclones. Further analysis focused on the association of genomic aberrations enriched at different stages of resistance to immunomodulatory agent (IMiD)-based therapy. This analysis revealed that TP53, DUOX2, 1qGain, and 17p loss-of-heterozygosity increased in prevalence from ndMM to lenalidomide resistant (LENR) to pomalidomide resistant (POMR) stages, whereas enrichment of MAML3 along with immunoglobulin lambda (IGL) and MYC translocations distinguished POM from the LEN subgroup. Genomic drivers associated with rrMM are those that confer clonal selective advantage under therapeutic pressure. Their role in therapy evasion should be further evaluated in longitudinal patient samples, to confirm these associations with the evolution of clinical resistance and to identify molecular subsets of rrMM for the development of targeted therapies.


Conflict of interest statement

Conflicts-of-interest disclosure: Bristol Myers Squibb (BMS) Corporation has employment and equity ownership; funding for data generation, processing, and storage was provided by BMS Corporation; F.T. and A.T. were BMS employees at the time this analysis was conducted; B.W. receives research funding from BMS; and N.A.-P. is a BMS consultant. The remaining authors declare no competing financial interests.

Figures

None
Graphical abstract
Figure 1.
Figure 1.
Overview of collection, processing, and analysis of the WGS data along with the comparative analysis strategy in detecting genomic events associated with the relapse/refractory stage of MM. Myeloma tumors not belonging to HRD and IGH translocation subtypes are not represented in the circular proportion plots. HRD, hyperdiploid; TL, translocation; WGD, whole-genome duplication.
Figure 2.
Figure 2.
The mutational driver landscape of rrMM. (A) CCF distribution of driver genes identified in this cohort ordered by mean CCF (black dot). Gene labels are colored according to their status: known, previously reported in ndMM; novel COSMIC, newly identified but present in the COSMIC cancer gene set; and novel, not previously reported in either ndMM or COSMIC. (B) Mutational landscape of drivers identified in the rrMM cohort. The top panel represents the frequency of nonsilent mutations in each tumor across the genome. The main panel is a waterfall plot of mutations identified in each driver gene across all tumors. The right panel shows the frequency of each driver in the rrMM cohort in percentages and the type of mutations that constitute the mutation burden of each driver gene (length of the bar reflecting the frequency). All 3 panels are colored according to the functional consequence of mutations as predicted by ANNOVAR. Multi-hit: tumors with more than one mutation with different functional consequence. Tumors are ordered by their relapse stage. LENR, lenalidomide resistant; POMR, pomalidomide resistant. (C) Categorization of identified driver genes into ONC or TSG based on the 20/20 rule. The ONC and TSG scores are shown with red and blue color, respectively, and the vertical yellow dashed lines represent the cut-off thresholds for the 20/20 rule. Genes are ordered by mean CCF as in panel A. (D) Gene essentiality of driver genes based on the CRISPR effect score in MM cell lines where more negative values represent essential genes. Each dot represents a cell line, and the diamond represents the median value per gene. Each gene is colored based on their mean ONC/TSG score. Scores between −0.2 and 0.2 are considered inconclusive (gray). Genes are ordered by mean CCF as in panel A.
Figure 3.
Figure 3.
Differential enrichment of mutational drivers in rrMM and its IMiD therapy–defined subgroups. (A) Enrichment analysis of all mutational drivers based on coding mutations. Each driver was compared between rrMM and ndMM cohorts for a significant enrichment in CCF (x-axis) and increase in the prevalence quantified by log2 value of the fold-change (y-axis) in rrMM. Drivers with no statistically significant increase in CCF were assigned a ΔCCF value of 0 (situated on the y-axis). Drivers with no enrichment for either CCF or prevalence are not shown. Genes previously detected in ndMM as drivers are shown in blue and genes detected only in the rrMM cohort are shown in red. The size of each point reflects the prevalence of each driver in the rrMM cohort. (B) Mutual exclusivity of the 3 novel drivers, which are virtually unique to patients with rrMM (with no difference in prevalence between LENR and POMR), suggesting alternative evolutionary trajectories to therapeutic resistance. (C) Therapy stage subgroup analysis showed significant enrichment of TP53 from newly diagnosed to lenalidomide resistant to pomalidomide resistant stages based on the proportion trend test (P < .05; red asterisk). Driver genes are ordered based on significance of the proportion trend test with most significant trends on the right-hand side. (D) Per-pathway analysis shows depletion and enrichment of mutations in canonical cancer pathways from newly diagnosed to lenalidomide resistant to pomalidomide resistant stages. The RTKRAS and TP53 pathway showed significant negative and positive cline based on the proportion trend test. (D) Frequency barplot of biallelic drivers in rrMM and ndMM. Biallelic is defined as LOH (ie, copy loss) along with a nonsilent mutation or homozygous deletion. Driver genes are ordered left to right based on the frequency difference between rrMM and ndMM in ascending order. (E) Manhattan plot for a genome-wide scan of mutational drivers based on noncoding somatic variant clustering. The genome was divided into nonoverlapping bins of 100 kb and the rate of somatic mutation in each was compared between the rrMM and ndMM cohorts based on a Fisher exact test, and the –log10 of the corresponding P value was plotted. The dotted horizontal line represents the genome-wide significance threshold (FDR < 0.05). Ten bins showed significant enrichment of noncoding somatic variants in rrMM. Each significant signal is annotated with the name of the most likely gene targeted in each bin. Asterisk denotes statistically significant enrichment (P < .05). LOH, loss of heterozygosity.
Figure 4.
Figure 4.
The translocation (TL) and CNA landscape of rrMM. (A) Circos plot of all IGH-translocated events. Common canonical pairs are annotated. Chromosomes involved in canonical translocations (Chr 4,6,8,11,14,16) are zoomed-in proportionally for better visualization of such events. (B) Circos plot of all IGL-translocated events. Common canonical events are annotated. Chromosomes involved in canonical translocations (Chr 8,11,14, 22) are zoomed-in proportionally for better visualization of such events. (C) Circos plot of all MYC-translocated events. Common canonical events are annotated. Chromosomes involved in canonical translocations (Chr 8,11,14, 22) are zoomed-in proportionally for better visualization of such events. For panels A to C, the color and thickness of the lines connecting the 2 TL breakpoint pairs denote the mean VAF and the prevalence of the TL in this cohort, respectively. Accordingly, thick red lines represent early (ie, high VAF) and frequent TL events in rrMM. (D) Genome-wide landscape of CNA in the form of gain and LOH in the ndMM cohort. The y-axis represents the fraction of samples harboring a particular event at any given chromosomal location. LOH is shown in the opposite direction to the gain events for better visualization. (E) Genome-wide differential landscape of CNA in the form of gain and LOH in the rrMM compared with the ndMM. The y-axis represents the enriched fraction of samples in rrMM harboring a CNA. LOH is shown in the opposite direction to the gain events and depleted events in rrMM are not shown for better visualization. Asterisks denote statistically significant enrichment of common CNA events. (F) Heatmap and dendrogram of enriched CNA at ndMM, LENR, and POMR stages. The rows are the enriched CNA events and columns are the therapeutic stages. Asterisks denote significant positive cline from ndMM to LENR to POMR based on the proportion trend test (FDR < 0.05).
Figure 5.
Figure 5.
Somatic interactions of genomic aberrations in the rrMM data set. (A) Only genomic events with at least 1 significant pairwise association (FDR < 0.1) are shown. (B) Frequency of double-hit events of high-risk features observed in the rrMM data set. (C) Enrichment analysis of double-hit events in rrMM. Each event was compared between rrMM and ndMM cohorts using the Fisher exact test and those significant after multiple-testing correction (FDR < 0.05) are shown with an asterisk.
Figure 6.
Figure 6.
Differential analysis of genome-wide mutational signatures. (A) From top to bottom: number of tumors with SBS signatures across the entire data set (dotted line represents combined ndMM and rrMM sample size) with signatures sorted left to right by descending count, number of mutations per sample (color representing groups) in respective signatures, differential activity of signatures between rrMM and ndMM with values in the positive direction showing enrichment in the rrMM cohort and vice versa, proportion of tumors carrying each signature in each cohort. (B) Heatmap of pairwise associations among SBS signatures as assessed by Fisher exact test. ORs are given for each pair and shades of red and blue colors represents statistically significant cooccurrence (OR > 1) and mutual exclusivity (0 < OR < 1) patterns, respectively, after multiple-testing correction (FDR < 0.05). Gray color indicates nonsignificant association regardless of OR value. (C) Lollipop plot of correlation coefficient values between the activity of each SBS signature and mutation burden in rrMM tumors. The length of the bars represents the Pearson R value and the size of the circles represents the log10 of the FDR-adjusted P value of the correlation (larger circles indicate higher significance). Colors of the signatures match those in supplemental Figure 10. (D) Shift in mutational signature activity between clonal and subclonal mutations for signatures displaying strong positive correlation with mutation burden in the rrMM cohort and SBS9 (hypermutation signature) for comparison. SBS12 shows a strong signal of subclonal increase, whereas SBS9 shows decrease across most tumors.

Comment in

References

    1. Jafari M, Guan Y, Wedge DC, Ansari-Pour N. Re-evaluating experimental validation in the Big Data Era: a conceptual argument. Genome Biol. 2021;22(1) - PMC - PubMed
    1. Walker BA, Mavrommatis K, Wardell CP, et al. Identification of novel mutational drivers reveals oncogene dependencies in multiple myeloma. Blood. 2018;132(6):587–597. - PMC - PubMed
    1. Hoang PH, Cornish AJ, Sherborne AL, et al. An enhanced genetic model of relapsed IGH-translocated multiple myeloma evolutionary dynamics. Blood Cancer J. 2020;10(10):101. - PMC - PubMed
    1. Hoang PH, Dobbins SE, Cornish AJ, et al. Whole-genome sequencing of multiple myeloma reveals oncogenic pathways are targeted somatically through multiple mechanisms. Leukemia. 2018;32(11):2459–2470. - PMC - PubMed
    1. Maura F, Bolli N, Angelopoulos N, et al. Genomic landscape and chronological reconstruction of driver events in multiple myeloma. Nat Commun. 2019;10(1):3835. - PMC - PubMed

Publication types

MeSH terms