. 2022 Oct 11;55(10):1940-1952.e5.
doi: 10.1016/j.immuni.2022.09.002.

Spatial maps of T cell receptors and transcriptomes reveal distinct immune niches and interactions in the adaptive immune response

Affiliations

Spatial maps of T cell receptors and transcriptomes reveal distinct immune niches and interactions in the adaptive immune response

Sophia Liu et al. Immunity. .

Abstract

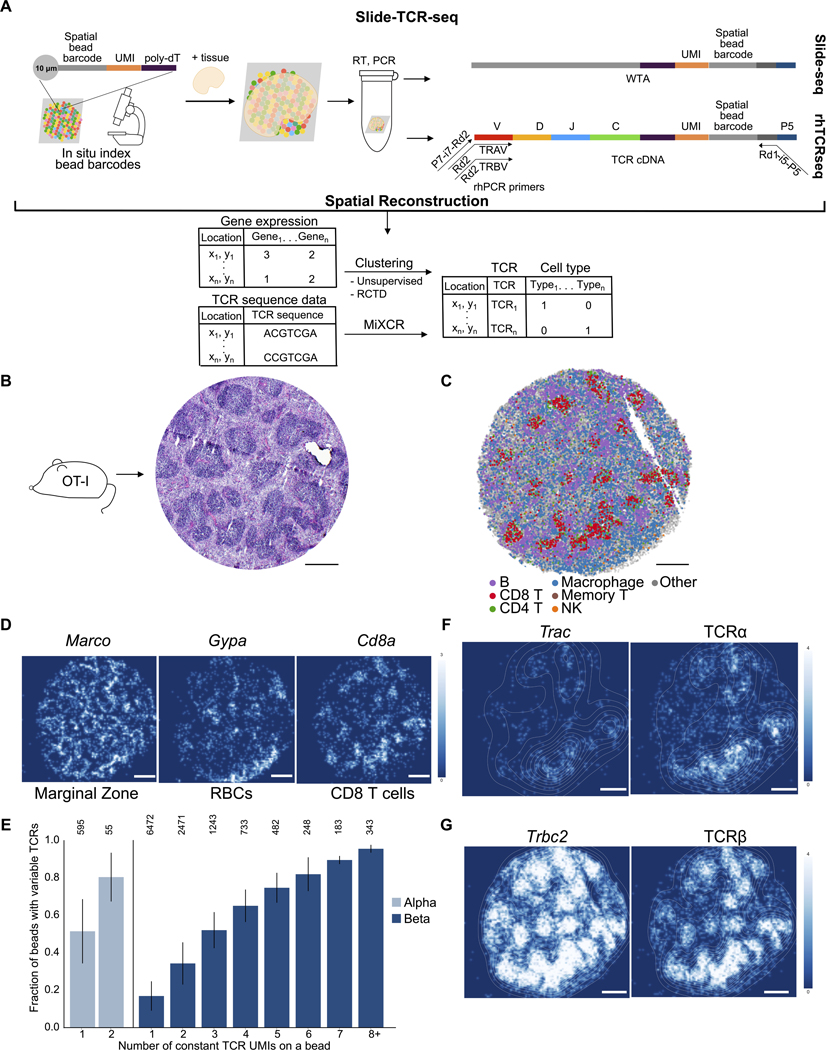
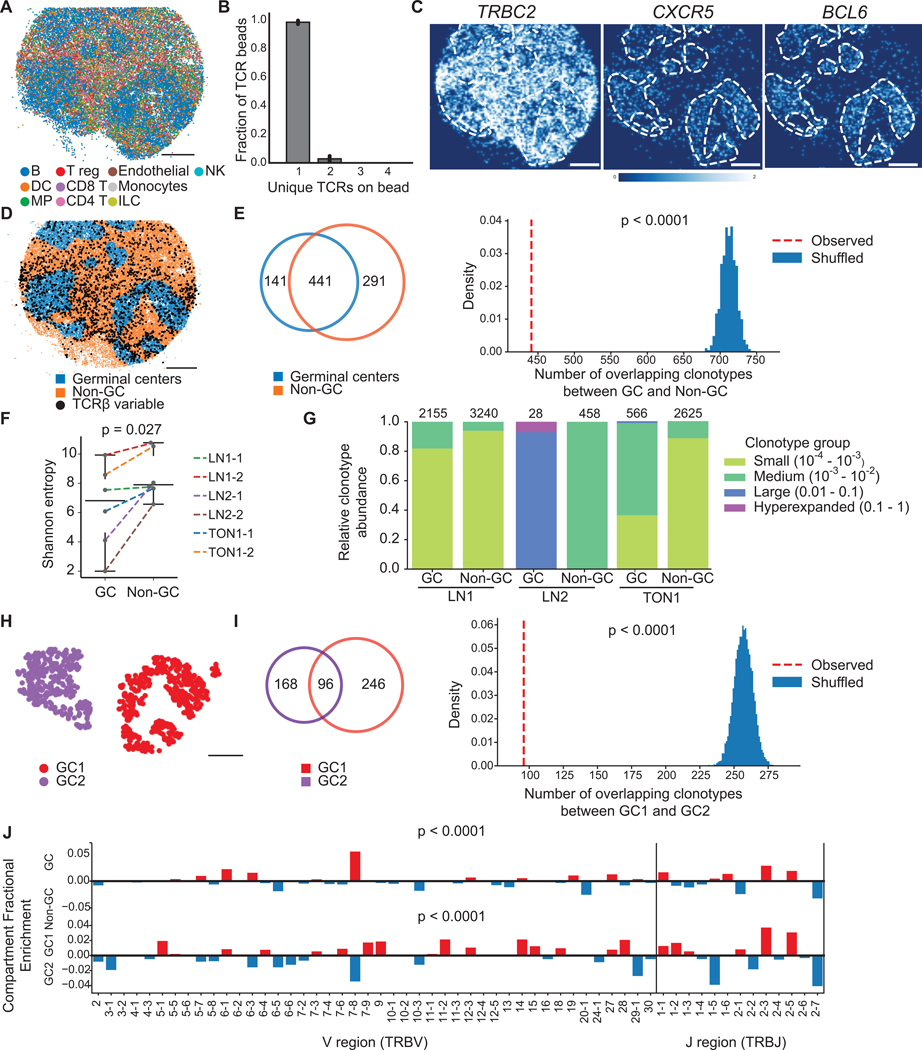
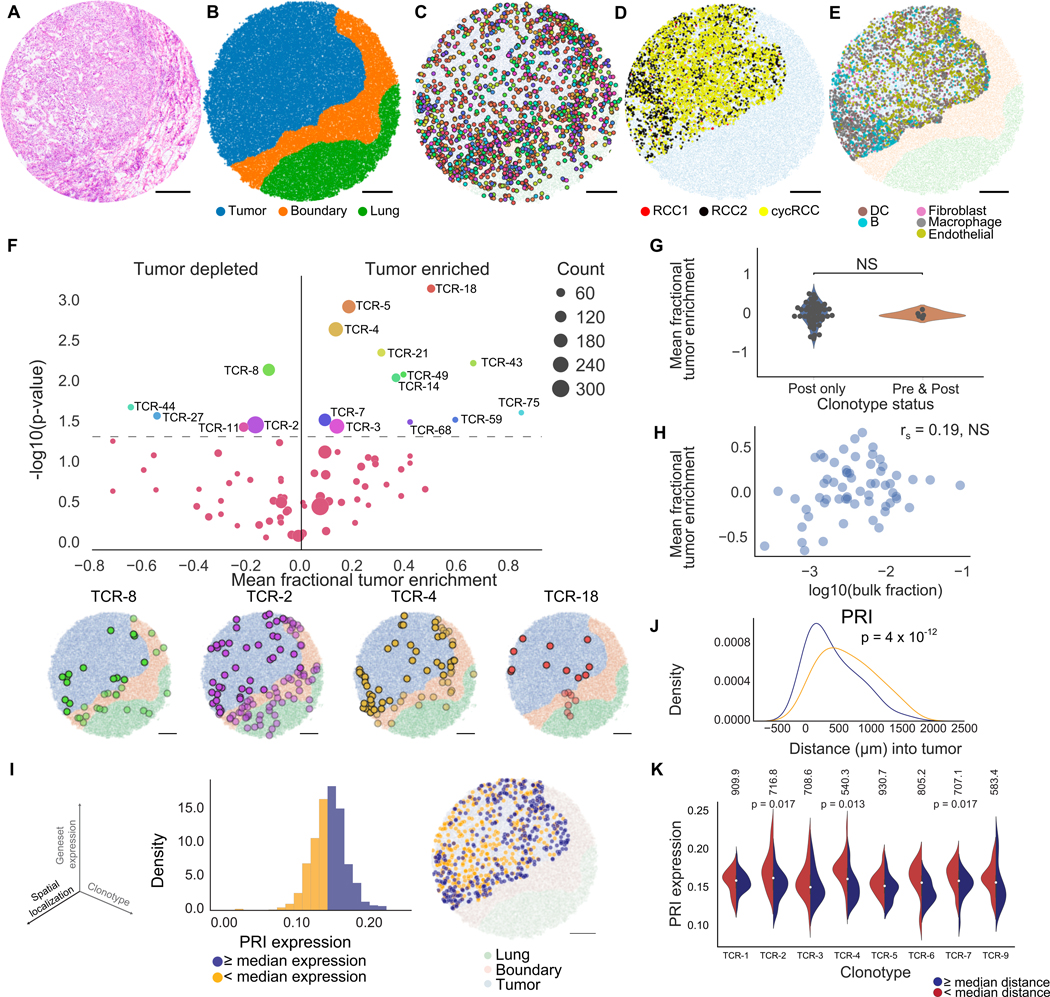
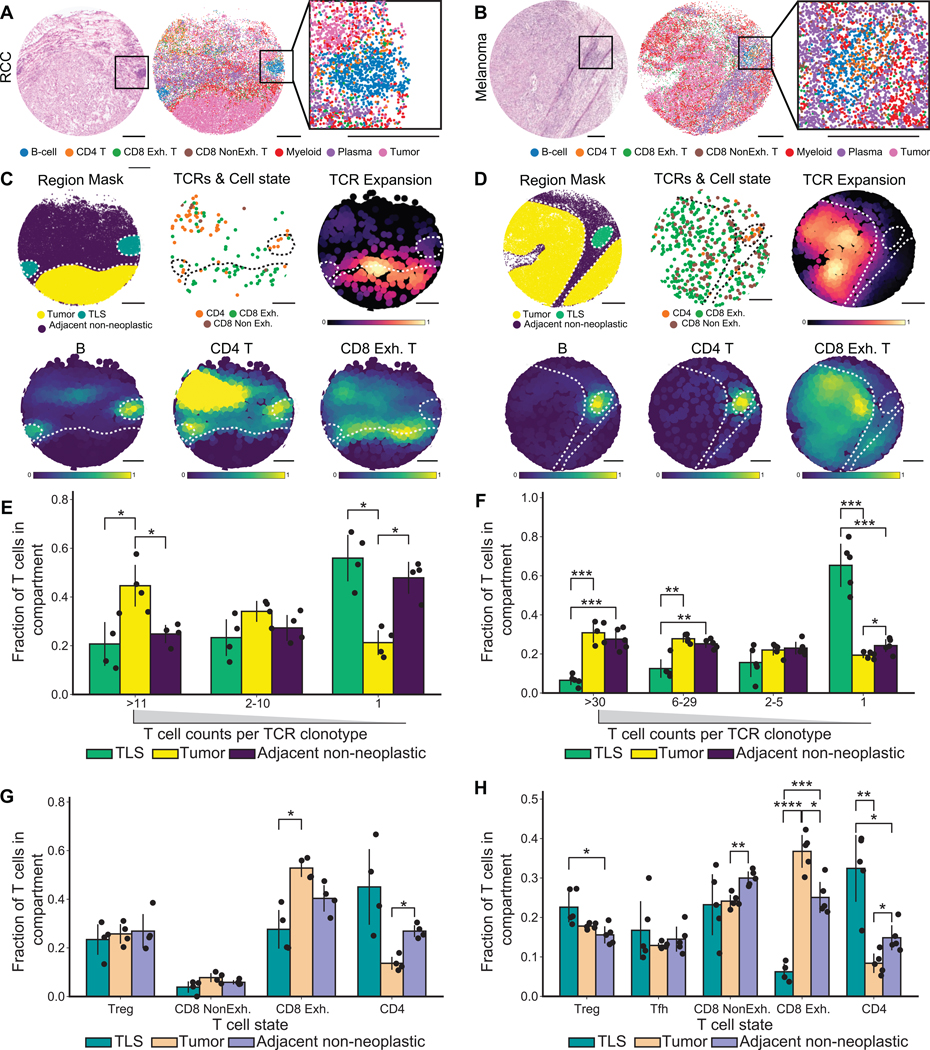
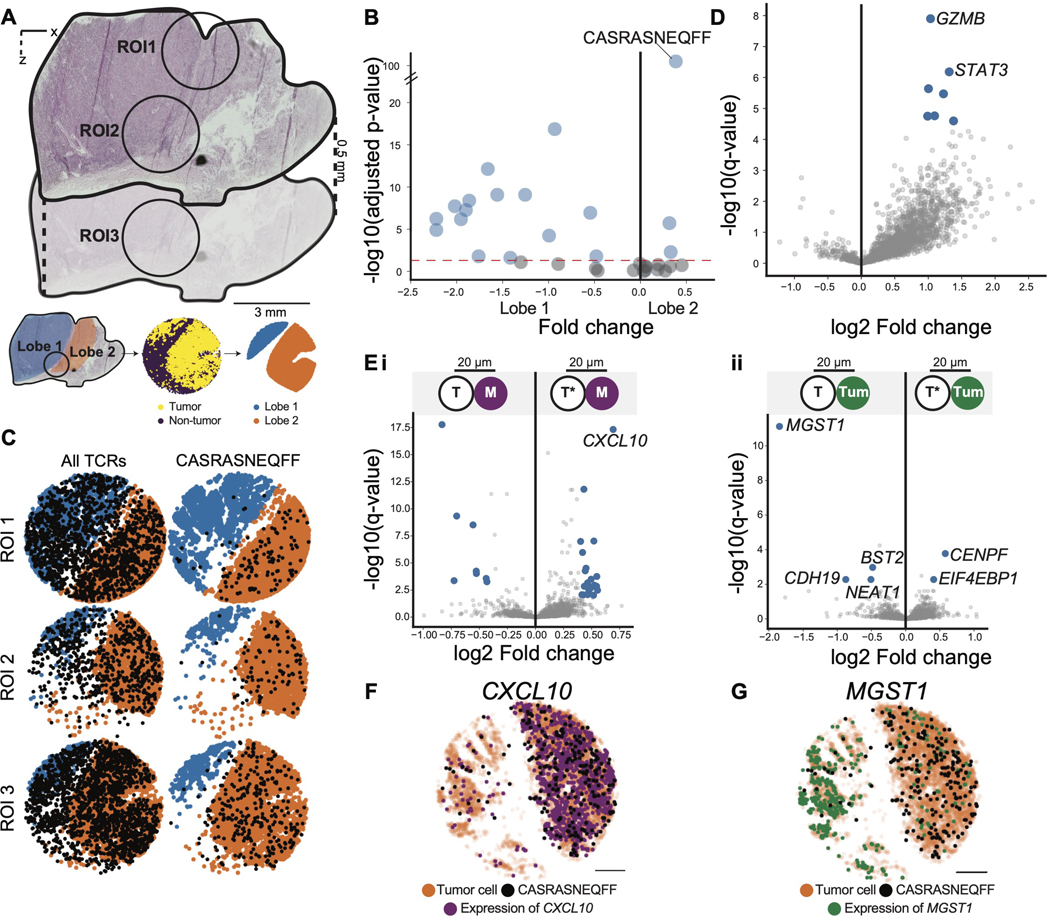
T cells mediate antigen-specific immune responses to disease through the specificity and diversity of their clonotypic T cell receptors (TCRs). Determining the spatial distributions of T cell clonotypes in tissues is essential to understanding T cell behavior, but spatial sequencing methods remain unable to profile the TCR repertoire. Here, we developed Slide-TCR-seq, a 10-μm-resolution method, to sequence whole transcriptomes and TCRs within intact tissues. We confirmed the ability of Slide-TCR-seq to map the characteristic locations of T cells and their receptors in mouse spleen. In human lymphoid germinal centers, we identified spatially distinct TCR repertoires. Profiling T cells in renal cell carcinoma and melanoma specimens revealed heterogeneous immune responses: T cell states and infiltration differed intra- and inter-clonally, and adjacent tumor and immune cells exhibited distinct gene expression. Altogether, our method yields insights into the spatial relationships between clonality, neighboring cell types, and gene expression that drive T cell responses.

Keywords: T cell; T cell receptor; cell interactions; clonotype; immune niches; sequencing; spatial; tertiary lymphoid structures; transcriptomics; tumor infiltrating lymphocytes.


Conflict of interest statement

Declaration of interests F.C., C.J.W., S.L., J.B.I., K.J.L., and S. Li have filed a patent on this work. D.A.B. reports non-financial support from Bristol Myers Squibb; honoraria from LM Education/Exchange Services; advisory board fees from Exelixis and AVEO; personal fees from Charles River Associates, Schlesinger Associates, Imprint Science, Insight Strategy, Trinity Group, Cancer Expert Now, Adnovate Strategies, MDedge, CancerNetwork, Catenion, OncLive, Cello Health BioConsulting, PWW Consulting, Haymarket Medical Network, Aptitude Health, and AbbVie; and research support from Exelixis, outside of the submitted work. C.J.W. holds equity in BioNTech, Inc. K.J.L. holds equity in Standard BioTools Inc. (formerly Fluidigm Corporation). F.C. is a paid consultant for Atlas Bio.

Figures

Figure 1.
Figure 1.. Slide-TCR-seq spatially localizes T cell receptors and transcriptome information.
A) Schematic of Slide-TCR-seq. First, 10 μm beads containing many DNA oligos are affixed onto a slide. The spatial bead barcode is then in situ sequenced to create a map of the bead barcodes to the spatial locations. Samples can then be placed onto the slides, and RNA captured via the poly-dT sequence on the oligos. cDNA libraries prepared with Slide-seqV2 are split before fragmentation with one portion used for targeted amplification via rhTCRseq optimized for use with Slide-seq libraries and the other portion used for whole transcriptome amplification. Slide-TCR-seq thereby provides gene expression, cell type, and clonotype information in space. (B) Serial sections of the OT-I mouse spleen with hematoxylin and eosin stain showing characteristic architecture of red pulp and white pulp separation. (C) Spatial reconstruction of a representative Slide-TCR-seq array from three replicates for a corresponding section of OT-I mouse spleen, with RCTD cell type assignment. Cell types are plotted individually in Figure S1C. NK = natural killer. (D) Gene expression (in UMI counts) gaussian-filtered heatmap of a representative Slide-TCR-seq array from three replicates for visualizing the spatial distribution of gene markers for marginal zone (Marco), red blood cells (RBCs; Gypa), and CD8 T cells (Cd8a). (E) The fraction of beads that capture CDR3 variable sequences (y-axis) when constant UMIs, UMIs corresponding to the TCR constant reads from the whole transcriptome sequencing of Slide-seq, are captured (x-axis) for TCRα (left, light blue) and TCRβ (right, dark blue), with the number of corresponding beads along the top axis (weighted average across n=3 replicates, error bars are weighted standard deviation). (F-G) Comparing the spatial distribution of constant (left) and variable (right) sequences of a representative Slide-TCR-seq array of 3 replicates for TCRα (F) and TCRβ (G) with superimposed density plot. UMI: unique molecular identifier. All scale bars: 500 μm. See also Figure S1.
Figure 2.
Figure 2.. T cell receptor repertoire differences between spatial compartments in human lymph node and tonsil.
(A) Spatial reconstruction of a representative Slide-TCR-seq array from two technical replicates a 10 μm section of human reactive lymph node, LNl, with RCTD cell type assignment. Cell types are plotted individually in Figure S2C. (B) Characterization of the number of unique TCRs on beads that contain TCRs across lymph node and tonsil samples (n=l0, bar plots indicate means, and error bars indicate standard deviation of replicates.) (C) Gene expression gaussian-filtered heatmap of a representative Slide-TCR-seq array from two technical replicates for visualizing the spatial distribution of gene markers for T cells (TRBC2) and germinal centers (GCs; CXCRS, BCL6). (D) Bead designation of a representative Slide-TCR-seq array from two technical replicates into either GC regions (blue) or non-GC (orange) regions based on unsupervised clustering and GC markers on LN1. Beads with TCRβ CDR3 sequences detected are shown by black dots, but only for CDR3 sequences detected on >1 bead. (E) For LNl, Left: For clonotypes found on >1 bead, a Venn diagram showing the clonotype overlap between GC (blue) and non-GC (orange) regions. Right: the significance of the observed number of shared clonotypes compared to the expected number from randomly shuffled assignments. (F) Shannon entropy (i.e., a measure of diversity) of the TCR repertoire in GC vs. non-GC regions for six arrays across three human secondary lymphoid organs. (G) Clonotypes grouped by clonotype fraction, normalized by the total number of TCRs in each compartment, in GC and non-GC regions in lymph node and tonsil, with the number of corresponding beads along the top axis. (H) K-means clustering distinguishing two GCs in a human reactive lymph node. (I) Left: For clonotypes detected on >l bead, a Venn diagram showing clonotype overlap between GC1 (purple) and GC2 (red) regions. Right: The significance of the observed number of shared clonotypes between GCs compared to the expected number from randomly shuffled assignments. (J) Differential enrichment of TRBV and TRBJ sequences in GC (red) vs non-GC (blue) regions (top) and GC1 (red) vs GC2 (blue) regions (bottom). All scale bars: 500 μm. LN = lymph node. TON = tonsil. See also Figure S2.
Figure 3.
Figure 3.. Slide-TCR-seq identifies spatial differences between T cell clonotypes in renal cell carcinoma.
(A) H&E stain of an RCC metastasis to the lung following treatment with a PD-1 inhibitor. (B) Compartment assignment of the lung (green), boundary (orange), and tumor (blue) of a representative Slide-TCR-seq array from three replicates by applying K-nearest neighbors to cell types determined by unsupervised clustering. (C) Spatial localization of T cell clonotypes (n=549 clonotypes, colored by clonotype) of a representative Slide-TCR-seq array from three replicates. (D) Within-tumor spatial localization of 3 distinct RCC cell subtypes (STAR Methods) of a representative Slide-TCR-seq array from three replicates. (E) Within-tumor spatial localization of a representative Slide-TCR-seq array from three replicates of the five most abundant non-tumor non-T cell types as determined by RCTD and using the combination of five scRNA-seq datasets as reference. DC = dendritic cell. (F) Top: Significance of clonotype spatial distributions compared against all other clonotypes with at least ten beads per array from the post-treatment specimen plotted against tumor enrichment (n=3 serial arrays, two one-tailed K-S tests) with Bottom: Visualization of selected significant clonotypes, ordered by tumor enrichment, in tissue compartments for a single array (T cells within the tumor compartment are displayed as opaque, T cells within other compartments are shown as translucent). (G) Comparison of the tumor enrichment of clonotypes that are exclusive to the post-treatment sample (n=48 clonotypes) versus clonotypes that are shared with the pre-treatment sample (n=5 clonotypes) across all serial arrays. (H) Lack of correlation between the mean tumor enrichment of clonotypes in Slide-TCR-seq and their fraction in bulk TCR-seq from the same post-treatment specimen, by Spearman’s correlation. (I) Left: The three axes – spatial localization, gene expression, and T cell clonotype – that Slide-TCR-seq can relate. Center: distribution of poor response to immune checkpoint inhibitor treatment (‘PRI’) gene set expression across all clonotypes in the tumor region for the post-PD-1 inhibitor RCC lung metastasis in a single array with kernel density estimation. Yellow = clonotypes with lower than median PRI expression; purple = clonotypes with PRI expression greater than or equal to the median value. Right: localization of low (yellow) and high (purple) PRI gene set expression clonotypes within the tumor region (light blue) from the Slide-TCR-seq array shows their distinct spatial separation (light blue = tumor region, orange = boundary region, green = lung region). (J) Smoothed histograms comparing the distance infiltrated into the tumor by two-tailed K-S test comparing low (yellow) and high (purple) expression clonotypes, as dichotomized by median expression of PRI. (K) Expression of PRI gene set across clonotypes with at least 20 beads (n=7 clonotypes), dichotomized based on each clonotype’s median distance infiltrated into the tumor from the tumor edge (red = less infiltrated, blue = more infiltrated; the median distances in μm are displayed along the top). TCR-4 exhibited higher PRI expression when localized closer to the tumor edge than farther from the edge (by two-tailed K-S test). See STAR Methods for n of each distribution. All scale bars: 500 μm. NS = nonsignificant. See also Figures S3–5.
Figure 4.
Figure 4.. Clonal expansion and T cell state between tertiary lymphoid structures and tumor regions in renal cell carcinoma and melanoma
(A-B) Aligned H&E of a serial section (left), representative Slide-TCR-seq array (center) with beads colored by RCTD cell type assignments, and zoomed-in Slide-TCR-seq of tertiary lymphoid structure (TLS) (right) in RCC (A) and melanoma (B). (C-D) Region mask of a representative Slide-TCR-seq array delineating tumor, TLS, and adjacent non-neoplastic regions (top left); beads containing both CDR3 and T cell state colored by RCTD assignment (top center); Gaussian-filtered heatmap visualizing TCRs weighted by the extent of clonal expansion (top right); Gaussian-filtered heatmap normalized to maximum values in TLSs and tumor regions, visualizing the location of B cell, CD4+ T cell, and CD8+ Exhausted (Exh) T cell types (bottom); in RCC (C) and melanoma (D). (E-F) Grouped barplot visualizing the fraction of T cells in each compartment (TLS, tumor, and adjacent non-neoplastic) grouped by the extent of clonal expansion of the T cells in RCC (E; n=4 arrays across two regions) and melanoma (F; n=5 arrays across three regions). (G-H) Grouped barplot visualizing the fraction of T cells in each compartment (TLS, tumor, adjacent non-neoplastic) grouped by their T cell states in RCC (G; n=4 arrays across two regions) and melanoma (H; n=5 arrays across three regions). Barplots indicate means and error bars indicate standard deviation of replicates. All scale bars: 500 μm. All statistical tests are by t-test and corrected for false discovery rate, * p = 0.05, ** p = 0.005, *** p = 0.0005, **** p = 0.00005. Treg = regulatory T cell; Tfh = follicular T helper cell; NonExh = non-exhausted; Exh = exhausted. See also Figure S5.
Figure 5.
Figure 5.. Interactions between a spatially unique T cell clone and tumor cells in melanoma
(A) H&E of melanoma tumor sample (top) and schematic illustrating the delineation of two distinct lobes (orange and blue) of the tumor across the corresponding H&E, Slide-TCR-seq arrays, and constructed region masks (bottom). ROI = region of interest. (B) Spatial enrichment of TCRs between the two lobes, tested by chi-square test (n=7 arrays across three regions). (C) Visualization of all TCRs (left) and the CASRASNEQFF TCR clonotype (right) across one array from each of the three regions. These visualizations are representative of the findings across the seven arrays, shown in Figure S5. (D) Differentially expressed genes between T cells with the CASRASNEQFF clonotype (right) and all other TCRs (left) (STAR Methods), with blue dots representing statistically significant differentially-expressed genes with absolute log fold change > 0.4 (n=7 arrays across three regions). (E) i. Differentially expressed genes between monocytes (M) within 20 μm of T cells with CASRASNEQFF (right; T*) and monocytes within 20 μm of all other TCRs (left; T), excluding any monocytes that are within 20 μm of both T cells with CASRASNEQFF and other TCRs. ii. Differentially expressed genes between tumor cells (Turn) within 20 μm of T cells with CASRASNEQFF (right; T*) and tumor cells within 20 μm of all other TCRs (left; T), excluding any tumor cells that are within 20 μm of both T cells with CASRASNEQFF and other TCRs (STAR Methods). Blue dots represent statistically significant differentially-expressed genes with absolute log fold change > 0.4 (n=7 arrays across three regions). (F) Beads colored by CXCL10 expression (purple, counts ≥2) in one representative array of seven. arrays (G) Beads colored by MGST1 expression (green, counts ≥1) in one representative array of seven arrays. Scale bars: 500 μm See also figure S5.

References

    1. Ansel KM et al.. (1999) ‘In vivo-activated CD4 T cells upregulate CXC chemokine receptor 5 and reprogram their response to lymphoid chemokines’, The Journal of experimental medicine, 190(8), pp. 1123–1134. doi:10.1084/jem.190.8.1123. - DOI - PMC - PubMed
    1. Bendall ML et al.. (2019) ‘Telescope: Characterization of the retrotranscriptome by accurate estimation of transposable element expression’, PLoS computational biology, 15(9), p. e1006453. doi:10.1371/journal.pcbi.1006453. - DOI - PMC - PubMed
    1. Bi K et al.. (2021) ‘Tumor and immune reprogramming during immunotherapy in advanced renal cell carcinoma’, Cancer cell, 39(5), pp. 649–661.e5. doi:10.1016/j.ccel1.2021.02.015. - DOI - PMC - PubMed
    1. Bolotin DA et al.. (2015) ‘MiXCR: software for comprehensive adaptive immunity profiling’, Nature methods, 12(5), pp. 380–381. doi:10.1038/nmeth.3364. - DOI - PubMed
    1. Bost P et al. (2020) ‘Host-Viral Infection Maps Reveal Signatures of Severe COVID-19 Patients’, Cell, 181(7), pp. 1475–1488.e12. doi:10.1016/j.ce1l.2020.05.006. - DOI - PMC - PubMed

Publication types

Substances