. 2022 Oct 11;41(2):111461.
doi: 10.1016/j.celrep.2022.111461.

Maternal gut microbiota mediate intergenerational effects of high-fat diet on descendant social behavior

Affiliations

Maternal gut microbiota mediate intergenerational effects of high-fat diet on descendant social behavior

Claudia M Di Gesù et al. Cell Rep. .

Erratum in

Abstract

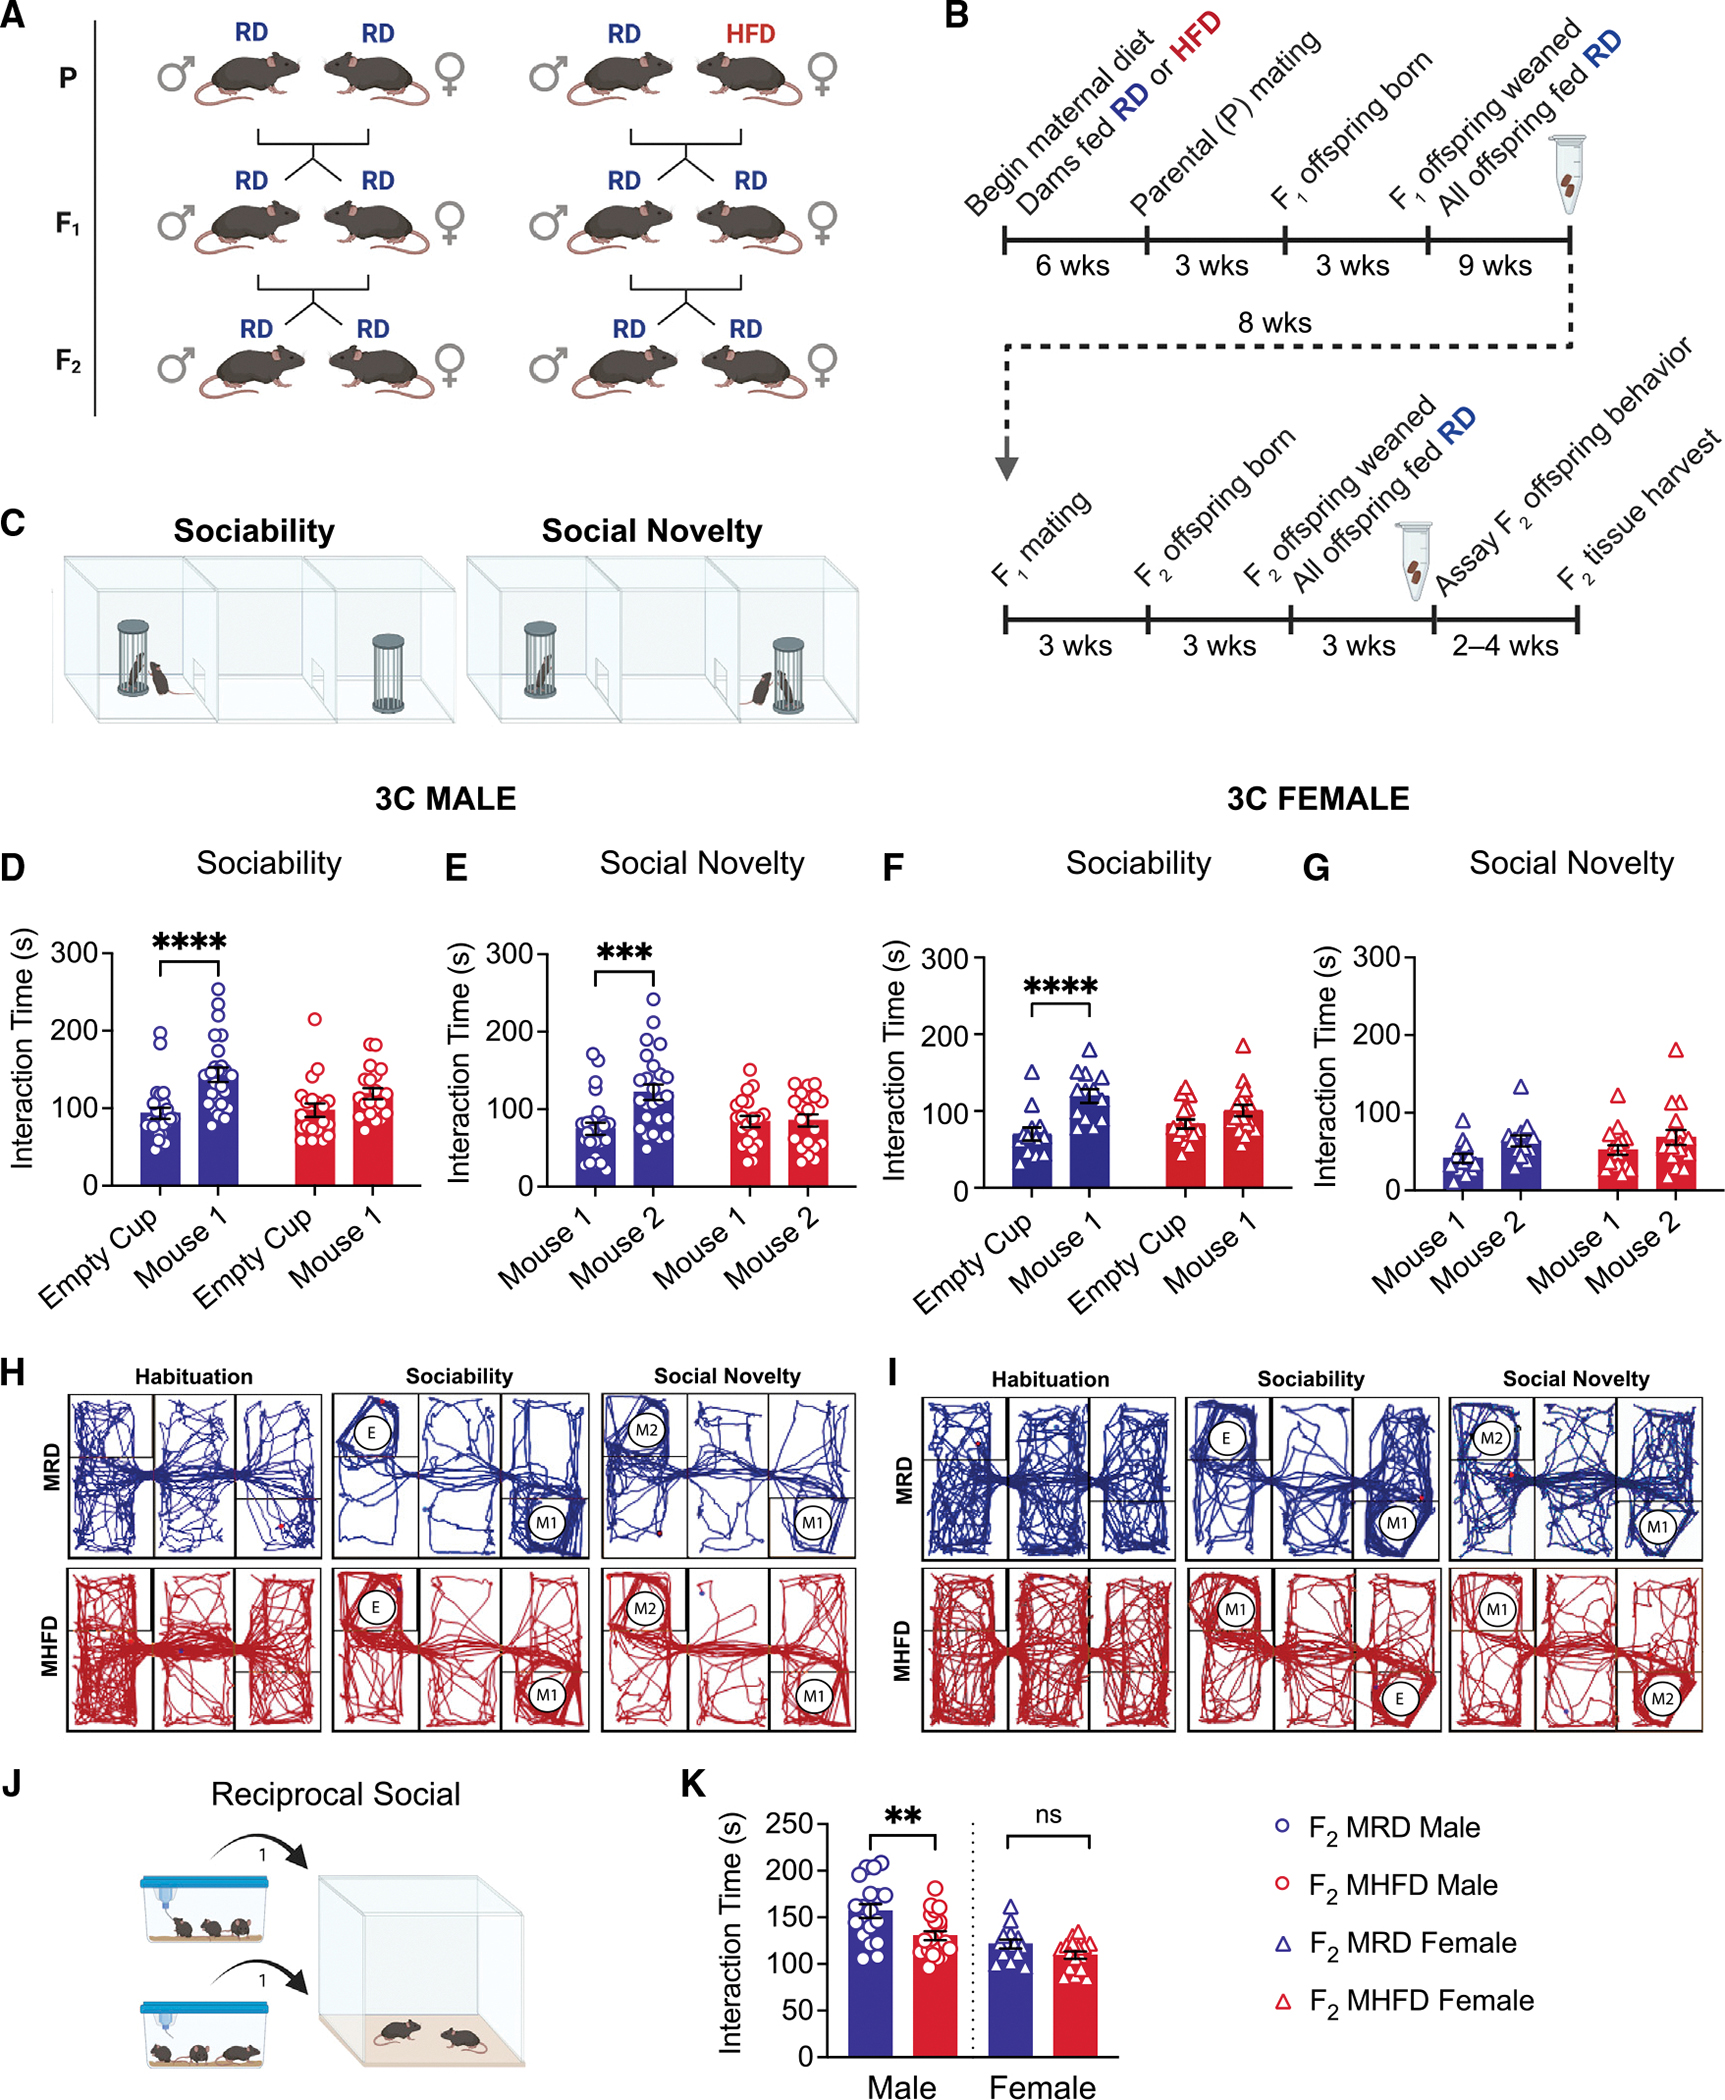
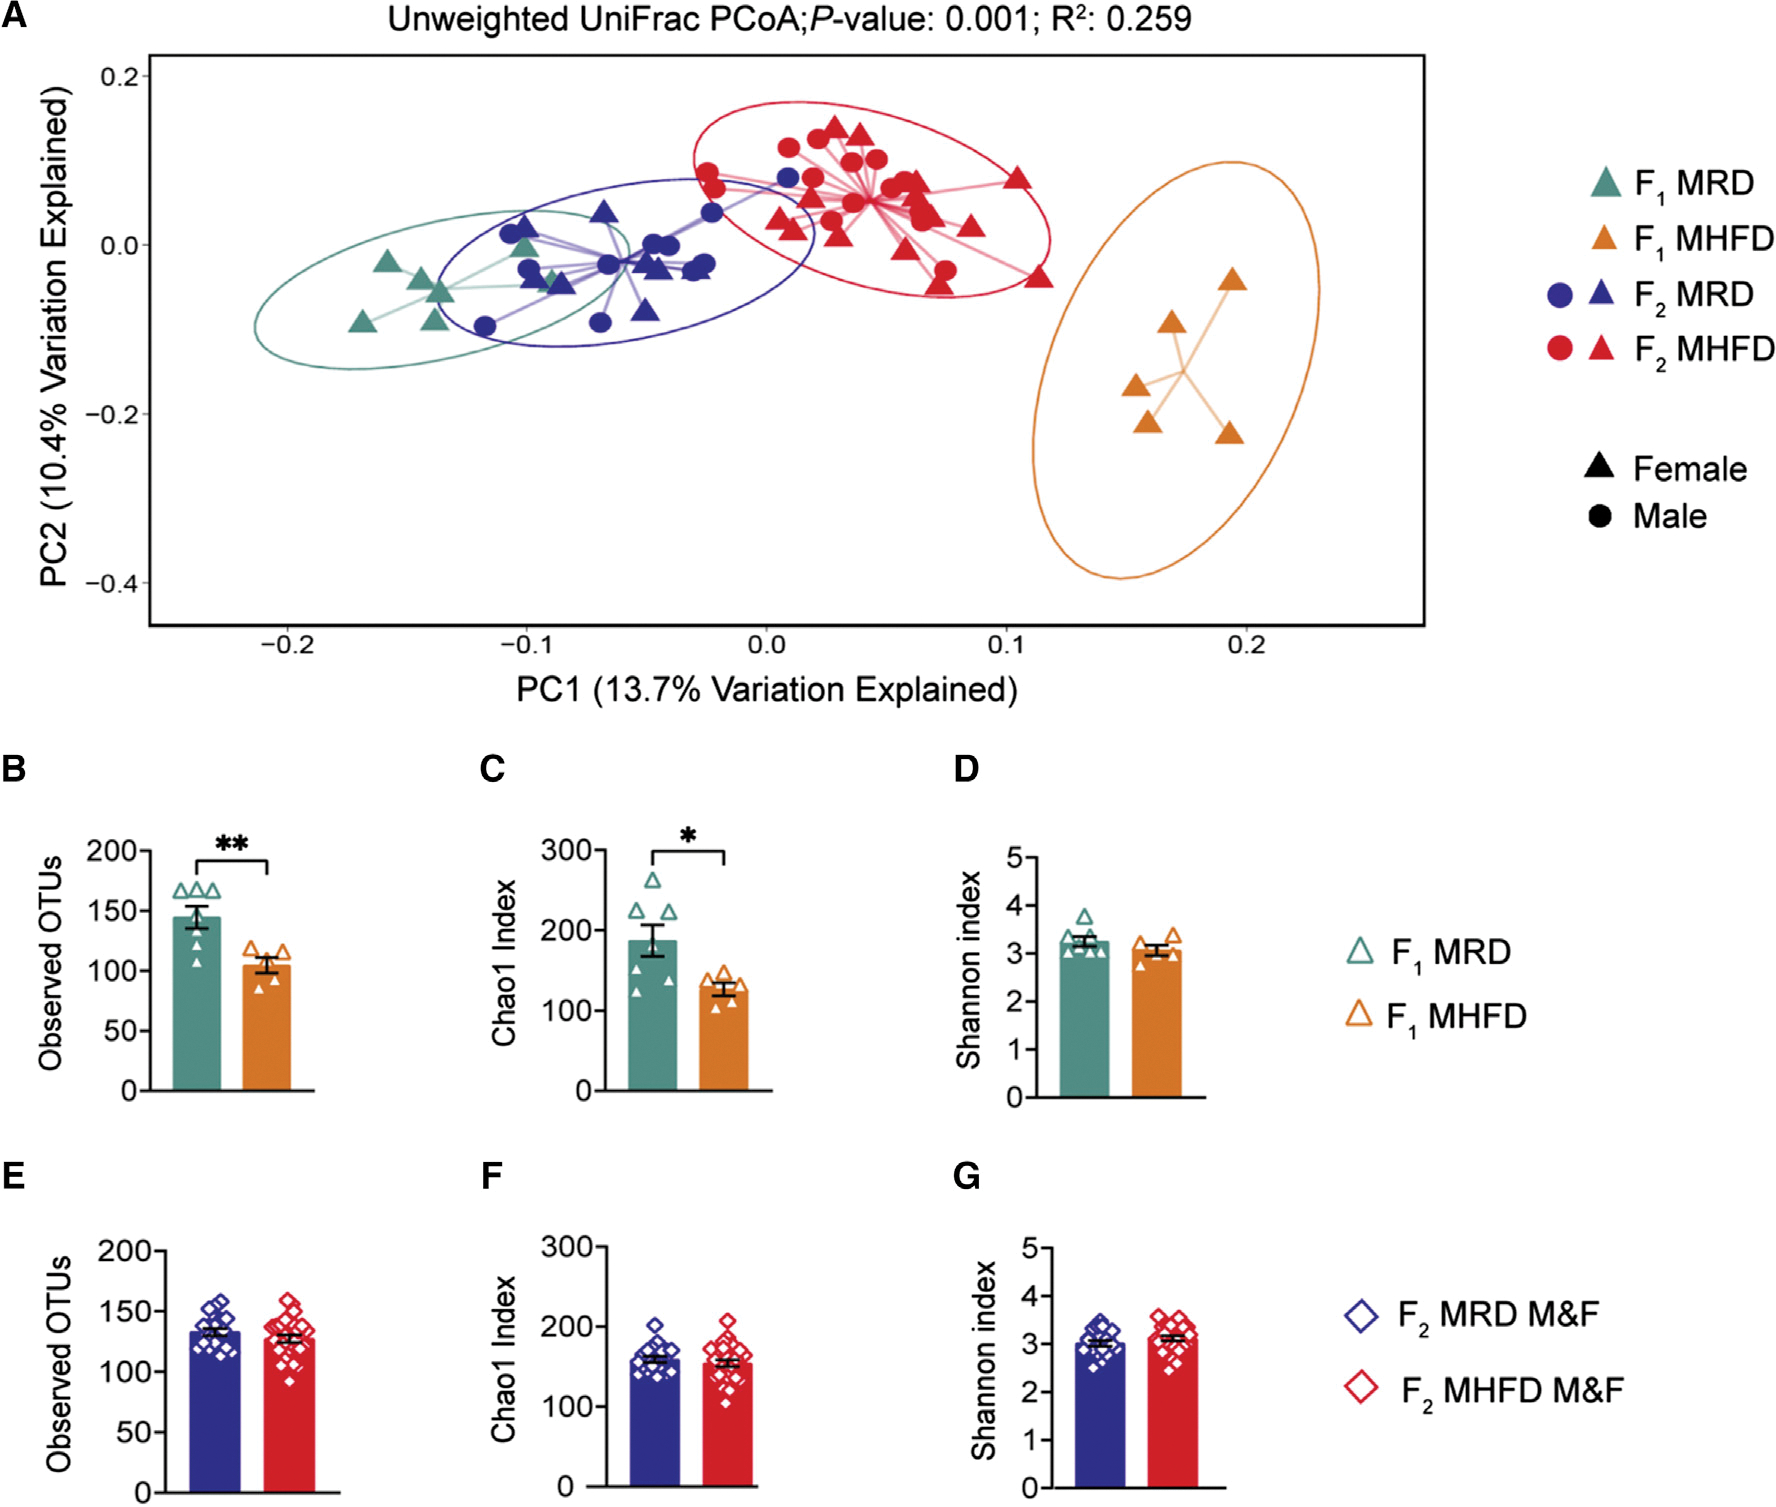
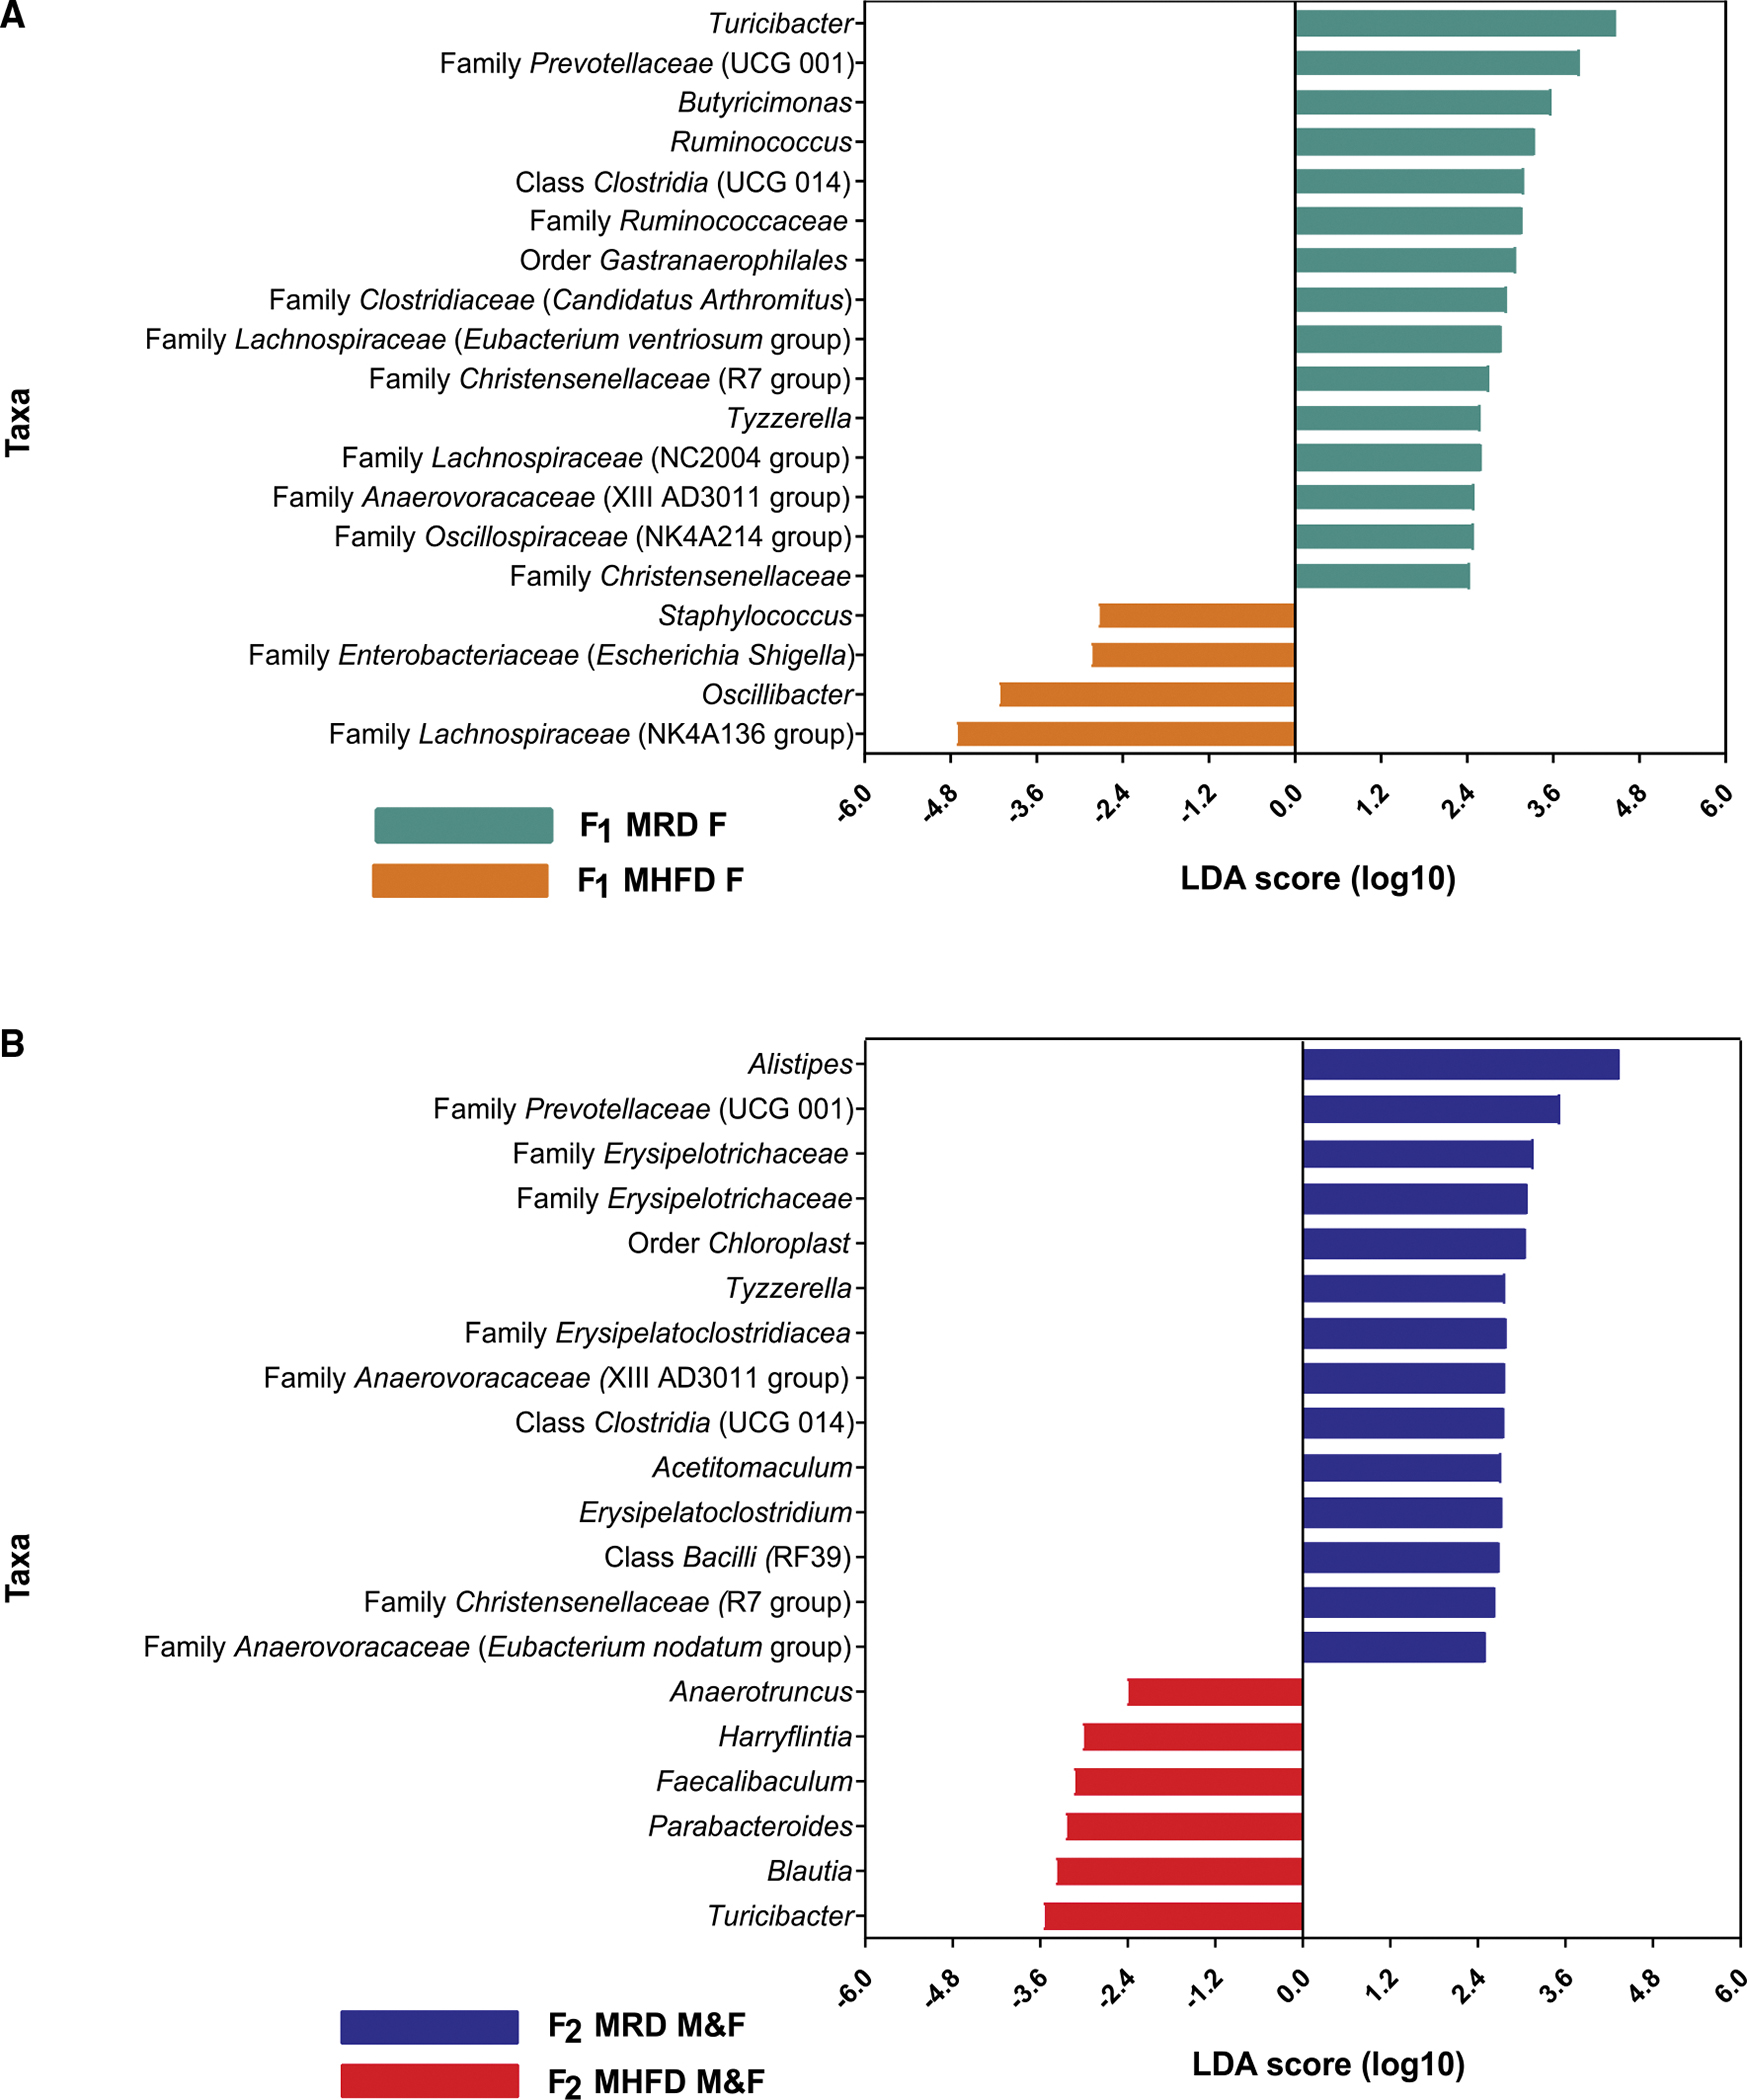
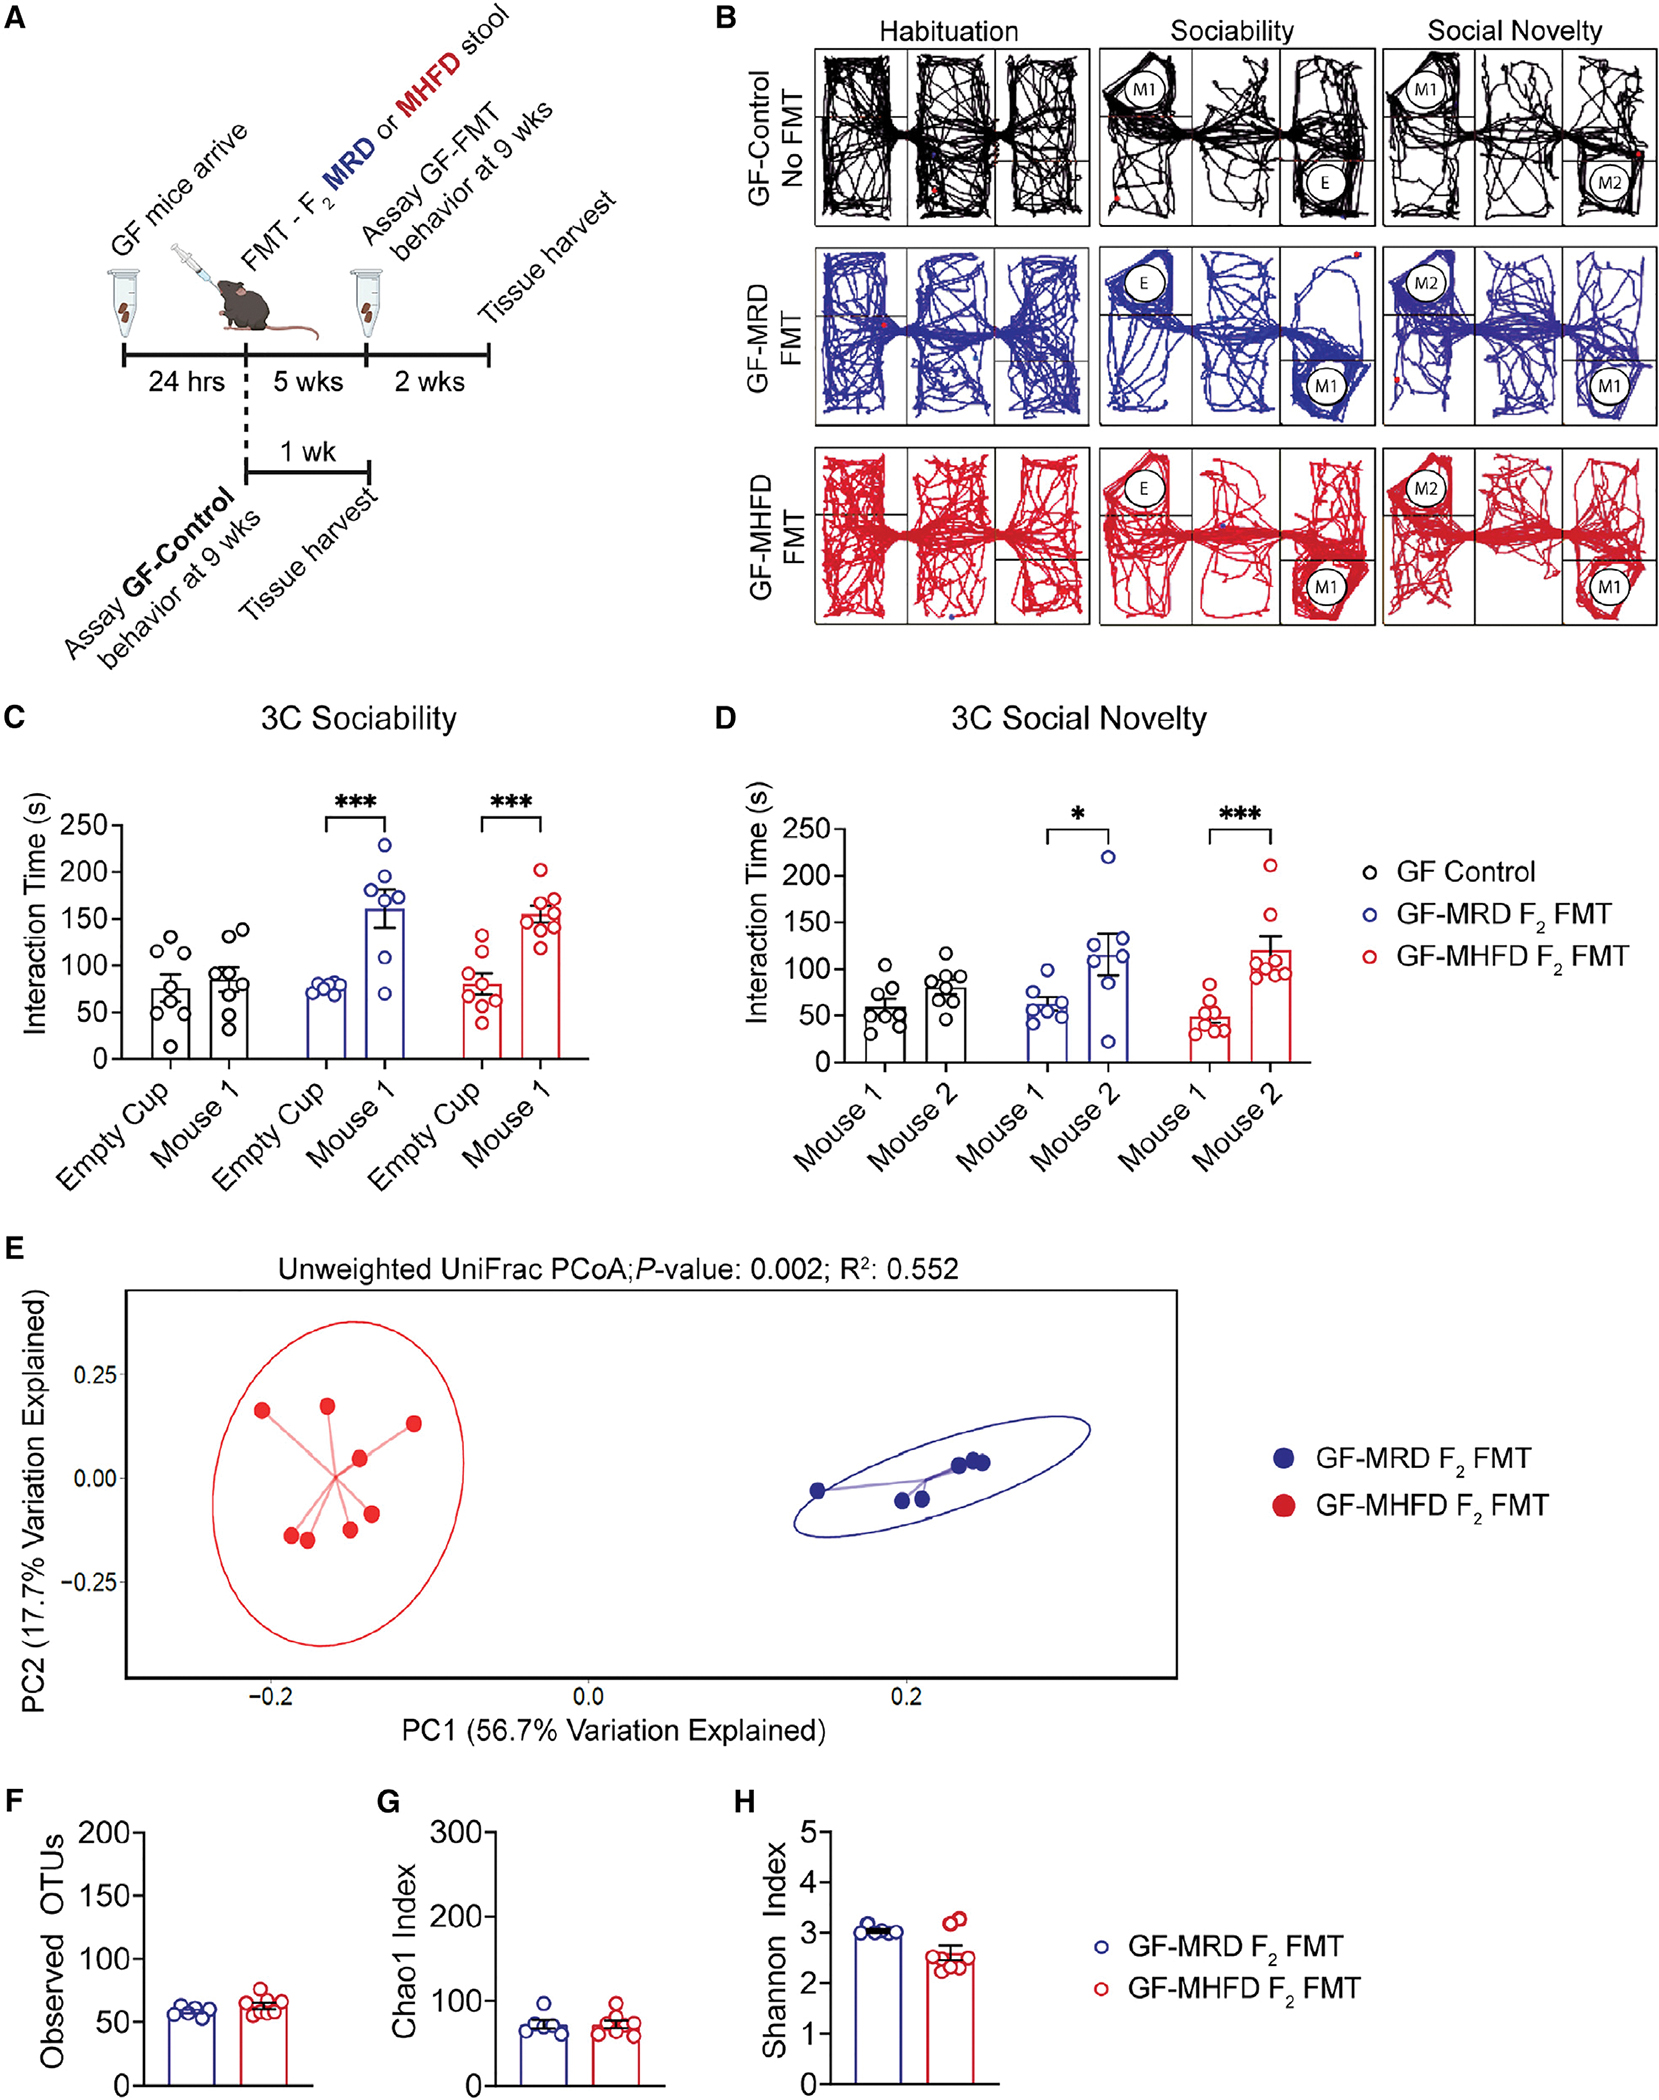
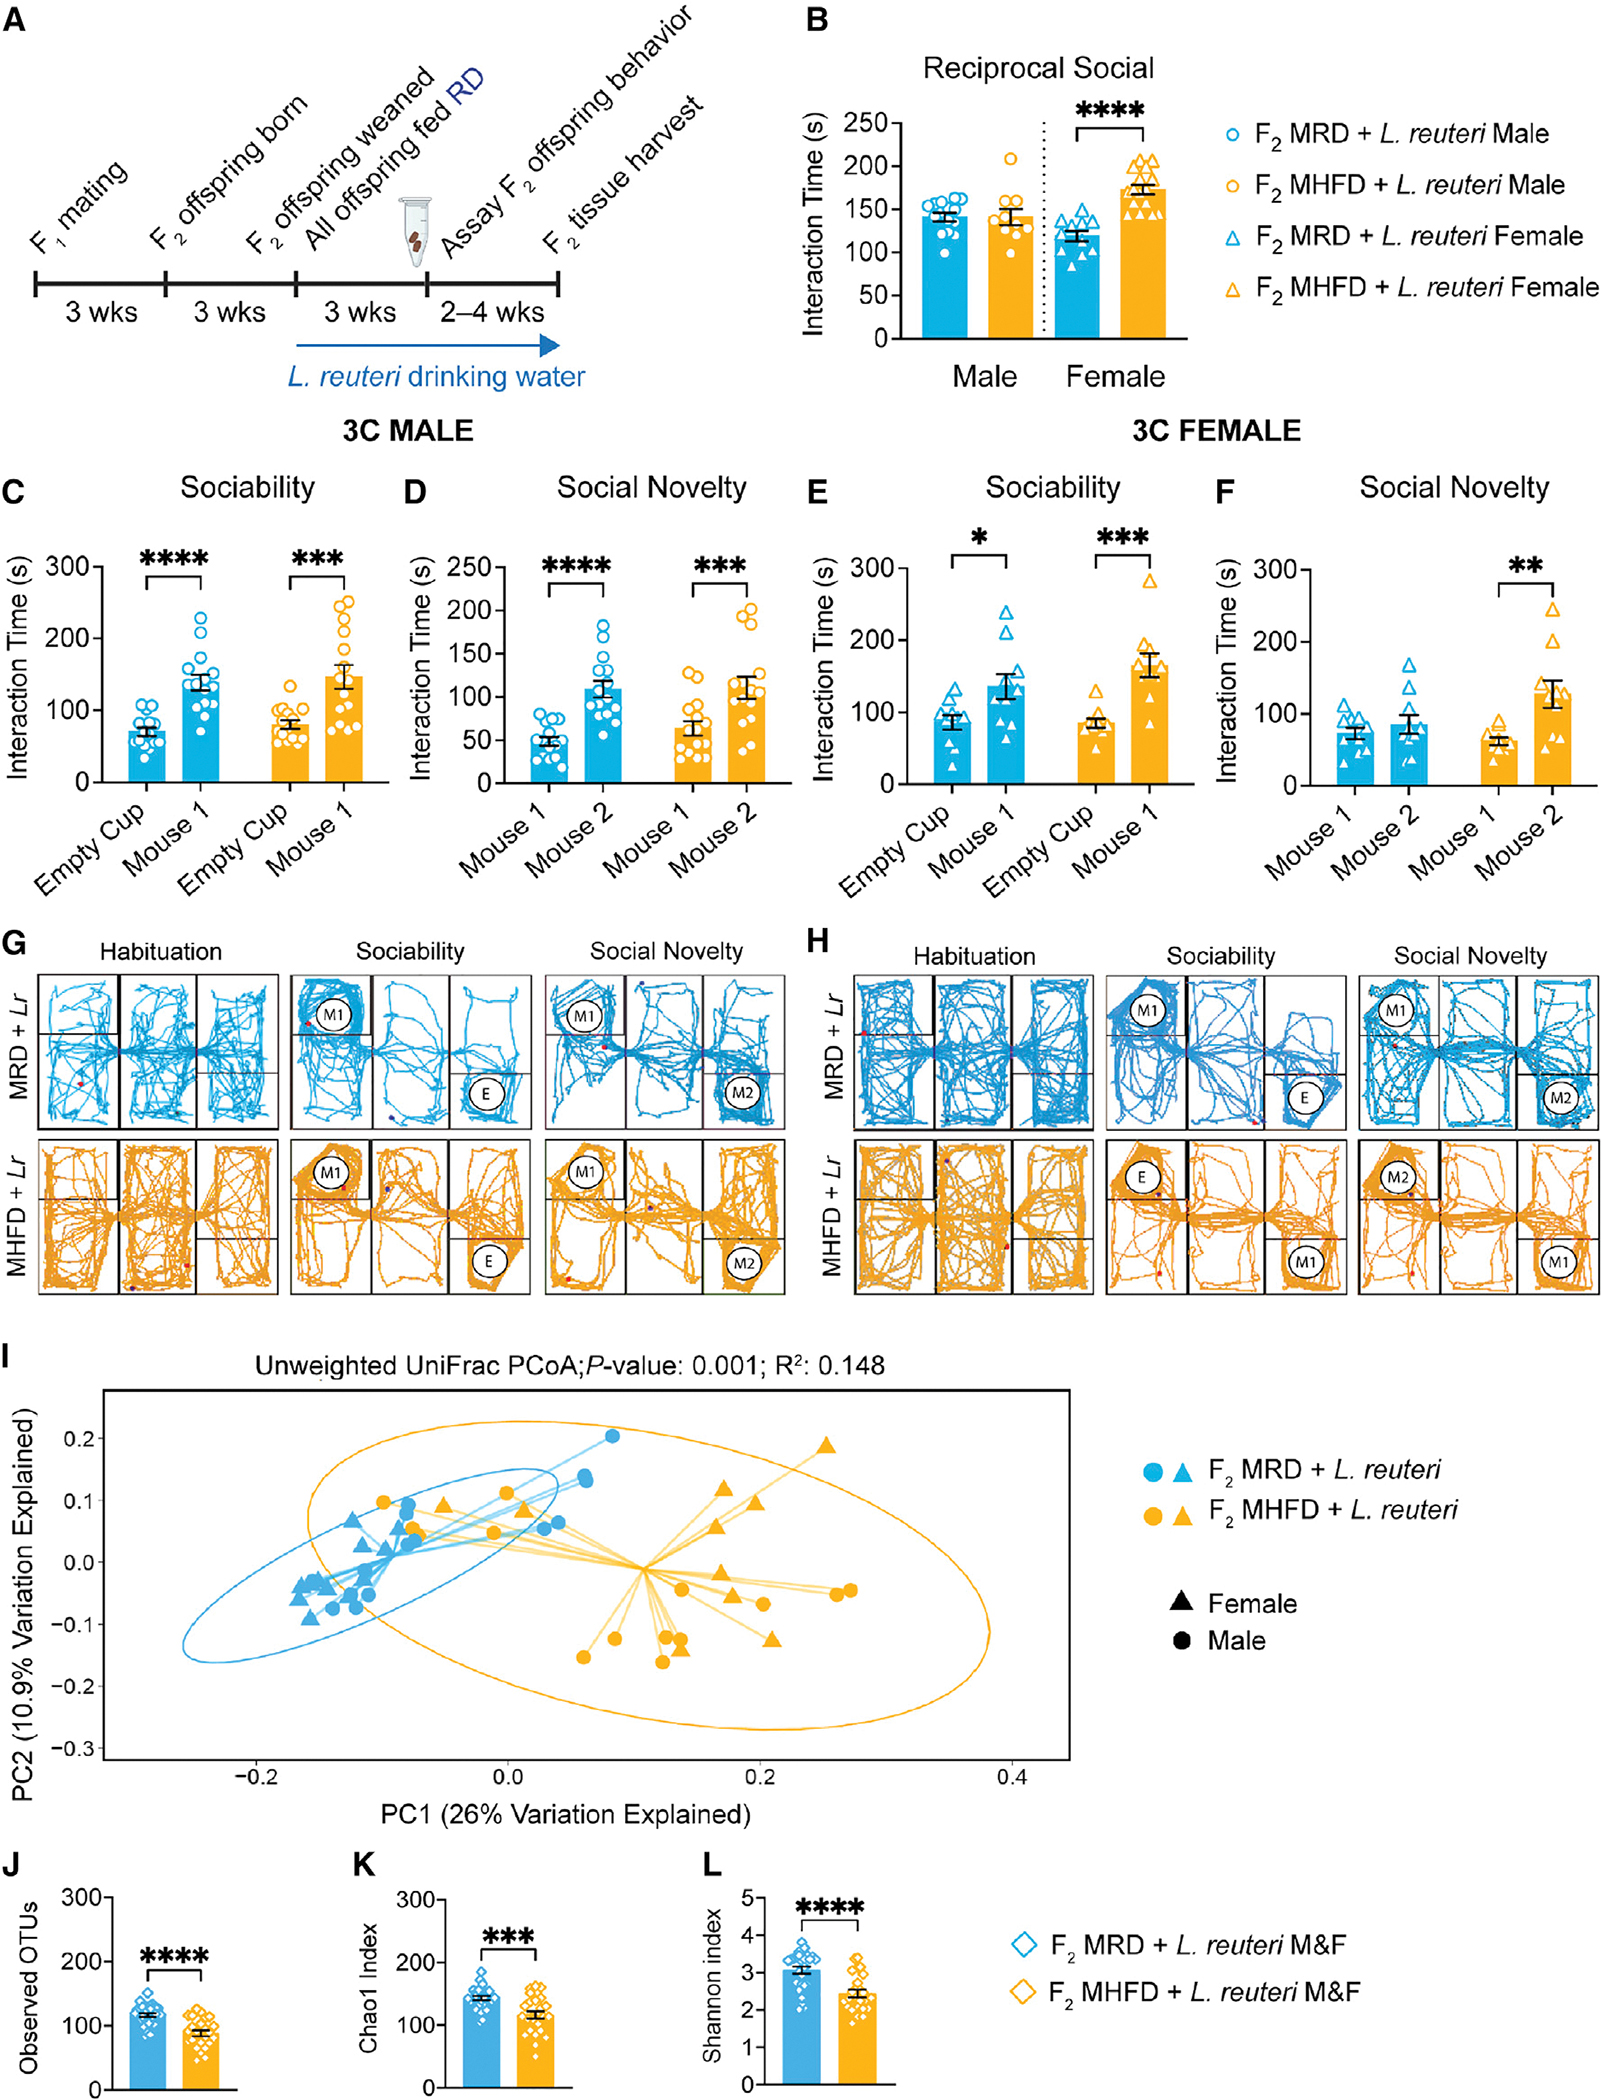
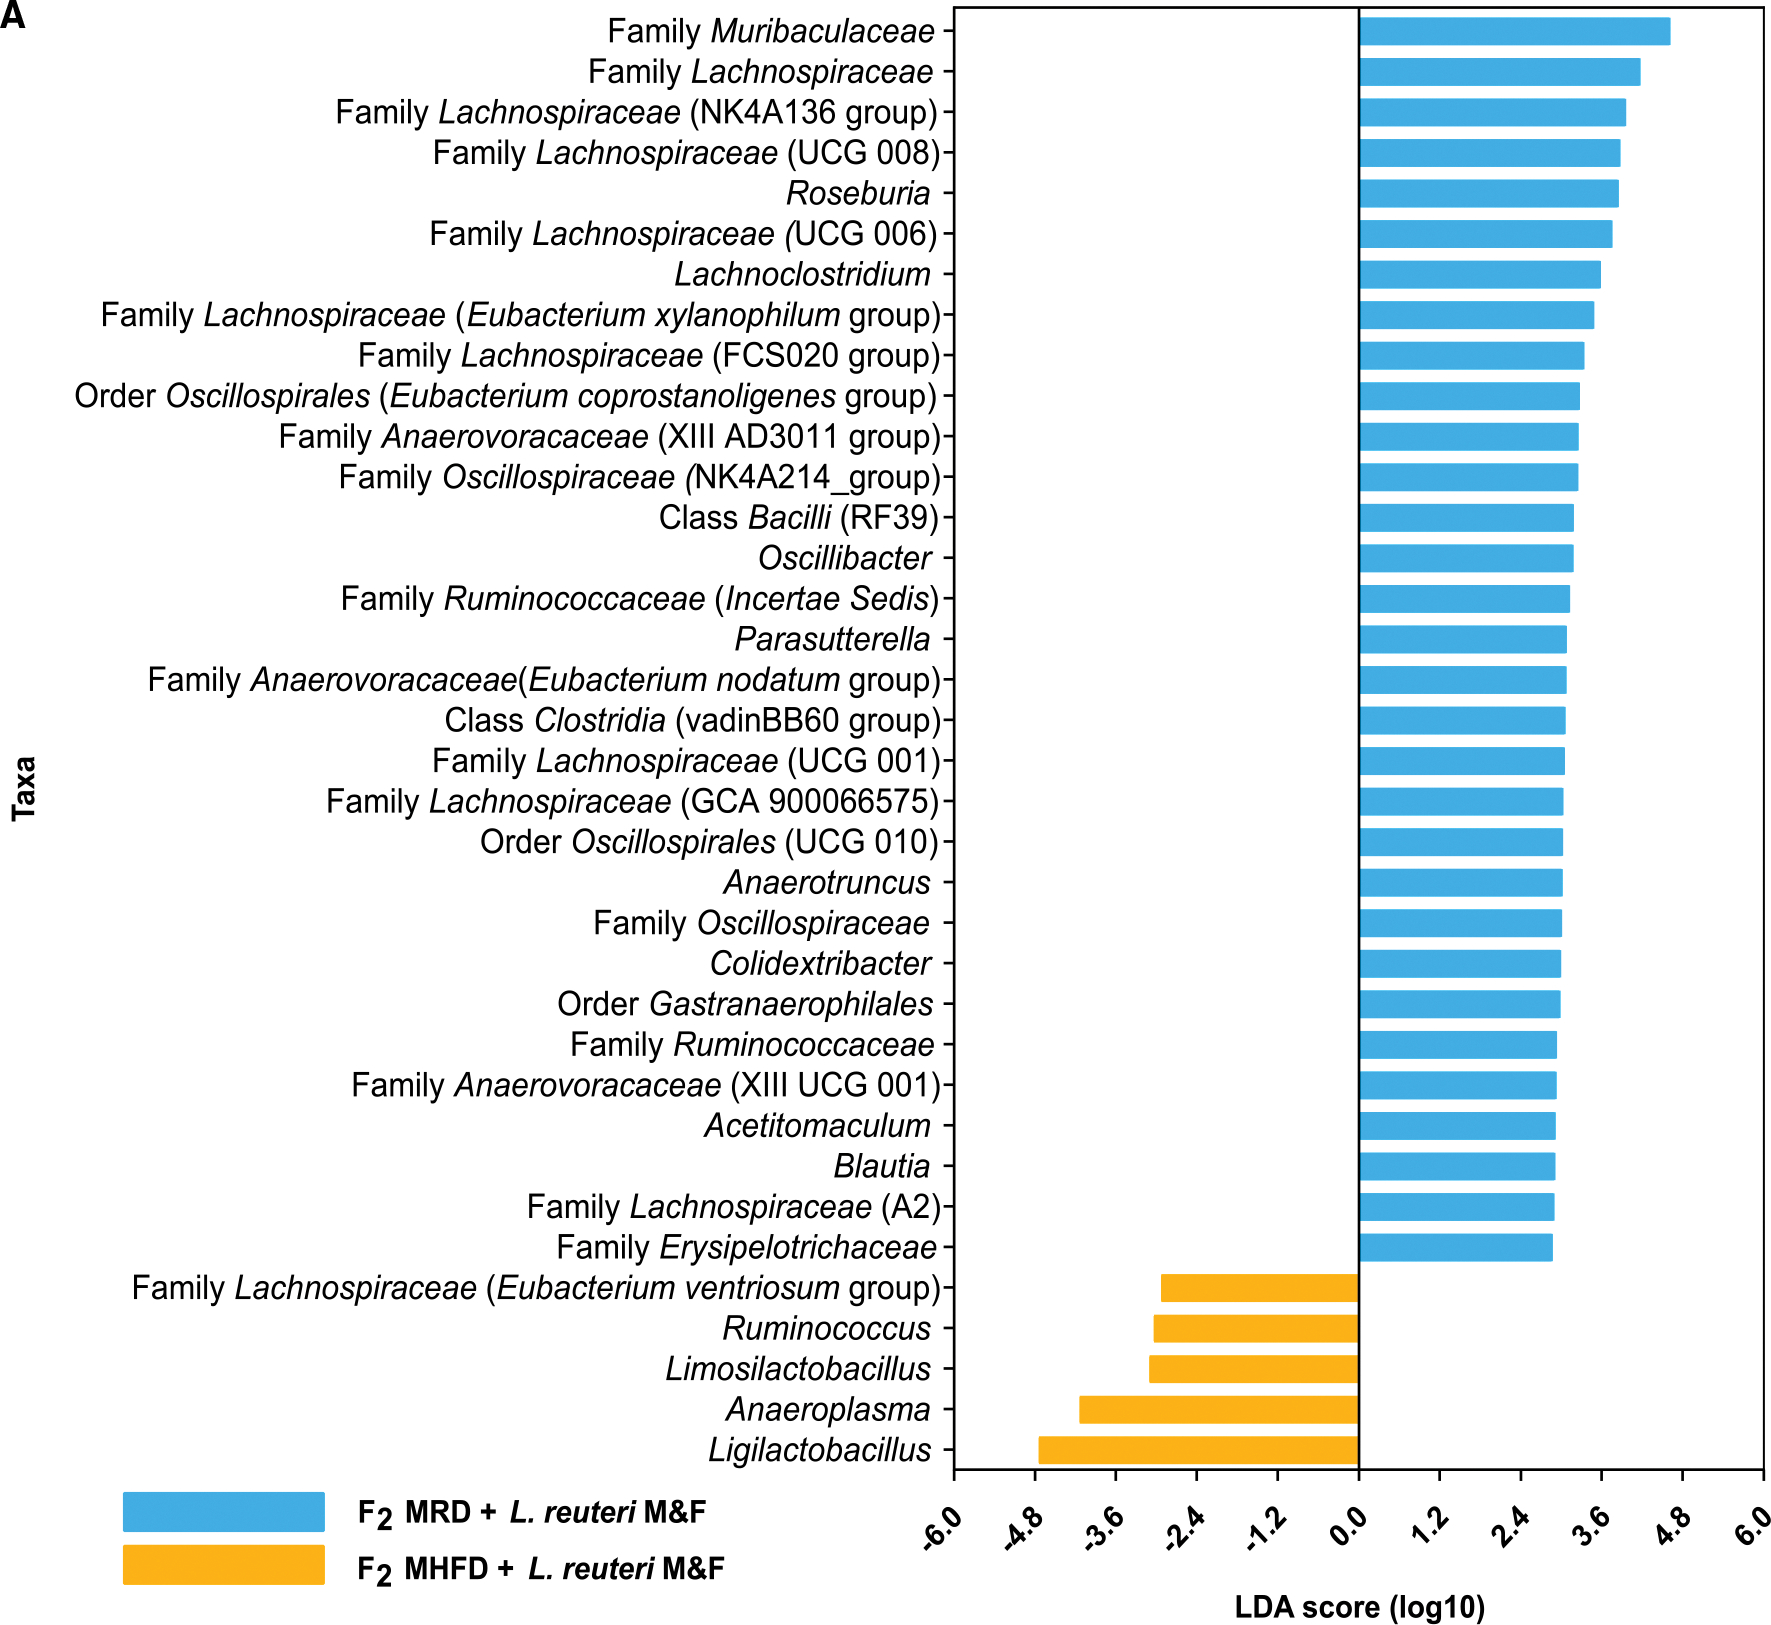
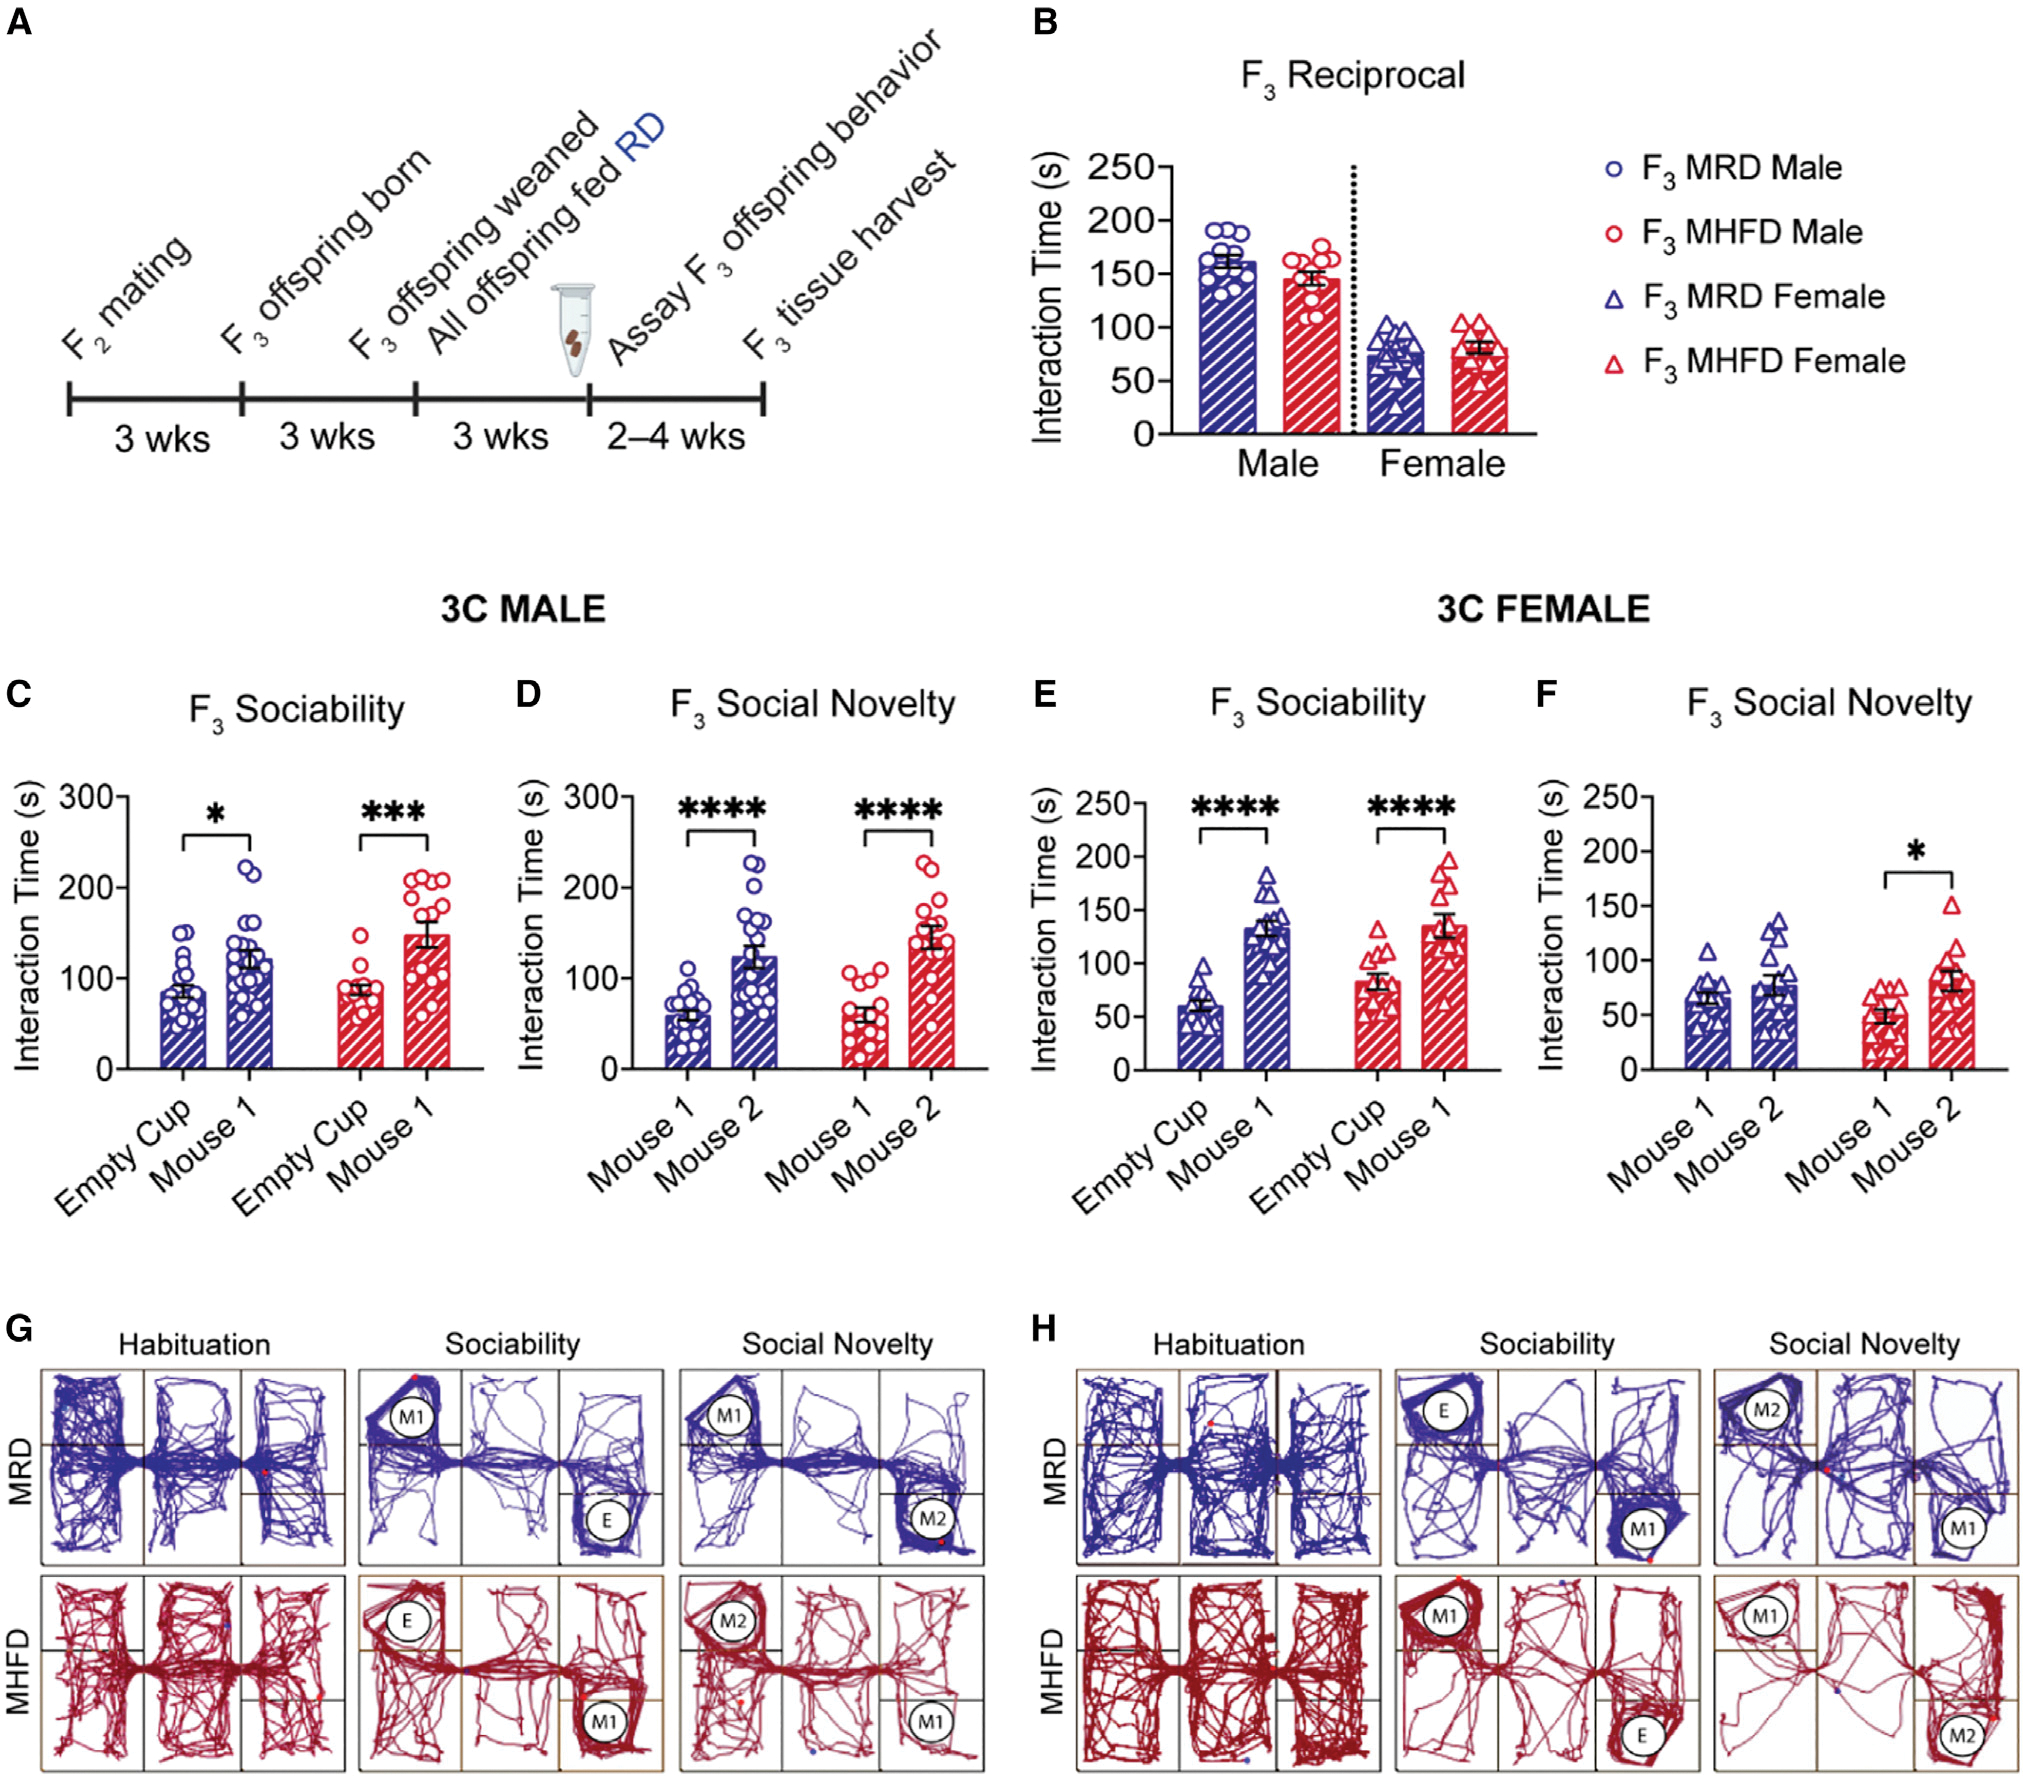
Dysbiosis of the maternal gut microbiome during pregnancy is associated with adverse neurodevelopmental outcomes. We previously showed that maternal high-fat diet (MHFD) in mice induces gut dysbiosis, social dysfunction, and underlying synaptic plasticity deficits in male offspring (F1). Here, we reason that, if HFD-mediated changes in maternal gut microbiota drive offspring social deficits, then MHFD-induced dysbiosis in F1 female MHFD offspring would likewise impair F2 social behavior. Metataxonomic sequencing reveals reduced microbial richness among female F1 MHFD offspring. Despite recovery of microbial richness among MHFD-descendant F2 mice, they display social dysfunction. Post-weaning Limosilactobacillus reuteri treatment increases the abundance of short-chain fatty acid-producing taxa and rescues MHFD-descendant F2 social deficits. L. reuteri exerts a sexually dimorphic impact on gut microbiota configuration, increasing discriminant taxa between female cohorts. Collectively, these results show multigenerational impacts of HFD-induced dysbiosis in the maternal lineage and highlight the potential of maternal microbiome-targeted interventions for neurodevelopmental disorders.

Keywords: CP: Microbiology; CP: Neuroscience; DOHaD; Limosilactobacillus reuteri; intergenerational; maternal diet; microbiome; neurodevelopment; probiotics; social behavior.


Conflict of interest statement

Declaration of interests S.A.B. is an inventor on a patent granted to Baylor College of Medicine related to the use of Limosilactobacillus reuteri for treating disorders characterized by social dysfunction (US Patent No. 11135252). The authors declare no other competing interests.

Figures

Figure 1.
Figure 1.. MHFD-descendant F2 offspring display social dysfunction
(A) Schematic of breeding scheme to produce MRD- and MHFD-descendant F2 generations with HFD exposure indicated. (B) Timeline of mating and behavior. Eppendorf tubes represent time of stool sample collection. (C) Schematic of Crawley’s 3 chamber (3C) test for sociability and preference for social novelty. (D and E) (D) MHFD F2 male offspring show impaired sociability (MRD: t(86) = 4.517, p < 0.0001; MHFD: t(86) = 1.735, p = 0.1651) and (E) preference for social novelty (MRD: t(43) = 4.208, p = 0.0003; MHFD: t(43) = 0.1159, p = 0.9916) compared with MRD F2 males. (F) MRD F2 females show a strong preference in 3C sociability (MRD: t(28) = 5.406, p < 0.0001), with MHFD F2 female offspring showing mild deficits in sociability (MHFD: t(28) = 2.181, p = 0.0741). (G–I) (G) Neither MRD nor MHFD F2 female offspring showed a statistically significant preference for social novelty (MRD: t(28) = 1.934, p = 0.1224; MHFD: t(28) = 1.613, p = 0.222). Representative MRD-descendant (blue) or MHFD-descendant (red) F2 offspring 3C track plots for (H) males and (I) females. (J) Reciprocal social interaction schematic. (K) Comparison of reciprocal social interaction times revealed decreased interaction among MHFD-descendant F2 male, but not female, stranger pairs (male MHFD versus MRD: t(39) = 3.103, p = 0.0036; female MHFD versus MRD: t(28) = 1.918, p = 0.0653). Bar graphs show mean ± SEM with individual data points representing biological replicates. (D–G) N = 13–25 subjects per group; (K) N = 14–22 pairs per group.
Figure 2.
Figure 2.. F2 MHFD descendants harbor a distinct gut microbiome from F2 MRD descendants but show a partial recovery of richness
(A) Principal-coordinate analysis (PCoA) of unweighted UniFrac distances from the averaged rarefied 16S rRNA gene amplicon sequencing dataset (8,310 reads/sample; n = 1,000 rarefactions) revealed statistically significant clusters based on diet and generation (p = 0.001, R2 = 0.259). (B–D) Alpha diversity metrics of F1 females used to generate F2 offspring revealed a statistically significant loss of microbial diversity in MHFD compared with MRD dams, as measured by observed OTUs (MHFD F1 versus MRD F1: t(10) = 3.272, p = 0.0084) and Chao1 index (MHFD F1 versus MRD F1: t(10) = 2.494, p = 0.0317). The Shannon diversity index did not differ between cohorts (MHFD F1 versus MRD F1: t(10) = 1.204, p = 0.2564). (E–G) No significant differences in alpha diversity between F2 groups were observed, as measured by observed OTUs (MHFD F2 versus MRD F2: t(45) = 1.192, p = 0.2395), Chao1 index (MHFD F2 versus MRD F2: t(45) = 0.8097, p = 0.4224), and Shannon index (MHFD F2 versus MRD F2: t(45) = 1.274, p = 0.2093). Bar graphs show mean ± SEM with individual data points representing biological replicates. (A–G) N = 5–15 subjects per group.
Figure 3.
Figure 3.. LEfSe analysis indicates differentially abundant genus-level taxa between diet cohorts in F1 and F2 generations
(A) Histogram of the LDA scores (log10) computed for genus-level taxa with differential abundance in MHFD and MRD F1 dams. (B) Histogram of the LDA scores (log10) computed for genus-level taxa with differential abundance in MHFD and MRD F2 offspring. LDA, linear discriminant analysis; LEfSe, LDA effect size. (A and B) N = 5–15 subjects per group.
Figure 4.
Figure 4.. Fecal microbiota transplants from both F2 MRD and MHFD descendants rescue germ-free social deficits
(A) Timeline of germ-free (GF) fecal microbiota transplant (FMT), stool collection for 16S rRNA gene sequencing, and behavioral analysis. (B–D) (B) Representative 3C track plots for GF-Control (black), GF MRD-FMT (blue), or GF MHFD-FMT (red) males. 3C interaction times for (C) sociability (GF-Control: t(20) = 0.5364, p = 0.9349; MRD-FMT: t(20) = 4.688, p = 0.0004; MHFD-FMT: t(20) = 4.429, p = 0.0008) and (D) preference for social novelty (GF-Control: t(20) = 1.355, p = 0.4696; MRD-FMT: t(20) = 3.155, p = 0.0149; MHFD-FMT: t(20) = 4.558, p = 0.0006) showing social dysfunction in GF males is rescued by FMT from either MRD- or MHFD-descendant F2 donors. Bar graphs show mean ± SEM with individual data points. (E) PCoA of unweighted UniFrac distances from the averaged rarefied 16S rRNA gene amplicon sequencing dataset (3,370 reads/sample; n = 1,000 rarefactions) revealed statistically significant clusters based on diet (p = 0.002, R2 = 0.552). (F–H) Alpha diversity metrics did not differ between GF MRD-FMT or GF MHFD-FMT males, as measured by observed OTUs (GF MRD-FMT versus GF MHFD-FMT: t(12) = 1.391, p = 0.1895), Chao1 index (GF MRD-FMT versus GF MHFD-FMT: Mann-Whitney U = 22, p = 0.8518), and Shannon diversity index (GF MRD-FMT versus GF MHFD-FMT: Mann-Whitney U = 12, p = 0.1419). Bar graphs show mean ± SEM with individual data points representing biological replicates. (C–H) N = 7–8 subjects per group.
Figure 5.
Figure 5.. L. reuteri rescues social deficits in male F2 MHFD-descendant offspring and exerts differential effects on F2 MRD versus MHFD offspring gut microbiota composition
(A) Experimental schematic. Three monogamous MRD lineage or MHFD lineage F1 breeder cages were used to establish MRD- and MHFD-descendant F2 generations, respectively. Upon weaning at 3 weeks old, all mice were given drinking water containing 108 CFU/mL L. reuteri daily through behavior assessment. (B) Analysis of the reciprocal social interaction times between pairs revealed no differences between males (male MHFD + L reuteri versus MRD + L. reuteri: t(22) = 0.01855, p = 0.9854), with increased interaction times between F2 MHFD + L. reuteri females compared with F2 MRD + L. reuteri females (female MHFD + L. reuteri versus MRD + L. reuteri: t(25) = 6.340, p < 0.0001). (C and D) (C) F2 male MHFD + L. reuteri offspring show typical preference during sociability (MRD: t(56) = 4.515, p < 0.0001; MHFD: t(56) = 4.373, p = 0.0001) and (D) social novelty (MRD: t(28) = 5.472, p < 0.0001; MHFD: t(28) = 4.28, p = 0.0004). (E–H) (E) Likewise, MHFD + L. reuteri F2 female offspring show a statistically significant preference during sociability (MRD: t(36) = 2.633, p = 0.0246; MHFD: t(36) = 4.253, p = 0.0003) and (F) preference for social novelty (MRD: t(18) = 0.7226, p = 0.7228; MHFD: t(18) = 3.763, p = 0.0028). Representative MRD + L. reuteri (light blue) or MHFD + L. reuteri (light orange) track plots for (G) males and (H) females, respectively. Bar graphs show mean ± SEM with individual data points. (I) PCoA of unweighted UniFrac distances from the averaged rarefied 16S rRNA gene amplicon sequencing dataset (5,508 reads/sample; n = 1,000 rarefactions) revealed statistically significant clusters based on diet (p = 0.001, R2 = 0.148). (J–L) L. reuteri administration differentially affects MRD and MHFD F2 gut microbiome alpha diversity, as measured by observed OTUs (MHFD F2 + L. reuteri versus MRD F2 + L. reuteri: t(50) = 5.285, p < 0.0001), Chao1 index (MHFD F2 + L. reuteri versus MRD F2 + L. reuteri: t(52) = 4.143, p = 0.0001), and Shannon index (MHFD F2 + L. reuteri versus MRD F2 + L. reuteri: t(50) = 4.436, p < 0.0001). Bar graphs show mean ± SEM with individual data points representing biological replicates. B, N = 10–16 pairs per group; (C–F) N = 10–15 subjects per group; (I–L) N = 24–28 subjects per group.
Figure 6.
Figure 6.. LEfSe analysis indicates differentially abundant genus-level taxa between diet lineage in L. reuteri-treated F2 groups
Histogram of the LDA scores (log10) computed for genus-level taxa with differential abundance in MHFD and MRD F2 offspring treated with L. reuteri. LDA, linear discriminant analysis; LEfSe, LDA effect size. N = 24–28 subjects per group.
Figure 7.
Figure 7.. Neurotypical social behavior is observed in the MHFD-descendant F3 generation
(A) Breeding schematic. MRD control and MHFD-descendant F2 mice were bred to produce the MRD- and MHFD-descendant F3 generations, respectively. (B–H) (B) Comparison of reciprocal social interaction times revealed no differences between male (F3 MRD versus MHFD: t(22) = 1.824, p = 0.0817) or female pairs (F3 MRD versus MHFD: t(24) = 0.9925, p = 0.3309). Both MRD- and MHFD-descendant F3 males demonstrate normal sociability (C) (MRD: t(33) = 2.934, p = 0.0120; MHFD: t(33) = 4.322, p = 0.0003) and preference for social novelty (D) (MRD: t(33) = 5.493, p < 0.0001; MHFD: t(33) = 6.271, p < 0.0001) in the 3C task. F3 MRD and MHFD female offspring show a statistically significant preference for mouse 1 during the sociability phase of the 3C task (E) (MRD: t(48) = 6.979, p < 0.0001; MHFD: t(48) = 4.663, p < 0.0001), while only MHFD-descendant F3 females show a preference for social novelty (F) (MRD: t(48) = 1.722, p = 0.4632; MHFD: t(48) = 2.879, p = 0.0118). Representative MRD and MHFD track plots for (G) males and (H) females, respectively. Bar graphs show mean ± SEM with individual data points representing biological replicates. (B) N = 11–15 pairs per group; (C–F) N = 12–20 subjects per group.

Similar articles

Cited by

References

    1. Afgan E, Baker D, Batut B, van den Beek M, Bouvier D, Cech M, Chilton J, Clements D, Coraor N, Grüning BA, et al. (2018). The Galaxy platform for accessible, reproducible and collaborative biomedical analyses: 2018 update. Nucleic Acids Res. 46, W537–W544. - PMC - PubMed
    1. Afroz KF, Reyes N, Young K, Parikh K, Misra V, and Alviñ a K (2021). Altered gut microbiome and autism like behavior are associated with parental high salt diet in male mice. Sci. Rep. 11, 8364. - PMC - PubMed
    1. Avni E, Ben-Itzchak E, and Zachor DA (2018). The presence of comorbid ADHD and anxiety symptoms in autism spectrum disorder: clinical presentation and predictors. Front. Psychiatry 9, 717. - PMC - PubMed
    1. Bariselli S, Hörnberg H, Pré vost-Solié C, Musardo S, Hatstatt-Burklé L, Scheiffele P, and Bellone C (2018). Role of VTA dopamine neurons and neuroligin 3 in sociability traits related to nonfamiliar conspecific interaction. Nat. Commun. 9, 3173. - PMC - PubMed
    1. Baron-Cohen S, Knickmeyer RC, and Belmonte MK (2005). Sex differences in the brain: implications for explaining autism. Science 310, 819–823. - PubMed

Publication types

LinkOut - more resources