. 2022 Oct;10(10):e004781.
doi: 10.1136/jitc-2022-004781.

Tripartite antigen-agnostic combination immunotherapy cures established poorly immunogenic tumors

Affiliations

Tripartite antigen-agnostic combination immunotherapy cures established poorly immunogenic tumors

Sven Borchmann et al. J Immunother Cancer. 2022 Oct.

Abstract

Background: Single-agent immunotherapy has shown remarkable efficacy in selected cancer entities and individual patients. However, most patients fail to respond. This is likely due to diverse immunosuppressive mechanisms acting in a concerted way to suppress the host anti-tumor immune response. Combination immunotherapy approaches that are effective in such poorly immunogenic tumors mostly rely on precise knowledge of antigenic determinants on tumor cells. Creating an antigen-agnostic combination immunotherapy that is effective in poorly immunogenic tumors for which an antigenic determinant is not known is a major challenge.

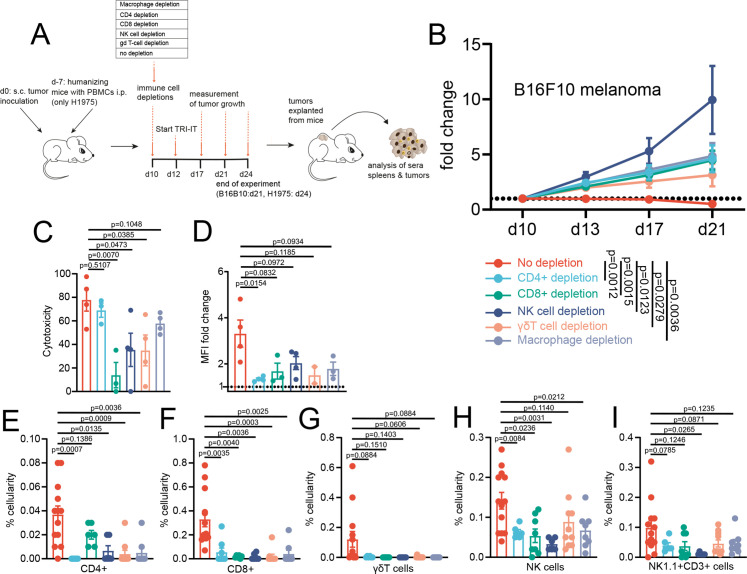
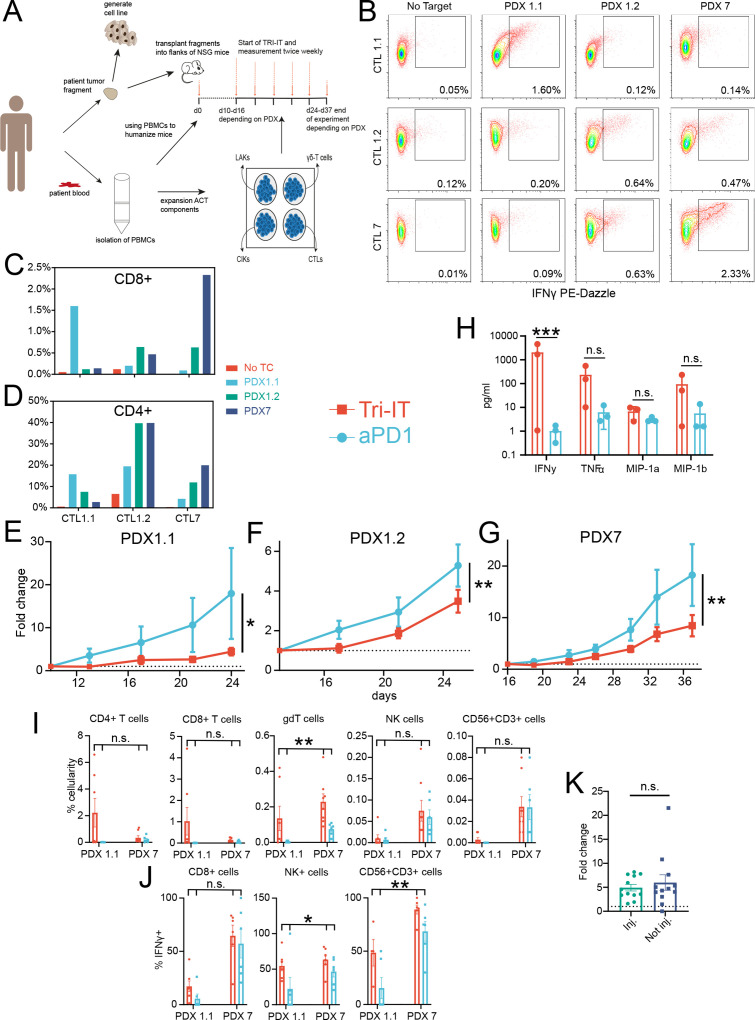
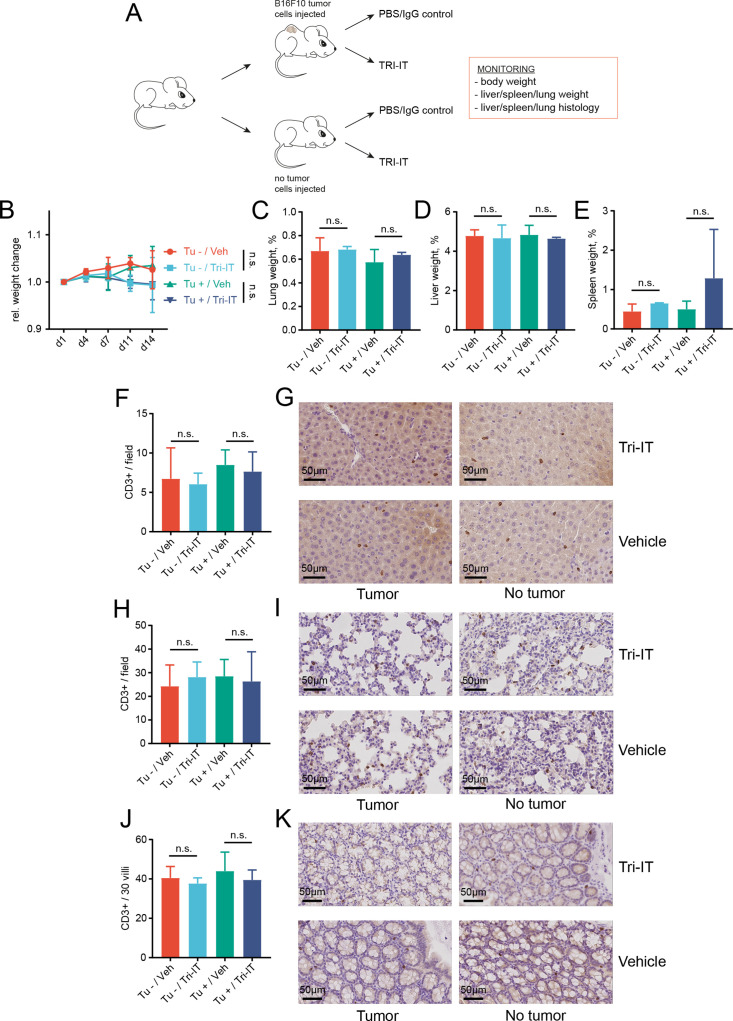
Methods: We use multiple cell line and poorly immunogenic syngeneic, autochthonous, and autologous mouse models to evaluate the efficacy of a novel combination immunotherapy named tripartite immunotherapy (TRI-IT). To elucidate TRI-ITs mechanism of action we use immune cell depletions and comprehensive tumor and immune infiltrate characterization by flow cytometry, RNA sequencing and diverse functional assays.

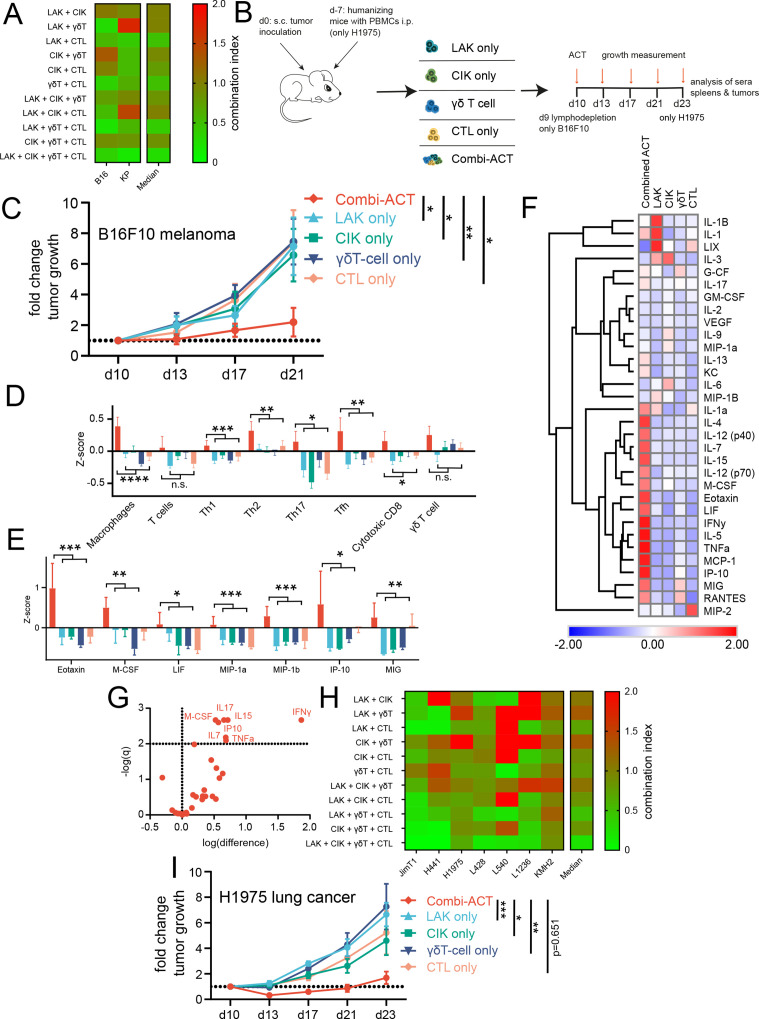
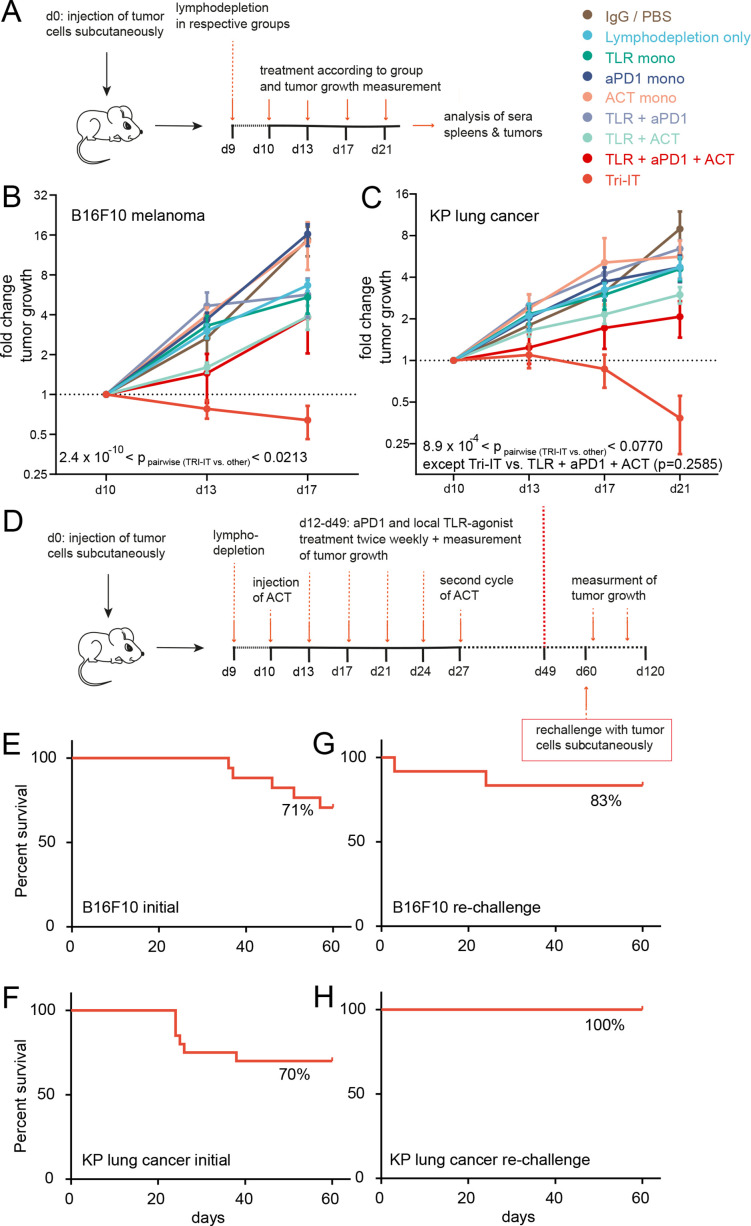
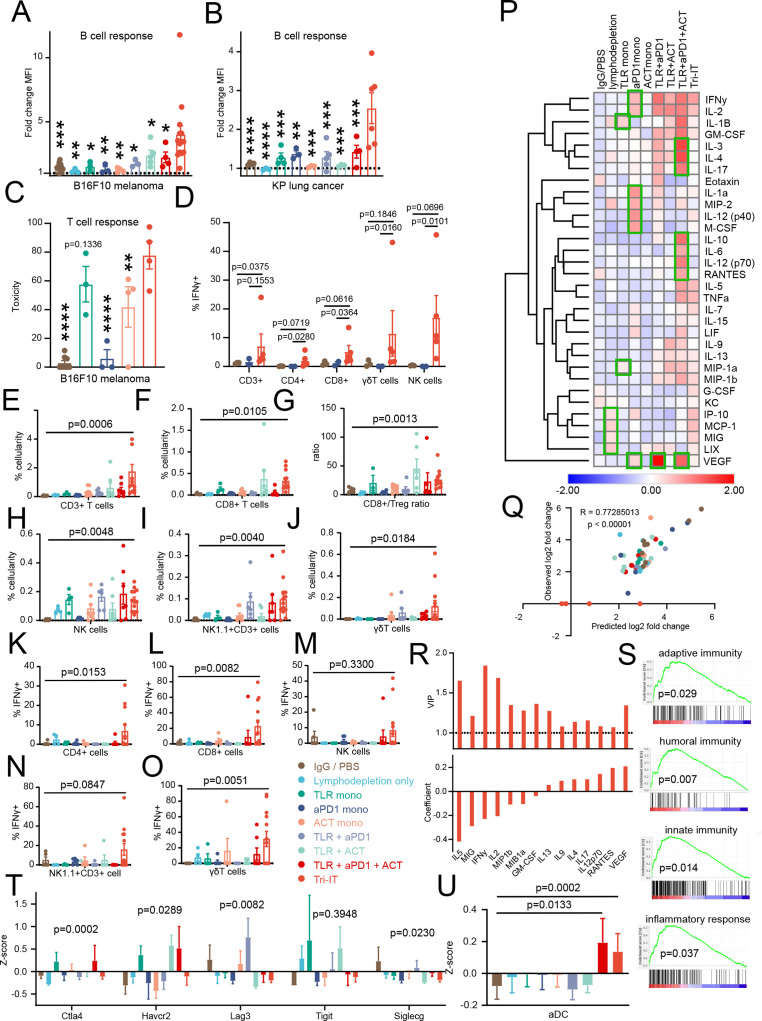
Results: We show that combined adoptive cellular therapy (ACT) with lymphokine-activated killer cells, cytokine-induced killer cells, Vγ9Vδ2-T-cells (γδ-T-cells) and T-cells enriched for tumor recognition (CTLs) display synergistic antitumor effects, which are further enhanced by cotreatment with anti-PD1 antibodies. Most strikingly, the full TRI-IT protocol, a combination of this ACT with anti-PD1 antibodies, local immunotherapy of agonists against toll-like receptor 3, 7 and 9 and pre-ACT lymphodepletion, eradicates and induces durable anti-tumor immunity in a variety of poorly immunogenic syngeneic, autochthonous, as well as autologous humanized patient-derived models. Mechanistically, we show that TRI-IT coactivates adaptive cellular and humoral, as well as innate antitumor immune responses to mediate its antitumor effect without inducing off-target toxicity.

Conclusions: Overall, TRI-IT is a novel, highly effective, antigen-agnostic, non-toxic combination immunotherapy. In this study, comprehensive insights into its preclinical efficacy, even in poorly immunogenic tumors, and mode of action are given, so that translation into clinical trials is the next step.

Keywords: immunotherapy; lung neoplasms; melanoma; sarcoma.


Conflict of interest statement

Competing interests: SB has received travel support from BMS and travel support and consulting fees from Takeda. SB received research funding form Takeda, but this funding did not support the research described in this paper. DK is a cofounder of XRAD Therapeutics, which is developing radiosensitizers. DK is the recipient of a Stand Up To Cancer (SU2C) Merck Catalyst Grant studying pembrolizumab and radiation therapy in sarcoma patients. DK has received research funding from XRAD Therapeutics, Eli Lilly & Co., Bristol Myers Squibb, Varian Medical Systems, and Merck, but this funding did not support the research described in this paper. CR received consulting and lecture fees from Abbvie, Astra-Zeneca, Vertex and Merck. CR received research funding from Gilead Pharmaceuticals. CR is a cofounder of CDL Therapeutics.

Figures

Figure 1
Figure 1
Combined treatment with lymphokine-activated killer cells (LAKs), cytokine-induced killer cells (CIKs), Vγ9Vδ2-T-cells (γδ-T-cells) and adaptive, tumor-specific T-cells (CTLs) is superior to single cell type adoptive cellular therapy. (A) Heatmap of Chou-Talalay combination index (lower equals more synergy) of various adoptive cellular therapy (ACT) subcomponents in two murine cell lines and their median, (B) experimental overview of in vivo experimental workflow for this figure, (C) mean fold change of subcutaneous B16F10 melanoma tumor volumes in C57BL/6 J mice over time treated with ACT subcomponents or combined ACT at equivalent doses (n=8 per group), (D) immune cell deconvolution analysis showing mean gene expression z-scores of immune cell specific transcripts (see the Methods section for details), (E) mean gene expression z-scores of intratumoral cytokines and chemokines (n=3–8) per group, B16F10 tumors harvested on day 21 treated in different experimental groups for (D, E), (F) heatmap of mean z-scores of cytokines quantified by multiplex Luminex analysis in the sera of B16F10 bearing C57BL/6 J mice sacrificed on day 21 treated in different experimental groups, (G) volcano plot showing cytokines detected at significantly higher levels in combined ACT compared with pooled ACT subcomponent treated B16F10 melanoma bearing C57BL/6 J mice, (H) heatmap of Chou-Talalay combination index of various ACT subcomponents in seven human cell lines and their median, (I) mean fold change of subcutaneous H1975 lung cancer tumor volumes in humanized NSG mice over time treated with ACT subcomponents or combined ACT at equivalent doses (n=6–8 per group). all error bars show SE, statistical tests used are two-way ANOVA (C, I), and t-test comparing combined ACT with a pooled control of all single ACT (D, E). *p<0.05, **p<0.01, ***p<0.001, ****p<0.0001. ANOVA, analysis of variance.PBMC, peripheral blood mononuclear cell. M-CSF: macrophage colony-stimulating factor.
Figure 2
Figure 2
TRI-IT synergistically eradicates established, poorly immunogenic tumors. (A) Experimental overview of in vivo experimental workflow for (B, C), (B) mean fold change of subcutaneous B16F10 melanoma tumor volumes in C57BL/6J mice over time in indicated groups* (n=6–16 per group, pooled from multiple independent experiments), (C) mean fold change of subcutaneous KP lung cancer tumor volumes in C57BL/6J mice over time in indicated groups* (n=5–18 per group, pooled from multiple independent experiments), (D) experimental overview of in vivo experimental workflow for (E–H), (E, F) Kaplan-Meier survival plot of established B16F10 melanoma (E) or KP lung cancer (F) bearing C57BL/6J mice treated with TRI-IT. (G, H) Kaplan-Meier survival plot of previously B16F10 melanoma (G) or KP lung cancer (H) bearing C57BL/6 J mice surviving until day 60 after TRI-IT treatment being rechallenged with B16F10 melanoma (G) or KP lung cancer (H). All error bars show SE, statistical tests used are pairwise two-way ANOVA (TRI-IT vs other) (B, C). *The ACT mono groups in (B, C) show reduced tumor growth inhibition compared with figure 1C, because ACT was given without lymphodepletion in these experiments, whereas lymphodepletion was included in figure 1C. ACT, adoptive cellular therapy; ANOVA, analysis of variance; TRI-IT, tripartite immunotherapy. PBS, phosphate-buffered saline. KP, KrasLSL-G12D p53fl/fl lung cancer cell line.
Figure 3
Figure 3
TRI-IT orchestrates a broad antitumor immune response in poorly immunogenic tumors. (A, B) Quantification of antitumor antibody response in sera of subcutaneous B16F10 (A) or KP (B) bearing C57BL/6J mice on day 21 (B16F10) or day 24 (KP) in different treatment groups shown as fold change of geometric mean fluorescence intensity measured by FACS compared with tumor-naïve control mice (n=3–14 per group, pooled from multiple independent experiments, see the Methods section for details,+), (C, D) Quantification of cellular antitumor immunity in splenocytes of B16F10 bearing C57BL/6J mice on day 21 in different treatment groups by (C) cytotoxicity toward B16F10 cells (n=3–8 per group, +) or (D) intracellular IFNγ response measured by FACS on B16F10 re-stimulation (n=2–5 per group), (E–J) Immune cell infiltration into subcutaneous B16F10 bearing C57BL/6J mice on day 21 in different treatment groups measured by FACS (n=4–13 per group, pooled from multiple independent experiments), (K–O) proportion of IFNγ+ cells among indicated subsets of tumor-infiltrating immune cells in subcutaneous B16F10 bearing C57BL/6J mice on day 21 measured by intracellular FACS (n=4–13 per group, pooled from multiple independent experiments), (P) heatmap of mean z-scores of cytokines quantified by multiplex Luminex analysis in the sera of pooled B16F10 or KP bearing C57BL/6J mice sacrificed on day 21 (B16F10) or day 24 (KP) mice treated in different experimental groups with groups of cytokines altered similarly in a treatment group highlighted in green, (Q) correlation between observed log2 fold change and log2 fold change predicted by the final PLR model using cytokines quantified in sera as inputs to predict end of experiment tumor size (see the Methods section for details), (R) coefficients and VIP scores (measure of importance of input variable in model) for all cytokines with a VIP score >1 in the final PLR model, (S) gene set enrichment analysis of day 24 KP tumors for selected gene sets from TRI-IT-treated mice vs pooled mice from all other treatment groups, (T) mean gene expression z-scores of immune checkpoint transcripts quantified in pooled day 21 B16F10 and day 24 KP tumors (n=6–23 per group, pooled from multiple independent experiments), (U) immune cell deconvolution analysis showing mean gene expression z-scores of activated dendritic cell specific transcripts (n=6–23 per group, pooled from multiple independent experiments). All error bars show SE, statistical tests used are t-test (A–C and E–O), Dunn’s test (D, U) and one-way ANOVA (T). +, stars indicate significance level of t-test compared with TRI-IT group, *p<0.05, **p<0.01, ***p<0.001, ****p<0.0001. ANOVA, analysis of variance; TRI-IT, tripartite immunotherapy. PBS, phosphate-buffered saline. KP: KrasLSL-G12D p53fl/fl lung cancer cell line. PLR, partial least square regression. FACS, fluorescence activated cell sorter. VIP: variable importance in projection.
Figure 4
Figure 4
Depletions of CD4+ and CD8+ T cells, NK-cells, γδ-T-cells and macrophages reduce TRI-IT antitumor effect. (A) Experimental overview of in vivo experimental workflow, (B) mean fold change of subcutaneous B16F10 melanoma tumor volumes in C57BL/6 J mice over time in indicated depletion groups (n=6–8 per group), (C) quantification of cellular anti-tumor immunity in splenocytes of B16F10 bearing C57BL/6J mice on day 21 in different treatment groups by measuring cytotoxicity towards B16F10 cells (n=3–4 per group, see the Methods section for details), (D) quantification of antitumor antibody response in sera of subcutaneous B16F10 bearing C57BL/6J mice on day 21 in different depletion groups shown as fold change of geometric mean fluorescence intensity measured by FACS compared with tumor-naïve control mice (n=2–4 per group, see the Methods section for details), (E–I) immune cell infiltration into subcutaneous B16F10 bearing C57BL/6J mice on day 21 in different depletion groups measured by FACS (n=8–13 per group, pooled from multiple independent experiments). all error bars show SE, statistical tests used are two tailed, unpaired t-tests (A, C–I) and two-way ANOVA (B). ANOVA, analysis of variance; TRI-IT, tripartite immunotherapy.
Figure 5
Figure 5
TRI-IT is effective in autologous humanized patient-derived mouse models of lung cancer. (A) Experimental overview of in vivo experimental workflow, (B) FACS plots showing proportion of intracellularly IFNγ+ cells among CD8+T cells after restimulation of indicated CTLs with either no target cells or indicated PDX cells, (C, D) Proportion of intracellularly IFNγ+ cells among CD8+ (C) or CD4+ (D) T-cells after restimulation of indicated CTLs with either no target cells or indicated PDX cells, (E–G) mean fold change of indicated PDX tumor growth in autologously humanized NSG mice over time in indicated treatment groups (n=5–8 per group), (H) mean levels of indicated cytokines quantified by multiplex Luminex analysis in the sera of PDX1.1 bearing autologously humanized NSG mice sacrificed on day 24 treated in indicated experimental groups (n=3 per group). (I) Immune cell infiltration on day 24 (PDX1) or day 37 (PDX7) into indicated PDX tumors growing in autologously humanized mice in indicated treatment groups measured by FACS (n=6–8 per group), (J) proportion of IFNγ+ cells among indicated subsets of tumor-infiltrating immune cells on day 24 (PDX1) or day 37 (PDX7) into indicated PDX tumors growing in autologously humanized mice in indicated treatment groups measured by intracellular FACS (n=6–7 per group), (K) comparison of injected versus not-injected tumor growth fold change at the end of the experiment in pooled PDX 1.1, PDX 1.2 or PDX 7 tumors (n=12 per group). All error bars show SE, statistical tests used are two tailed, unpaired t-test for (E–H) and two-way ANOVA with significance of the variable ‘group allocation’ reported (I–J). *p<0.05, **p<0.01, ***p<0.001. ANOVA, analysis of variance; PDX, patient-derived xenograft; TRI-IT, tripartite immunotherapy.
Figure 6
Figure 6
TRI-IT shows synergistic treatment effects in an autochthonous genetically engineered lung cancer mouse model. (A) Experimental overview of in vivo experimental workflow, (B) representative µCT images of autochthonous KP lung cancers in indicated treatment groups at indicated times after treatment initiation, (C) mean fold change of autochthonous KP lung cancer lesion growth over time in indicated treatment groups (n=8–29 lesions per group), (D–F) indicated measures of tumor burden at end of experiment measured on H&E-stained coronal cuts through both lungs (n=5–8 mice per group), (G) infiltration of tumors by indicated immune cell subsets at end of experiment measured on IHC of coronal cuts through both lungs (n=4–7 mice per group), (H) immune cell deconvolution analysis showing mean gene expression z-scores of immune cell specific transcripts (n=4–9 mice per group, see the Methods section for details), (I) mean gene expression z-scores of intratumoral cytokines and chemokines (n=4–9 mice per group), (J) mean gene expression z-scores of selected immune checkpoint transcripts (n=4–9 mice per group), (K) mean gene expression z-scores of transcripts representative of a immunogenic cell death signature (n=4–9 mice per group), (L) mean differential gene expression z-score of transcripts representative of a M1/M2 macrophage signature indication M2 to M1 shift (n=4–9 mice per group, see the Methods section for details), (M) heatmap showing most differentially expressed transcripts (aPD1 vs any TRI-IT) (n=4–9 mice per group), (N) gene set enrichment analysis for selected gene sets from any TRI-IT versus aPD1 treated autochthonous KP lung tumors. All error bars show SEM, statistical tests used are a mixed-effects model (C), t-tests between indicated groups (D–I, L) and two-way ANOVA with significance of the variable ‘group allocation’ reported (J–K). *p<0.05, **p<0.01, ***p<0.001, ****p<0.0001. ANOVA, analysis of variance; IHC, immunohistochemistry; ns, not significant; TRI-IT, tripartite immunotherapy.
Figure 7
Figure 7
TRI-IT exhibits no off-target, immune-mediated toxicity. (A) Experimental overview of in vivo experimental workflow, (B) mean relative weight change of mice in indicated groups over time (n=4 per group), (C–E) lung (C), liver (D) or spleen (E) weight in percent of body weight at the end of experiment (day 14) in indicated groups (n=4 per group), Tu: tumor, (F, G) enumeration (F) of CD3+T cells infiltrating the liver per field of view by immunohistochemistry and accompanying representative (G) images (n=3–4 per group), (H, I) enumeration (H) of CD3+T cells infiltrating the lung per field of view by immunohistochemistry and accompanying representative (I) images (n=3–4 per group), (J, K) enumeration (J) of CD3+T cells infiltrating the intestine per 30 villi by immunohistochemistry and accompanying representative (K) images (n=3–4 per group). All error bars show SEM, statistical tests used are two-sided, unpaired t-tests (B–E, F, H and J). ns, not significant; TRI-IT, tripartite immunotherapy.

References

    1. Ferlay J, Colombet M, Soerjomataram I, et al. . Estimating the global cancer incidence and mortality in 2018: GLOBOCAN sources and methods. Int J Cancer 2019;144:1941–53. 10.1002/ijc.31937 - DOI - PubMed
    1. Mellman I, Coukos G, Dranoff G. Cancer immunotherapy comes of age. Nature 2011;480:480–9. 10.1038/nature10673 - DOI - PMC - PubMed
    1. Waldman AD, Fritz JM, Lenardo MJ. A guide to cancer immunotherapy: from T cell basic science to clinical practice. Nat Rev Immunol 2020;20:651–68. 10.1038/s41577-020-0306-5 - DOI - PMC - PubMed
    1. Topalian SL, Hodi FS, Brahmer JR, et al. . Safety, activity, and immune correlates of anti-PD-1 antibody in cancer. N Engl J Med 2012;366:2443–54. 10.1056/NEJMoa1200690 - DOI - PMC - PubMed
    1. Moynihan KD, Irvine DJ. Roles for innate immunity in combination immunotherapies. Cancer Res 2017;77:5215–21. 10.1158/0008-5472.CAN-17-1340 - DOI - PMC - PubMed

Publication types