. 2022 Oct 12;13(1):6023.
doi: 10.1038/s41467-022-33348-z.

Resolving subcellular pH with a quantitative fluorescent lifetime biosensor

Affiliations

Resolving subcellular pH with a quantitative fluorescent lifetime biosensor

Joshua J Rennick et al. Nat Commun. .

Abstract

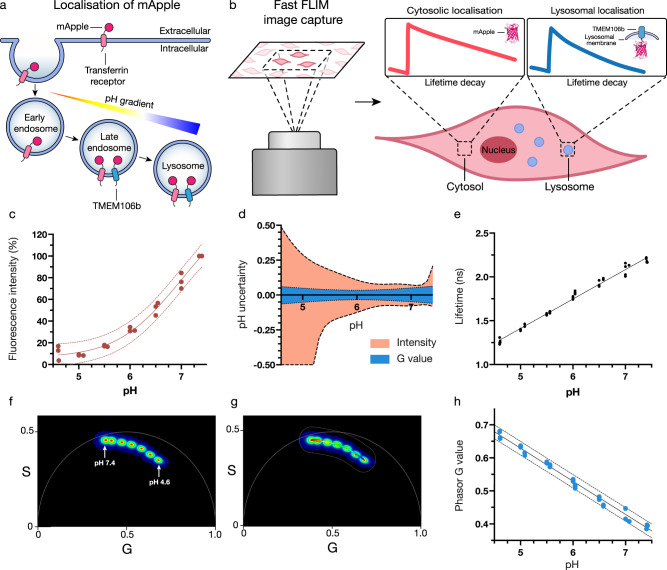
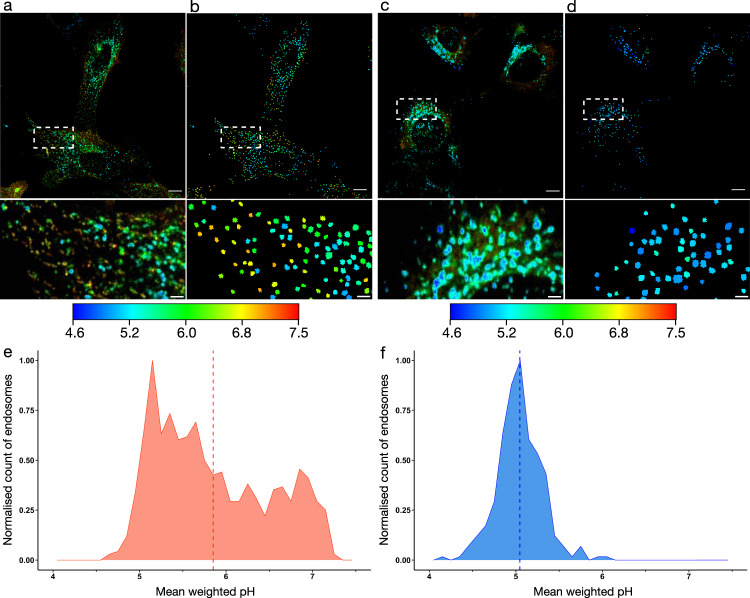
Changes in sub-cellular pH play a key role in metabolism, membrane transport, and triggering cargo release from therapeutic delivery systems. Most methods to measure pH rely on intensity changes of pH sensitive fluorophores, however, these measurements are hampered by high uncertainty in the inferred pH and the need for multiple fluorophores. To address this, here we combine pH dependant fluorescent lifetime imaging microscopy (pHLIM) with deep learning to accurately quantify sub-cellular pH in individual vesicles. We engineer the pH sensitive protein mApple to localise in the cytosol, endosomes, and lysosomes, and demonstrate that pHLIM can rapidly detect pH changes induced by drugs such as bafilomycin A1 and chloroquine. We also demonstrate that polyethylenimine (a common transfection reagent) does not exhibit a proton sponge effect and had no measurable impact on the pH of endocytic vesicles. pHLIM is a simple and quantitative method that will help to understand drug action and disease progression.


Conflict of interest statement

The authors declare no competing interests.

Figures

Fig. 1
Fig. 1. mApple is a genetically encodable biosensor that can quantitatively determine subcellular pH using fast FLIM.
a Schematic of cellular membrane and endocytic vesicles with mApple fused to different transmembrane proteins to achieve targeted cellular localisation. pH gradient indicates increasing acidification as endosomes mature. Not to scale. b Overview of FLIM technique involving confocal microscopy of mApple expressing cells and subsequent analysis indicating the altered mApple fluorescence lifetime in different subcellular pH environments. c mApple fluorescence emission intensity over the calibration range with the least squares fit (solid line) and 95% prediction band (dotted lines). The points shown are the mean value from each of three independent experiments (n = 3). d Uncertainty of interpolated pH as a function of actual pH for intensity or lifetime (G value) measurements, as determined by interpolation of (c), (h). e Calibration of recombinant mApple mean weighted fluorescent lifetime from pH 4.6–7.4 (n = 3). f pH dependence of recombinant mApple fluorescent lifetime visualised on a phasor plot, colour is indicative of the frequency of photons (red = high, blue = low), n = 3. g Equivalent phasor plot (f) with a ‘phasor mask’ applied which creates a pseudo colour scale that can be applied to fast FLIM confocal images (n = 3). h Extracted mean weighted G values from the phasor calibration, with a linear trendline (solid line) and 95% prediction band (dotted lines). The points shown are the mean value from each of three independent experiments (n = 3).
Fig. 2
Fig. 2. Fusing mApple to localisation tags enables the pH of different sub-cellular compartments to be visualised.
ac Confocal images of NIH-3T3 cells expressing cytosolic mApple (a), TfR-mApple (b), and TMEM106b-mApple (c), pseudo-coloured red. d–f Corresponding fast FLIM images of ac pseudo-coloured according to their pH. pH colour scale indicated underneath images. g, h, i Corresponding phasor plots of (d), (e), (f), respectively, with an overlayed phasor mask. Phasor plot colour is indicative of the frequency of photons at that phasor position (red = high, blue = low). Scale bar = 10 µm.
Fig. 3
Fig. 3. Employing an automated deep learning model to detect endo/lysosomal compartments enables quantification of the intracellular pH distribution.
a, c Fluorescence microscopy images of NIH-3T3 cells expressing TfR-mApple (a) or TMEM106b-mApple (c). Images pseudo coloured by a phasor mask (Fig. 1g) according to the colour scale shown. b, d Automated detection of endo/lysosomes in (a), (c), respectively, pseudo coloured according to the indicated colour scale. Colour shown is indicative of the pH of the detected endosome. Zoomed insets are shown below each image. Scale bar = 10 µm, inset scale bar = 2 µm. e, f Histograms of TfR-mApple (e) and TMEM106b-mApple (f) showing the distribution of endo/lysosomal pH from (b), (d), respectively. The pH of each individual endosome is plotted in the histogram with the mean pH of the population shown as a dotted line.
Fig. 4
Fig. 4. mApple pHLIM sensor enables dynamic tracking of intracellular pH in response to treatment with bafilomycin A1.
a, b Time course fluorescence microscopy images of NIH-3T3 cells expressing TMEM106b-mApple treated with a 100 nM BafA1 or b untreated. Images pseudo coloured by a phasor mask (Fig. 1g), pH scale shown on right. c Histograms at the indicated timepoints showing the distribution of pH in endo/lysosomal compartments in a single image. Untreated (blue), BafA1 treated (green). The pH of each individual endosome is plotted in the histogram with the mean pH of the population shown as a dotted line. d Summary plot showing the mean pH of three replicate data sets, untreated (blue squares), BafA1 (green circles), solid line indicates the mean of three independent replicates. Scale bar = 10 µm, two-tailed unpaired student’s t-test was used to analyse each time-point, * denotes p value <0.05 which applies to all timepoints from 15 min onwards. Time = 15 min, p = 0.033. Time = 60 min, p = 0.012 (n = 3).
Fig. 5
Fig. 5. Employing the mApple pHLIM sensor to probe for the purported proton sponge effect of PEI.
a, b Time course FLIM images of NIH-3T3 cells expressing TMEM106b-mApple treated with a 80 µg mL−1 PEI or b untreated. Images pseudo coloured by a phasor mask (Fig. 1g), scale bar = 10 µm. c Histograms of untreated (blue), PEI treated (red) at the indicated timepoints showing the distribution of pH in endo/lysosomal compartments in a single image, with the mean pH shown as a dotted line. d Summary plot of the vesicle pH, untreated (blue squares), PEI (red circles), solid line indicates the mean of three independent replicates (n = 3). e Histograms showing the pH distribution of vesicles in cells treated with pDNA/PEI complexes (2 µg/mL pDNA, 80 µg mL−1 Cy5 labelled PEI) for 6 h. Cy5 signal was used to identify vesicles that contain PEI (red) and vesicles that do not contain PEI (teal). The pH of each individual endosome is plotted in the histogram with the mean pH of the population shown as a dotted line. f Correlation between PEI concentration (Cy5 signal) and vesicle pH for >2500 individual endosomes (from n = 3 experiments) identified to contain PEI (cells treated with pDNA/PEI complexes (2 µg/mL pDNA, 80 µg mL−1 Cy5 labelled PEI) for 6 h).

References

    1. Casey JR, Grinstein S, Orlowski J. Sensors and regulators of intracellular pH. Nat. Rev. Mol. Cell Biol. 2010;11:50–61. doi: 10.1038/nrm2820. - DOI - PubMed
    1. Mindell JA. Lysosomal acidification mechanisms. Annu. Rev. Physiol. 2012;74:69–86. doi: 10.1146/annurev-physiol-012110-142317. - DOI - PubMed
    1. Porcelli AM, et al. pH difference across the outer mitochondrial membrane measured with a green fluorescent protein mutant. Biochem. Biophys. Res. Commun. 2005;326:799–804. doi: 10.1016/j.bbrc.2004.11.105. - DOI - PubMed
    1. Lagadic-Gossmann D, Huc L, Lecureur V. Alterations of intracellular pH homeostasis in apoptosis: origins and roles. Cell Death Differ. 2004;11:953–961. doi: 10.1038/sj.cdd.4401466. - DOI - PubMed
    1. Colacurcio DJ, Nixon RA. Disorders of lysosomal acidification—the emerging role of v-ATPase in aging and neurodegenerative disease. Ageing Res. Rev. 2016;32:75–88. doi: 10.1016/j.arr.2016.05.004. - DOI - PMC - PubMed

Publication types