. 2022 Oct 12;13(10):866.
doi: 10.1038/s41419-022-05309-3.

Lineage-selective super enhancers mediate core regulatory circuitry during adipogenic and osteogenic differentiation of human mesenchymal stem cells

Affiliations

Lineage-selective super enhancers mediate core regulatory circuitry during adipogenic and osteogenic differentiation of human mesenchymal stem cells

Chen Wang et al. Cell Death Dis. .

Abstract

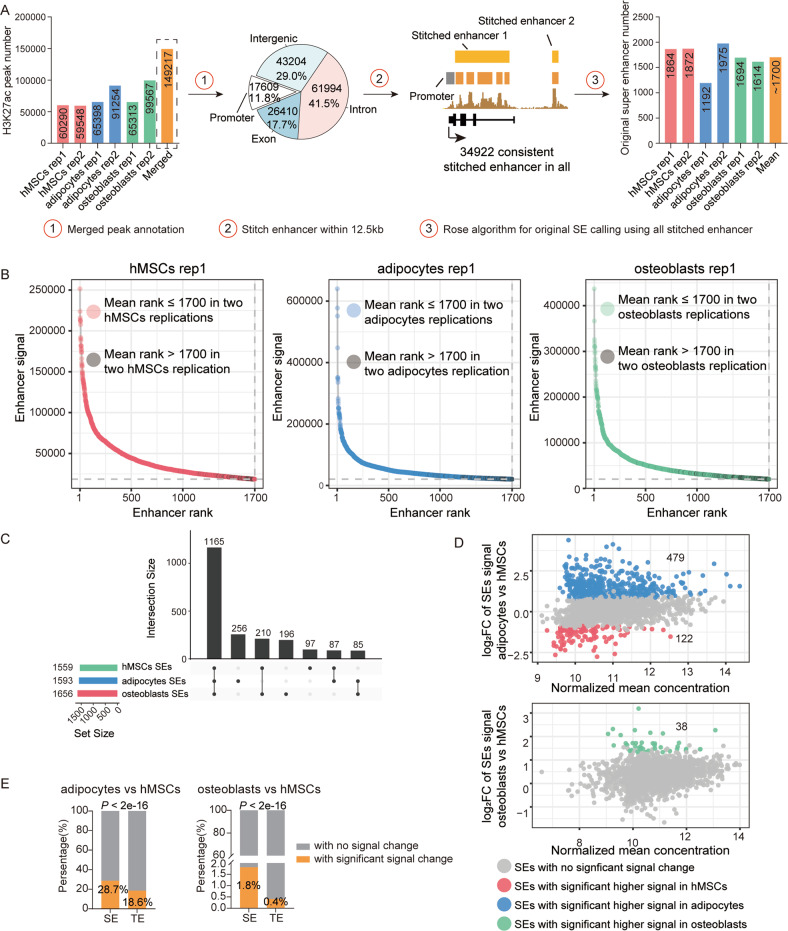
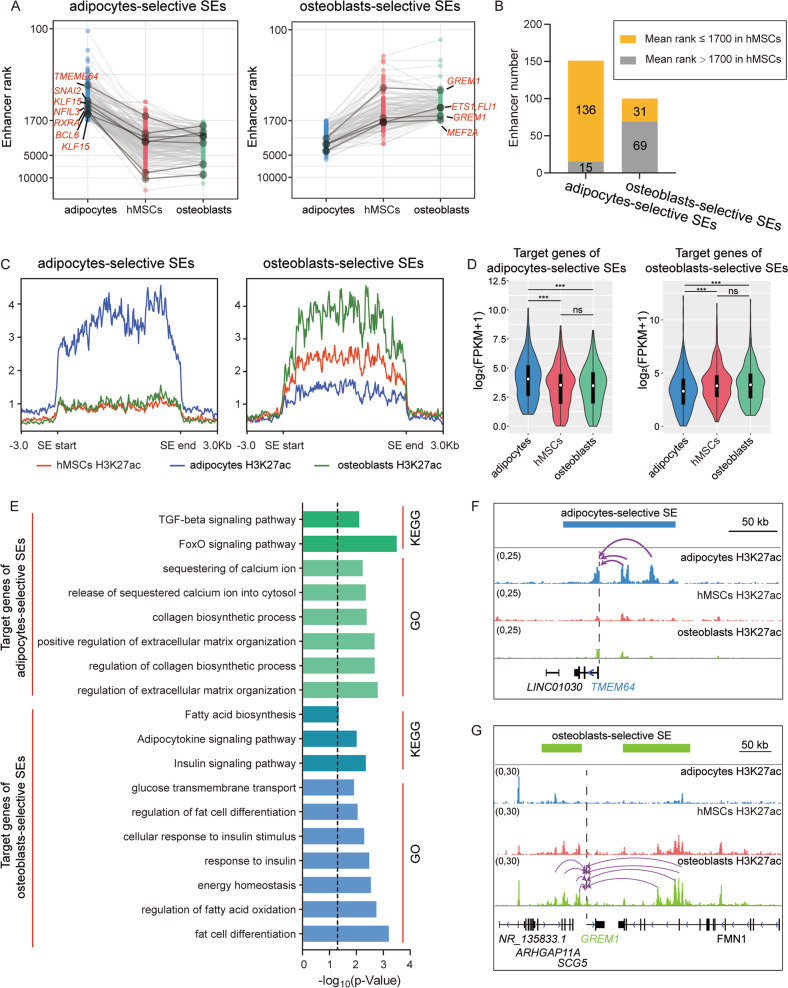
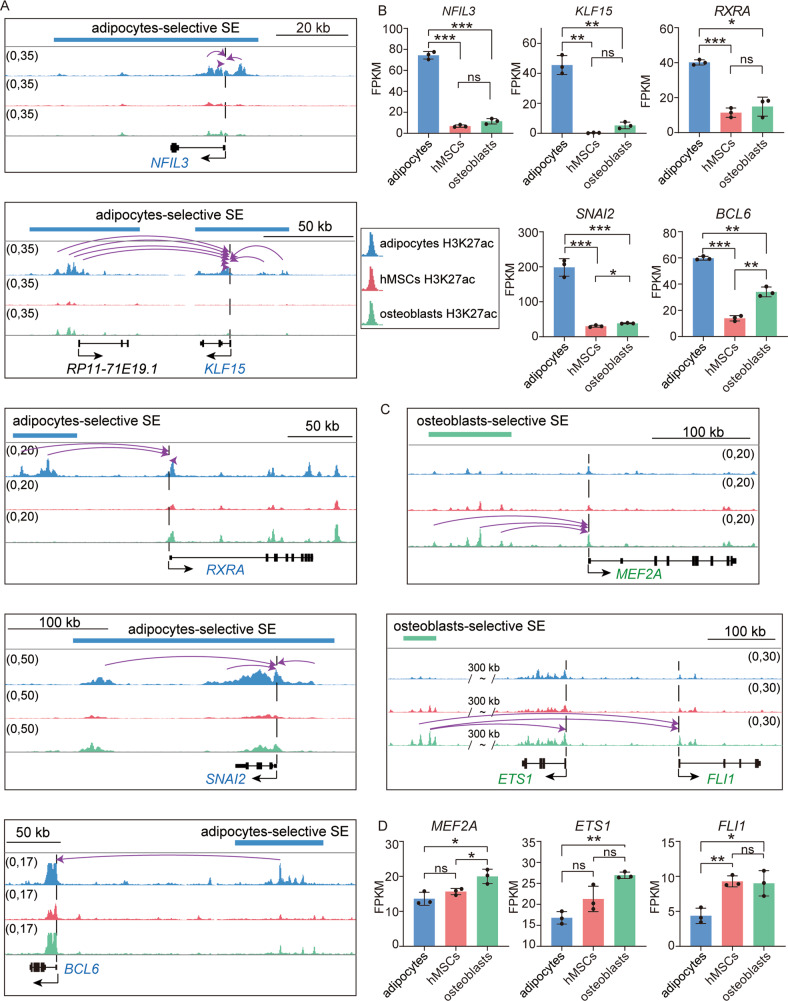
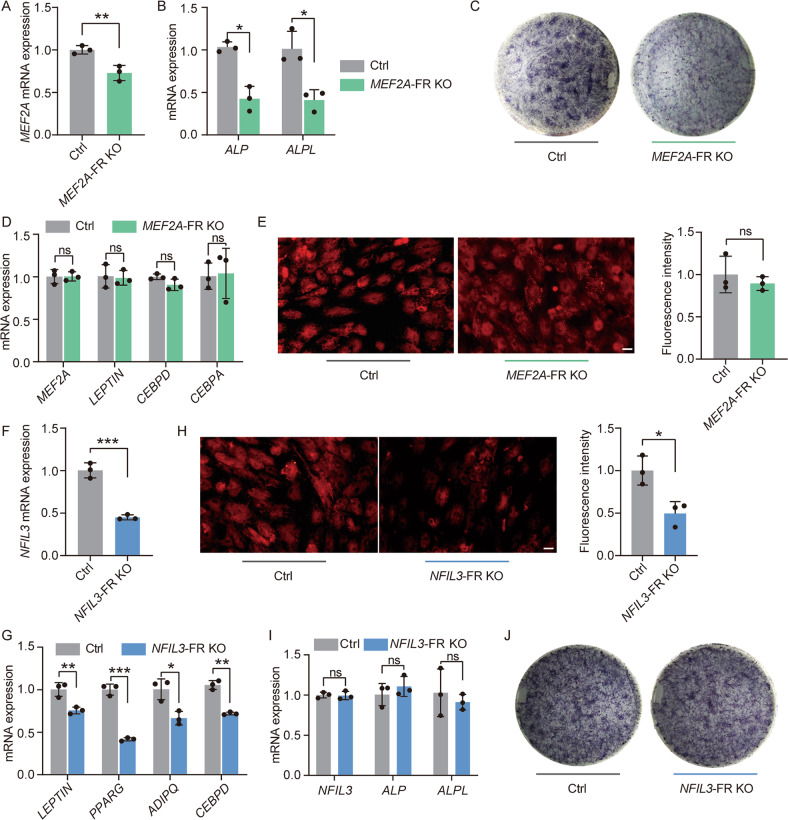
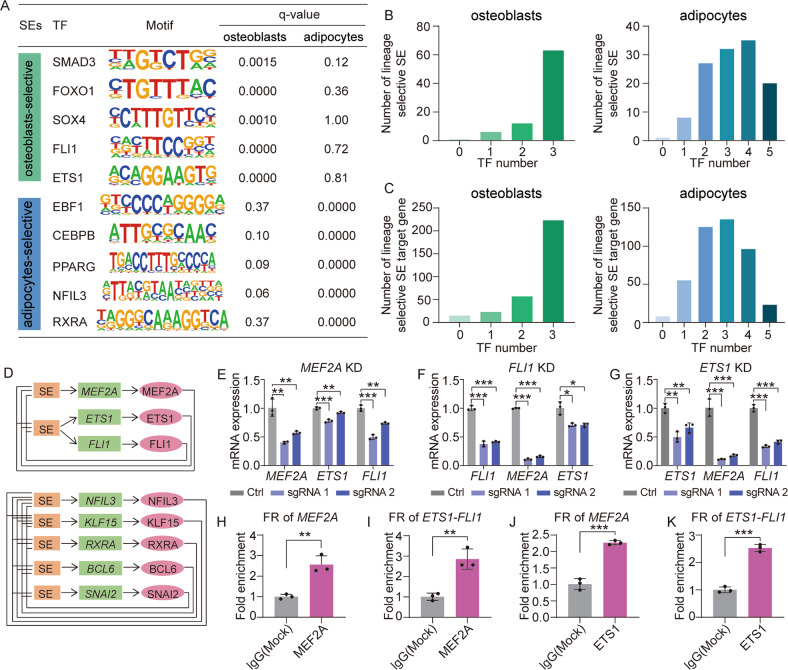
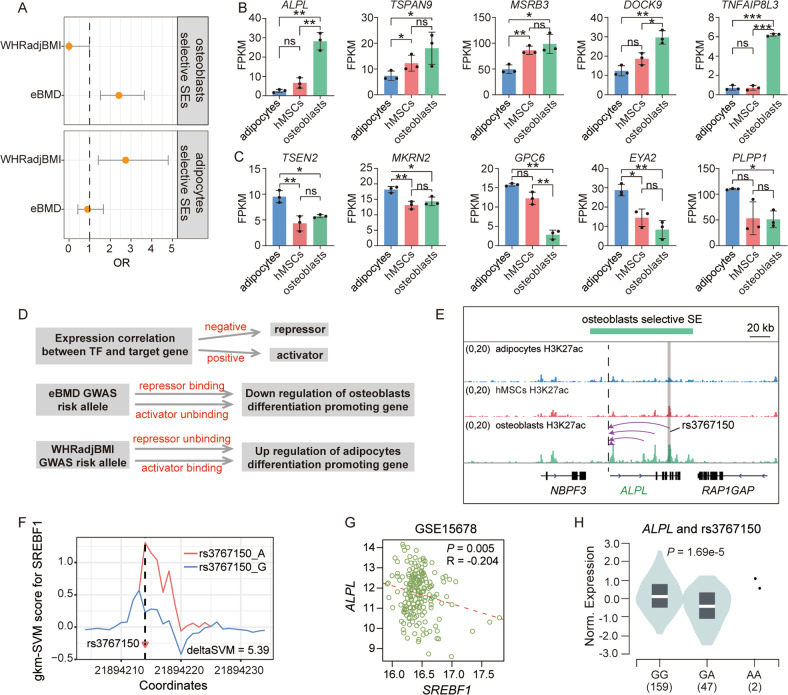
Human mesenchymal stem cells (hMSCs) can be differentiated into osteoblasts and adipocytes. During these processes, super enhancers (SEs) play important roles. Here, we performed comprehensive characterization of the SEs changes associated with adipogenic and osteogenic differentiation of hMSCs, and revealed that SEs changed more dramatically compared with typical enhancers. We identified a set of lineage-selective SEs, whose target genes were enriched with cell type-specific functions. Functional experiments in lineage-selective SEs demonstrated their specific roles in directed differentiation of hMSCs. We also found that some key transcription factors regulated by lineage-selective SEs could form core regulatory circuitry (CRC) to regulate each other's expression and control the hMSCs fate determination. In addition, we found that GWAS SNPs of osteoporosis and obesity were significantly enriched in osteoblasts-selective SEs or adipocytes-selective SEs, respectively. Taken together, our studies unveiled important roles of lineage-selective SEs in hMSCs differentiation into osteoblasts and adipocytes.


Conflict of interest statement

The authors declare no competing interests.

Figures

Fig. 1
Fig. 1. Enhancer change in the process of hMSCs differentiation.
A Pipeline for SEs identification. The H3K27ac peaks from each sample were merged to generate a consistent peak set comprise 149217 peaks. After excluding of 17609 promoter regions, remained enhancers within a genome distance of 12.5 kb were stitched together and resulted in a total of 34922 stitched enhancers. Next, ROSE algorithm was applied to each sample to determine a primary SE number. The mean value of primary number from all samples was used to redefine the SE number for each sample. The enhancers with a mean rank of 1700 or higher (<1700) in each cell type were considered as SEs for this cell type. B Scatter plots display SE signal and rank of hMSCs, adipocytes and osteoblasts from the first replication of differentiation experiment. The intersection points of dashed line corresponding to the cut-off point of SEs and TEs, in X-axis, it corresponding to 1700. Colored points indicate SEs with a mean rank of 1700 or higher (<1700) in two replications, while gray points indicate SEs with a mean rank lower (>1700) in two replications. C Upset plot display the SE number for each cell type and the overlap among three or between two cell types. D Scatter plots display SE signal alteration between differentiated cells and hMSCs: up panel showed the signal alteration of SEs between adipocytes and hMSCs, the lower panel showed the signal alteration of SEs between osteoblasts and hMSCs. Blue dots indicate a significant higher (FDR ≤ 0.1, equivalent to the original P ≤ 0.0228) signal in adipocytes cells, green dots indicate a significant higher signal in osteoblasts, red dots indicate a significant higher signal in hMSCs. E Bar plots display the percentage of enhancers with significant signal change after differentiation into adipogenic and osteogenic lineage.
Fig. 2
Fig. 2. Identification of lineage-selective SEs and functional enrichment of their target.
A Scatter plots show the mean rank of adipocytes- (left panel) and osteoblasts-selective SEs (right panel) in three cell types, the same genome region in three cell types were connected by lines, some examples were marked with dark gray, the target genes of these examples were also showed. B Bar plot shows the counts of lineage-selective SEs which with a signal rank ≤1700 in hMSCs. C The H3K27ac signal profile of lineage-selective SEs in three cell types. All SE regions were extended to a consistent length and the surrounding 3 kb regions were also plotted in figures. D Violin plots show expression of adipocytes-selective SEs (left panel) and osteoblasts-selective SEs (right panel) in three cell types and the statistical difference among them; ***P < 0.001, ns: not significant. E Bar plot of significant enriched (P ≤ 0.05) GO and KEGG terms of genes regulated by adipocytes- or osteoblasts-selective SEs. The dashed line corresponding to the significance threshold. F, G Genome browser plots show examples of adipocytes-selective SE (F) and osteoblasts-selective SE (G) with their targets. Dashed line indicates the position of TSS of target genes. The arc with arrow links the functional region within SEs and TSS of target gene, which was predicted by ABC model.
Fig. 3
Fig. 3. TFs targeted by lineage-selective SEs and the expression.
A Genome browser plots display adipocytes-selective SEs and their target TFs. Dashed line indicates the TSS of gene. The arc with arrow links the TSS and the functional region within SEs that predicted to target it. B Bar plots display mean values ± S.D. of FPKM of TFs regulated by adipocytes-selective SEs from n = 3 replications of three cell types and the statistical difference; *P < 0.05, **P < 0.01, ***P < 0.001, ns: not significant. C Genome browser plots display osteoblasts-selective SEs and their target TFs. Dashed line indicates the TSS of gene. The arc with arrow links the TSS and the functional region with in SEs that predicted to target it. D Bar plots display mean values ± S.D. of FPKM of TFs regulated by osteoblasts-selective SEs from n = 3 replications of three cell types and the statistical difference; *P < 0.05, **P < 0.01, ***P < 0.001, ns: not significant.
Fig. 4
Fig. 4. Functional validation of lineage-selective SEs.
A, B RT-qPCR analysis of gene expression normalized to GAPDH expression level. The results were presented as means ± S.D. *P < 0.05, **P < 0.01. C Representative images show ALP staining in hMSCs with or without knockout the FR of osteoblasts-selective SE that targeting MEF2A. D RT-qPCR analysis of gene expression normalized to ACTIN expression level. ns: not significant. E Representative images show nile red staining in hMSCs after 7 days of adipocytic differentiation with or without knockout the FR of MEF2A osteoblasts-selective SE. Images were captured and fluorescence intensity was quantitated using Image J software. The percentage fluorescence intensity relative to control is shown and expressed as mean ± S.D. (n = 3). Scare bar: 100 μm. ns: not significant. F, G RT-qPCR analysis of gene expression normalized to ACTIN expression level. *P < 0.05, **P < 0.01, ***P < 0.001. H Representative images showed nile red staining in hMSCs after 7 days of adipocytic differentiation with or without the FR of NFIL3 ADI-lineage SE. Images were captured and fluorescence intensity was quantitated using Image J software. The percentage fluorescence intensity relative to control is shown and expressed as mean ± S.D. (n = 3). Scare bar: 100 μm. *P < 0.05. I RT-qPCR analysis of gene expression normalized to GAPDH expression level. ns: not significant. J Representative images show ALP staining in hMSCs with or without knockout the FR of osteoblasts-selective SE that targeting NFIL3.
Fig. 5
Fig. 5. Lineage-selective SEs mediated the formation of CRC.
A Table depicts TFs binding motifs that specifically enriched in functional regions of adipocytes- or osteoblasts-selective SEs and corresponding q-values. B Bar plots display the number of lineage-selective SEs bound by a specific number of TFs. C Bar plots display the number of target genes of lineage-selective SEs regulated by a specific number of TFs. D In silico predicted CRC constituted by TFs regulated by lineage-selective SEs. E–G RT-qPCR analysis of gene expression between control and target gene knockdown cells. GAPDH was used as loading control. *P < 0.05, **P < 0.01, ***P < 0.001. H, I Bar plot of ChIP-qPCR result displays the MEF2A binding efficiency at osteoblasts-selective SEs of MEF2A and ETS1/FLI1. **P < 0.01. J, K Bar plot of ChIP-qPCR result displays the ETS1 binding efficiency at osteoblasts-selective SEs of ETS1/FLI1 and MEF2A. ***P < 0.001.
Fig. 6
Fig. 6. GWAS variants located in lineage-selective SEs.
A Enrichment results of eBMD and WHRadjBMI GWAS variants in the functional regions of two lineage-selective SEs sets. Odds ratios are presented with their 95% CI. Enrichments were calculated using Fisher’s exact test (two-sided). B, C Bar plots display mean values ± S.D. of FPKM and the statistical difference; *P < 0.05, **P < 0.01, ***P < 0.001, ns: not significant. D Schematic diagram displays the mechanism hypothesis through which the GWAS variants function. E Genome browser plot displays a lineage-selective SE in osteoblasts that regulate ALPL. Dashed line indicates the TSS of ALPL. The arc with arrow links the TSS and the functional region within SE that predicted to target it. An eBMD associated GWAS variant, rs3767150 reside in one of the functional regions of this SE. F The 11-mer gkm-SVM scores across rs3767150 for SREBF1. G The expression correlation of SREBF1 and ALPL in osteoblast (GSE15678). H The violin plot displays the expression of ALPL in samples with different genotype of rs3767150 from GTEx liver tissue.

Similar articles

Cited by

References

    1. Peister A, Mellad JA, Larson BL, Hall BM, Gibson LF, Prockop DJ. Adult stem cells from bone marrow (MSCs) isolated from different strains of inbred mice vary in surface epitopes, rates of proliferation, and differentiation potential. Blood. 2004;103:1662–8. doi: 10.1182/blood-2003-09-3070. - DOI - PubMed
    1. Pittenger MF, Mackay AM, Beck SC, Jaiswal RK, Douglas R, Mosca JD, et al. Multilineage potential of adult human mesenchymal stem cells. Science. 1999;284:143–7. doi: 10.1126/science.284.5411.143. - DOI - PubMed
    1. Kassem M, Marie PJ. Senescence-associated intrinsic mechanisms of osteoblast dysfunctions. Aging Cell. 2011;10:191–7. doi: 10.1111/j.1474-9726.2011.00669.x. - DOI - PubMed
    1. Rodríguez JP, Astudillo P, Ríos S, Pino AM. Involvement of adipogenic potential of human bone marrow mesenchymal stem cells (MSCs) in osteoporosis. Curr Stem Cell Res Ther. 2008;3:208–18. doi: 10.2174/157488808785740325. - DOI - PubMed
    1. Qiu W, Andersen TE, Bollerslev J, Mandrup S, Abdallah BM, Kassem M. Patients with high bone mass phenotype exhibit enhanced osteoblast differentiation and inhibition of adipogenesis of human mesenchymal stem cells. J Bone Miner Res. 2007;22:1720–31. doi: 10.1359/jbmr.070721. - DOI - PubMed

Publication types

Substances