. 2022 Oct 12;13(1):6022.
doi: 10.1038/s41467-022-33292-y.

Helheim Glacier ice velocity variability responds to runoff and terminus position change at different timescales

Affiliations

Helheim Glacier ice velocity variability responds to runoff and terminus position change at different timescales

Lizz Ultee et al. Nat Commun. .

Abstract

The Greenland Ice Sheet discharges ice to the ocean through hundreds of outlet glaciers. Recent acceleration of Greenland outlet glaciers has been linked to both oceanic and atmospheric drivers. Here, we leverage temporally dense observations, regional climate model output, and newly developed time series analysis tools to assess the most important forcings causing ice flow variability at one of the largest Greenland outlet glaciers, Helheim Glacier, from 2009 to 2017. We find that ice speed correlates most strongly with catchment-integrated runoff at seasonal to interannual scales, while multi-annual flow variability correlates most strongly with multi-annual terminus variability. The disparate time scales and the influence of subglacial topography on Helheim Glacier's dynamics highlight different regimes that can inform modeling and forecasting of its future. Notably, our results suggest that the recent terminus history observed at Helheim is a response to, rather than the cause of, upstream changes.


Conflict of interest statement

The authors declare no competing interests.

Figures

Fig. 1
Fig. 1. The physical setting of Helheim Glacier studied here.
A Hillshade map of Helheim Glacier subglacial topography from Morlighem et al. with 2009 terminal edge from Joughin et al. in white, points along central flowline in bright colors, and inset map of Helheim Glacier location within Greenland; B Mean ice surface speed as of 2016, with flowline points outlined; C Ice surface speed at two locations (starred on panels A, B) from Joughin et al. (points) and B-spline smooth approximation to each time series (curves); D B-spline continuous velocity functions for each point along the flowline in panel A, with curve color indicating which point is represented; E Catchment-integrated surface mass balance from RACMO; F Catchment-integrated runoff from RACMO; and G Width-averaged terminus position, relative to a fixed gate on the glacier (larger numbers indicate advance). In panels EG, data from the original source is plotted as points, and dark lines show the values of 1d-interpolated functions used to determine signal cross-correlation. In panels C and EG, light curves show the long-term-varying component of each signal. Long-term-varying velocity is shown with a zoomed y axis in Fig. S5.
Fig. 2
Fig. 2. The cross-correlation of largest absolute value (“AMax. xcorr”) (top row) between ice surface speed and each variable (columns), and the lag in days (bottom row) at which that cross-correlation is found.
Circles indicate values that are significant at the 95% confidence level; all values plotted here are significant, in contrast with Fig. S6. For along-flow view, see Fig. S7.
Fig. 3
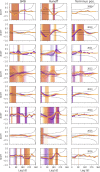
Fig. 3. Annual patterns of cross-correlation between surface speed and system variables for (left) surface mass balance, (center) runoff, and (right) terminus position, sampled at 1 km intervals along the flowline shown in Fig. 1.
Dotted curves indicate 95% confidence intervals around XCorr(f, v) = 0, modified for autocorrelated data as described in Methods section; shading indicates statistically significant difference from zero. Color of lines and shading indicates location of the example point along the flowline, matching Fig. 1A, C, and D.
Fig. 4
Fig. 4. Influence of a subglacial ridge on Helheim Glacier dynamics.
A Ice speed cross-correlation with each variable tested, for each point along the flowline, vertically offset for legibility. Variable labels coincide with zero cross-correlation and minor ticks indicate XCorr(f, v) = ± 0.5. Darker circles are cross-correlations of the full signals (as reported in Fig. 2 and the first Results section). Lighter diamonds show results filtered to isolate long-term variability (as in Results section header “Multi-annual...” and Fig. S6). Results not significantly different from 0 are assigned a cross marker, as in Fig. S6. Lower portion shows bed topography (brown), ice surface (gray), and mean surface speed (purple) along the flowline. Vertical marker indicates position of sign changes in cross-correlation for multiple variables. B Enlarged contour map of the Helheim Glacier trough around the bedrock bump. Outlined points show locations where velocity was extracted along the flowline; a dashed white line across the direction of flow indicates the approximate location of the dashed line in panel A. Background image is a black and white hillshade of the topography as in Fig. 2; contours show intervals of approximately 60 meters elevation. Contour colormap and flowline points (black) are consistent with Fig. 1A.

References

    1. Rignot E, Kanagaratnam P. Changes in the velocity structure of the Greenland Ice Sheet. Science. 2006;311:986–990. doi: 10.1126/science.1121381. - DOI - PubMed
    1. Rignot E, Velicogna I, van den Broeke MR, Monaghan A, Lenaerts JTM. Acceleration of the contribution of the Greenland and Antarctic ice sheets to sea level rise. Geophys. Res. Lett. 2011;38:L05503. doi: 10.1029/2011GL046583. - DOI
    1. Bevan SL, Luckman AJ, Murray T. Glacier dynamics over the last quarter of a century at Helheim, Kangerdlugssuaq and 14 other major Greenland outlet glaciers. Cryosphere. 2012;6:923–937. doi: 10.5194/tc-6-923-2012. - DOI
    1. Murray T, et al. Ocean regulation hypothesis for glacier dynamics in southeast Greenland and implications for ice sheet mass changes. J. Geophys. Res. Earth Surf. 2010;115:F03026. doi: 10.1029/2009JF001522. - DOI
    1. Rignot E, Fenty I, Menemenlis D, Xu Y. Spreading of warm ocean waters around Greenland as a possible cause for glacier acceleration. Ann. Glaciol. 2012;53:257–266. doi: 10.3189/2012AoG60A136. - DOI

Publication types