. 2022 Oct 12;13(10):865.
doi: 10.1038/s41419-022-05303-9.

Mesenchymal stem cells exosomal let-7a-5p improve autophagic flux and alleviate liver injury in acute-on-chronic liver failure by promoting nuclear expression of TFEB

Affiliations

Mesenchymal stem cells exosomal let-7a-5p improve autophagic flux and alleviate liver injury in acute-on-chronic liver failure by promoting nuclear expression of TFEB

Dengna Lin et al. Cell Death Dis. .

Abstract

Acute-on-chronic liver failure is a distinct clinical syndrome characterized by a dysregulated immune response and extensive hepatocyte death without satisfactory therapies. As a cytoplasmic degradative and quality-control process, autophagy was implicated in maintaining intracellular homeostasis, and decreased hepatic autophagy was found in many liver diseases and contributes to disease pathogenesis. Previously, we identified the therapeutic potential of mesenchymal stem cells (MSCs) in ACLF patients; however, the intrinsic mechanisms are incompletely understood. Herein, we showed that MSCs restored the impaired autophagic flux and alleviated liver injuries in ACLF mice, but these effects were abolished when autophago-lysosomal maturation was inhibited by leupeptin (leu), suggesting that MSCs exerted their hepatoprotective function in a pro-autophagic dependent manner. Moreover, we described a connection between transcription factor EB (TFEB) and autophagic activity in this context, as evidenced by increased nuclei translocation of TFEB elicited by MSCs were capable of promoting liver autophagy. Mechanistically, we confirmed that let-7a-5p enriched in MSCs derived exosomes (MSC-Exo) could activate autophagy by targeting MAP4K3 to reduce TFEB phosphorylation, and MAP4K3 knockdown partially attenuates the effect of anti-let-7a-5p oligonucleotide via decreasing the inflammatory response, in addition, inducing autophagy. Altogether, these findings revealed that the hepatoprotective effect of MSCs may partially profit from its exosomal let-7a-5p mediating autophagy repairment, which may provide new insights for the therapeutic target of ACLF treatment.


Conflict of interest statement

The authors declare no competing interests.

Figures

Fig. 1
Fig. 1. MSCs administration alleviates liver injury in ACLF mice.
A Schematic timeline for the generation of ACLF mice by injected intraperitoneally with carbon tetrachloride, MSCs (105 per mouse, resuspended in sterile saline) were infused at the time of acute CCl4 administration. B mRNA levels of IFN-γ, IL-6, TNF-α, IL-1β (normalized to GAPDH) in hepatocytes from normal group (Sham group) and ACLF mice treated with either vehicle buffer or MSCs were measured at 6 h after transfusion by qRT-PCR (n = 6 per group). Data represent mean ± SD, **p < 0.01, one-way ANOVA with Bonferroni’s post analyses. C The Serum transaminases ALT and AST levels were quantified in sham group and ACLF mice treatment with or without MSCs for 6 h (n = 5 except for sham group, n = 4). Data represent mean ± SD, *p < 0.05, **p < 0.01, one-way ANOVA with Bonferroni’s post analyses. D H&E staining of liver tissue from ACLF mice 0, 6, and 24 h after vehicle buffer or MSCs treatment. ×200 magnification, scale bar, 100 µm. Representative images were presented from n = 4 mice per group. E Quantification of the percentage of necrotic area from indicated two groups. Data represent mean ± SD, ns nonsignificant, *p < 0.05, Student’s t-test was performed at individual time periods. F Representative images of TUNEL IF staining showed cell death in liver tissue of ACLF mice treatment with or without MSCs for 6 h. Green, TUNEL-positive; blue, DAPI; ×200 magnification, scale bar, 100 µm. G Quantitative analysis of the percentage of TUNEL-positive cells from indicated two groups (n = 5 per group). Data represent mean ± SD, **p < 0.01, Student’s t-test was performed.
Fig. 2
Fig. 2. MSCs administration repair autophagic flux in ACLF mice.
A, B Immunohistochemical staining for LC3 and P62 in liver sections from ACLF mice treatment with either vehicle buffer or MSCs for 6 h. Representative images were presented from n = 5 mice per group and statistic of IHC staining for LC3 and P62 in liver tissues were quantified in the adjacent panel. ×100 magnification, scale bar, 200 µm. Data represent mean ± SD, **p < 0.01, one-way ANOVA with Bonferroni’s post analyses. C, D Protein levels of LC3 and P62 (normalized to GAPDH) in hepatocytes from ACLF mice treated with either vehicle buffer or MSCs were measured at 3 h and 6 h after transfusion by western blot. Representative images were presented and bar graphs are quantified results of relative gray value in protein bands by Image J (n = 6 per group). Data represent mean ± SD, ns nonsignificant, *p < 0.05, one-way ANOVA with Bonferroni’s post analyses. E, F Transmission electron micrographs of liver sections from ACLF mice treatment with either vehicle buffer or MSCs for 6 h, representative images were presented from n = 4 mice per group and the number of autophagosomes (APs) and autolysosomes (ALs) vacuoles was calculated. ×6000 magnification, scale bar, 2 µm. Yellow arrows: autophagosomes (APs), red arrows: autolysosomes (ALs). *p < 0.05, Student’s t-tests were performed. G, H Leupeptin (Leu) was used to evaluate the autophagic flux, LC3 II protein levels both before and after Leu intervention were measured in hepatocytes of sham group and ACLF mice treated with either vehicle buffer or MSCs at 6 h after transfusion by western blot. Leu (20 mg/kg) was intraperitoneal injected 4 h before sacrifice. Both of LC3 II protein levels before and after Leu intervention were quantified, and the absolute changes (indicating autophagic flux) were calculated and analyzed by one-way ANOVA with Bonferroni’s post analyses (n = 6–7 per group). Data represent mean ± SD, *p < 0.05.
Fig. 3
Fig. 3. Blockade of autophagy-lysosome flux impaired the hepatoprotective effect of MSCs.
A L02 cells treated with different concentration (0–100 µM) of carbon tetrachloride for 0 and 3 h, and then cell viability was detected by cell counting kit-8 (CCK8) assay and time-dependent viability reduction was analyzed by student’s t-test at each concentration point (n = 5 per group). Data represent mean ± SD, ns nonsignificant, *p < 0.05, **p < 0.01. B, C Representative images of TUNEL IF staining showed cell death in control group and 3 h C/I exposed L02 cells with or without MSCs co-culture and quantification of the percentage of TUNEL-positive cells from indicated three groups by one-way ANOVA with Bonferroni’s post analyses (n = 5 per group). Green, TUNEL-positive; blue, DAPI; ×200 magnification, scale bar, 100 µm. Data represent mean ± SD, *p < 0.05. D L02 cells in control group and 3 h C/I exposed L02 cells with or without MSCs co-culture groups were stained with Annexin-V/PI and percentage (%) cell death (Annexin-V+/PI and Annexin V+/PI+ cells) is shown. E, F Representative immunofluorescence images of mCherry-eGFP-LC3 transfected L02 cells in groups of control and 3 h C/I exposed L02 cells with or without MSCs co-culture were visualized by confocal microscopy and the number of eGFP+/mCherry+ (yellow, indicated autophagosomes) and eGFP-/mCherry+ (red) was calculated (n = 5 per group). ×630 magnification, scale bar, 20 µm. Data represent mean ± SD, **p < 0.01, one-way ANOVA with Bonferroni’s post analyses. G Kaplan–Meier survival curves for ACLF mice bearing vehicle buffer or MSCs treatment challenged with or without Leu (n = 10 per group). Data represent mean ± SD, **p < 0.01 (**1 indicated comparison between groups of ACLF mice bearing vehicle buffer or MSCs treatment, **2 indicated comparison between groups of ACLF mice receiving MSCs treatment challenged with or without Leu), Gehan–Breslow–Wilcoxon tests were performed. H, I Representative images of TUNEL IF staining showed cell death in ACLF mice bearing MSCs treatment challenged with or without Leu and quantification of the percentage of TUNEL-positive cells from indicated two groups by Student’s t-test (n = 4 per group). Green, TUNEL-positive; blue, DAPI; ×200 magnification, scale bar, 100 µm. Data represent mean ± SD, *p < 0.05.
Fig. 4
Fig. 4. MSCs regulate autophagic flux via inducing TFEB nuclei translocation.
A, B Nuclear and cytoplasmic TFEB protein levels in hepatocytes of sham group mice or ACLF mice receiving either vehicle buffer or MSCs transplantation for 6 h were measured by western blot. GAPDH and Histone H3 were used as loading controls for cytoplasmic and nuclear fractions, respectively. Representative images were presented and bar graphs are quantified results of relative gray value in protein bands by Image J (n = 4 per group). Data represent mean ± SD, ns nonsignificant, *p < 0.05, one-way ANOVA with Bonferroni’s post analyses. C mRNA levels of LAMP1, TFEB, CTSD, CTSB, MAP1LC3B, BECN1, ATG5, SQSTM1(normalized to GAPDH) in hepatocytes of ACLF mice treated with either vehicle buffer or MSCs were measured at 6 h after transfusion by qRT-PCR (n = 4 per group). Data represent mean ± SD, *p < 0.05, student’s t-test was performed. D, E Immunofluorescent staining of TFEB in control group L02 cells and 3 h C/I exposed L02 cells with or without MSCs co-culture showed the subcellular localization of TFEB, representative images were presented (n = 4 per group) and red channel fluorescence images which indicated TFEB were converted to white and black and listed in the rightmost column for clearer contrasts of different subcellular compartments. Measurement of nuclear TFEB fluorescence intensity was calculated by percentage of total fluorescence. Red, TFEB; blue, DAPI; ×630 magnification, scale bar, 20 µm. Data represent mean ± SD, *p < 0.05, one-way ANOVA with Bonferroni’s post analyses. F, G L02 cells were infected with TFEB shRNA or Ctrl shRNA, and then bearing 3 h C/I with MSCs co-culture. 100 μM leupeptin was added to block lysosomal proteolysis for autophagic flux assay at 4 h before protein extraction. LC3 II protein levels in L02 cells of the above indicated groups both before and after Leu intervention were measured by western blot. Both of LC3 II protein levels before and after Leu intervention were quantified, and the absolute changes indicating autophagic flux (n = 4 per group). Data represent mean ± SD, *p < 0.05. Student’s t-test was performed. H, I Representative immunofluorescence images of mCherry-eGFP-LC3 transfected L02 cells from above two groups indicated in F, G were visualized by confocal microscopy and the number of eGFP + /mCherry + (yellow, indicated autophagosomes) and eGFP-/mCherry + (red) was calculated (n = 4 per group). ×630 magnification, scale bar, 20 µm. Data represent mean ± SD, *p < 0.05, Student’s t-test was performed. J, K Representative images of TUNEL IF staining showed cell death in L02 cells from above two groups and percentage of TUNEL-positive cells were quantified by Student’s t-test (n = 4 per group). Green, TUNEL-positive; blue, DAPI; ×200 magnification, scale bar, 100 µm. Data represent mean ± SD, *p < 0.05. L mRNA levels of IFN-γ, IL-6, TNF-α, IL-1β (normalized to GAPDH) in L02 cells from the above two groups were measured by qRT-PCR (n = 4 per group). Data represent mean ± SD, *p < 0.05, Student’s t-test was performed.
Fig. 5
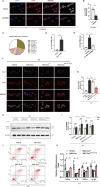
Fig. 5. let-7a-5p in MSCs derived exosomes (MSC-Exo) restore autophagic flux via inducing TFEB nuclei translocation.
A, B MSCs were pretreated with serum-free DMEM containing phospholipase inhibitors GW4869 (20 μM) or vehicle buffer (DMSO 0.1%) for 12 h, and then co-cultured with L02 cells bearing 3-h C/I exposure. Immunofluorescent staining of TFEB in the above indicated two groups showed the subcellular localization of TFEB, representative images were presented (n = 4 per group) and red channel fluorescence images which indicated TFEB were converted to white and black and listed in the rightmost column for clearer contrasts of different subcellular compartments. Measurement of nuclear TFEB fluorescence intensity was calculated by percentage of total fluorescence. Red, TFEB; blue, DAPI; ×630 magnification, scale bar, 20 µm. Data represent mean ± SD, *p < 0.05, one-way ANOVA with Bonferroni’s post analyses. C Pie chart of active individual miRNA in MSC-Exo, percentage of reads mapping to miRNA are shown for the ten most abundant miRNA. D miRNA levels of let-7a-5p (normalized to U6) in hepatocytes of ACLF mice treated with either vehicle buffer or MSCs were measured at 6 h after transfusion by qRT-PCR (n = 4 per group). Data represent mean ± SD, *p < 0.05, student’s t-test was performed. E MSCs were pretreated with GW4869 or vehicle buffer as above, and then co-cultured with L02 cells bearing 3 h C/I exposure, miRNA levels of let-7a-5p (normalized to U6) in L02 cells without MSCs treatment and the above two co-cultured groups were measured by qRT-PCR (n = 4 per group). Data represent mean ± SD, *p < 0.05, one-way ANOVA with Bonferroni’s post analyses. F, G Obtained MSC-Exo were pretreated with let-7a-5p inhibitor (MSC-Exoanti-let-7a-5p) or a negative control oligonucleotide (MSC-Exonc), and then the obtained MSC-Exo, MSC-Exonc, and MSC-Exoanti-let-7a-5p were co-cultured with L02 cells bearing 3 h C/I exposure, immunofluorescence staining for TFEB in L02 cells bearing 3 h C/I exposure alone and the above three co-cultured groups was performed to show the subcellular localization of TFEB, representative images were presented (n = 4 per group) and red channel fluorescence images which indicated TFEB were converted to white and black and listed in the rightmost column for clearer contrasts of different subcellular compartments. Measurement of nuclear TFEB fluorescence intensity was calculated by percentage of total fluorescence. Red, TFEB; blue, DAPI; ×630 magnification, scale bar, 20 µm. Data represent mean ± SD, *p < 0.05, one-way ANOVA with Bonferroni’s post analyses. H, I After L02 cells in the above four groups were incubated with or without leupeptin (Leu) for 4 h, proteins were extracted and LC3 II protein levels both before and after Leu intervention were measured by western blot. Both of LC3 II protein levels before and after Leu intervention were quantified, and the absolute changes indicating autophagic flux (n = 3 per group). Data represent mean ± SD, ns nonsignificant, *p < 0.05. One-way ANOVA with Bonferroni’s post analyses. J L02 cells in the above four groups were stained with Annexin-V/PI and percentage (%) cell death (Annexin-V+/PI and Annexin V+/PI+ cells) is shown. K mRNA levels of IFN-γ, IL-6, TNF-α, IL-1β (normalized to GAPDH) in L02 cells from above four groups were determined by qRT-PCR. (n = 4 per group). Data represent mean ± SD, *p < 0.05, One-way ANOVA with Bonferroni’s post analyses.
Fig. 6
Fig. 6. MSC-Exo let-7a-5p and its target MAP4K3 regulate the phosphorylation and subcellular localization of TFEB.
A, B Protein levels of p-TFEB and TFEB (normalized to GAPDH) in hepatocytes from sham group and ACLF mice treated with either vehicle buffer or MSCs were measured at 6 h after transfusion by western blot. Representative images were presented and bar graphs are quantified results of relative gray value in protein bands by Image J (n = 4 per group). Data represent mean ± SD, ns nonsignificant, *p < 0.05, one-way ANOVA with Bonferroni’s post analyses. C, D Obtained MSC-Exo were pretreated with let-7a-5p inhibitor (MSC-Exoanti-let-7a-5p) or a negative control oligonucleotide (MSC-Exonc), and then co-cultured with L02 cells bearing 3 h C/I exposure, proteins levels of p-TFEB, TFEB, ERK1/2, p-ERK1/2, mTOR, p-mTOR (normalized to GAPDH) in L02 cells of the above two co-cultured groups were measured by western blot. Representative images were presented and bar graphs are quantified results of relative gray value in protein bands by Image J (n = 4 per group). Data represent mean ± SD, ns, nonsignificant, *p < 0.05, student’s test was performed. E Schematic illustration of reporter constructs containing the predicted let-7a-5p binding sites in the 3’ UTR of MAP4K3. F Relative luciferase activity in L02 cells co-transfected with let-7a-5p-mimic and reporter plasmid constructs containing either the WT or mutated 3′-UTR of MAP4K3 (n = 3 per group). Data represent mean ± SD, *p < 0.05, student’s test was performed. G, H L02 cells were infected with MAP4K3 shRNA or Ctrl shRNA, and then bearing 3 h C/I with MSC-Exoanti-let-7a-5p co-culture. Immunofluorescence staining for TFEB in L02 cells of above two groups was performed to show the subcellular localization of TFEB, representative images were presented (n = 4 per group) and red channel fluorescence images which indicated TFEB were converted to white and black and listed in the rightmost column for clearer contrasts of different subcellular compartments. Measurement of nuclear TFEB fluorescence intensity was calculated by percentage of total fluorescence. Red, TFEB; blue, DAPI; ×630 magnification, scale bar, 20 µm. Data represent mean ± SD, *p < 0.05, one-way ANOVA with Bonferroni’s post analyses. I, J Protein levels of p-TFEB and TFEB (normalized to GAPDH) in L02 cells of above two groups were measured by western blot. Representative images were presented and bar graphs are quantified results of relative gray value in protein bands by Image J (n = 4 per group). Data represent mean ± SD, ns, *p < 0.05, student’s t-test was performed. K, L 100 μM leupeptin was added to block lysosomal proteolysis for autophagic flux assay at 4 h before protein extraction. LC3 II protein levels in L02 cells of the above two groups both before and after Leu intervention were measured by western blot. Both of LC3 II protein levels before and after Leu intervention were quantified, and the absolute changes indicating autophagic flux (n = 4 per group). Data represent mean ± SD, *p < 0.05. Student’s t-test was performed.
Fig. 7
Fig. 7. Possible mechanism underlying interaction between MSCs and autophagic flux in ACLF.
the pro-autophagic effects of MSCs were partly benefit from its exosomal let-7a-5p targeting MAP4K3, which induce TFEB dephosphorylation and nuclear localization in hepatocytes of ACLF, therefore increasing the transcriptional activity of lysosomal or autophagy-related gene.

Similar articles

Cited by

References

    1. Bernal W, Jalan R, Quaglia A, Simpson K, Wendon J, Burroughs A. Acute-on-chronic liver failure. Lancet. 2015;386:1576–87. doi: 10.1016/S0140-6736(15)00309-8. - DOI - PubMed
    1. Sarin SK, Choudhury A, Sharma MK, Maiwall R, Al Mahtab M, Rahman S, et al. Acute-on-chronic liver failure: consensus recommendations of the Asian Pacific association for the study of the liver (APASL): an update. Hepatol Int. 2019;13:353–90. doi: 10.1007/s12072-019-09946-3. - DOI - PMC - PubMed
    1. Lin B, Pan CQ, Xie D, Xie J, Xie S, Zhang X, et al. Entecavir improves the outcome of acute-on-chronic liver failure due to the acute exacerbation of chronic hepatitis B. Hepatol Int. 2013;7:460–7. doi: 10.1007/s12072-012-9415-y. - DOI - PubMed
    1. Stutchfield BM, Simpson K, Wigmore SJ. Systematic review and meta-analysis of survival following extracorporeal liver support. Br J Surg. 2011;98:623–31. doi: 10.1002/bjs.7418. - DOI - PubMed
    1. Hernaez R, Solà E, Moreau R, Ginès P. Acute-on-chronic liver failure: an update. Gut. 2017;66:541–53. doi: 10.1136/gutjnl-2016-312670. - DOI - PMC - PubMed

Publication types

MeSH terms