

Review
doi: 10.1038/s41467-022-33536-x.
A consensus statement on detection of hippocampal sharp wave ripples and differentiation from other fast oscillations
Affiliations
- PMID: 36224194
- PMCID: PMC9556539
- DOI: 10.1038/s41467-022-33536-x
Item in Clipboard
Review
A consensus statement on detection of hippocampal sharp wave ripples and differentiation from other fast oscillations
Nat Commun.
.
Abstract
Decades of rodent research have established the role of hippocampal sharp wave ripples (SPW-Rs) in consolidating and guiding experience. More recently, intracranial recordings in humans have suggested their role in episodic and semantic memory. Yet, common standards for recording, detection, and reporting do not exist. Here, we outline the methodological challenges involved in detecting ripple events and offer practical recommendations to improve separation from other high-frequency oscillations. We argue that shared experimental, detection, and reporting standards will provide a solid foundation for future translational discovery.
© 2022. The Author(s).
Conflict of interest statement
The authors declare no competing interests.
Figures
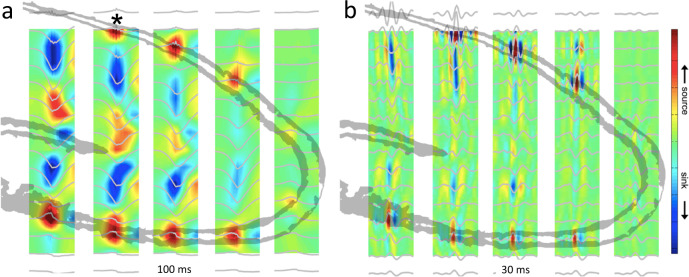
a Recording with a 6-shank, 96-site linear silicon probe spanning hippocampal regions and layers in a rat (5-shanks are shown, each with 16 sites with 100 µm vertical separation). Average current source density (CSD, color) maps and superimposed LFP traces of SPW-R events (100 ms, gray) from all recording sites. Asterisk indicates reference site. Note negative sharp waves and sinks (blue) in the stratum radiatum of CA1 and CA3 and the inner molecular layer of the dentate gyrus. b Same as in (a) but the maps were constructed from the filtered signal (50–250 Hz; 30 ms long traces). Red, source; blue, sink. Reproduced from ref. , CC BY-NC-SA 3.0 (https://creativecommons.org/licenses/by-nc-sa/3.0/ ).
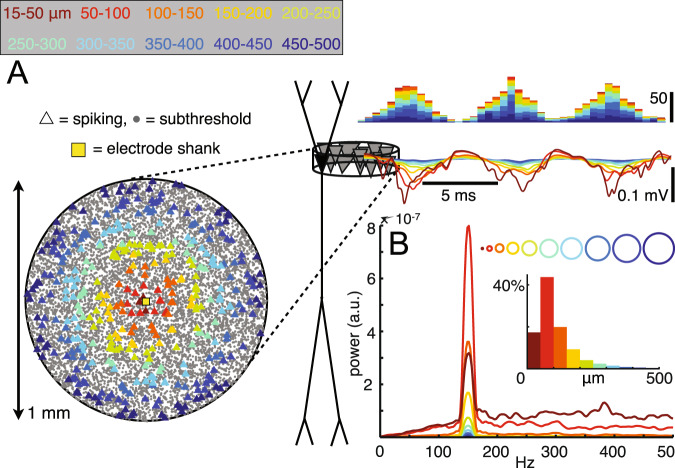
A Histograms of extracellular spikes (top right) extracellular voltages along the CA1 stratum oriens–stratum radiatum axis in a rhythmically bursting population with ~6% of the population firing in each 10 ms interval. Spike bursts recur periodically at 150 Hz and have a Gaussian shape. The locations of neurons that spike during one 6.7 ms ripple period are indicated by triangles in a top-down view of the pyramidal layer (left), with colors indicating the 50µm-wide ring from which the spikes originate. Voltage traces are colored correspondingly, with contributions from each ring of cells adding cumulatively from the outside in. The colors in the histograms and current traces correspond to the cumulative contribution of the neurons in the ring. B Averaged power spectra of the CA1 stratum pyramidale traces from each individual ring. The insets indicate the proportions of the total voltage power at 150 Hz generated by each ring- or disk-shaped subpopulation (i.e., the peak values of the power spectra, normalized by the power at 150 Hz in the full population). Reproduced from ref. , CC BY-NC-SA 3.0 (https://creativecommons.org/licenses/by-nc-sa/3.0/ ).
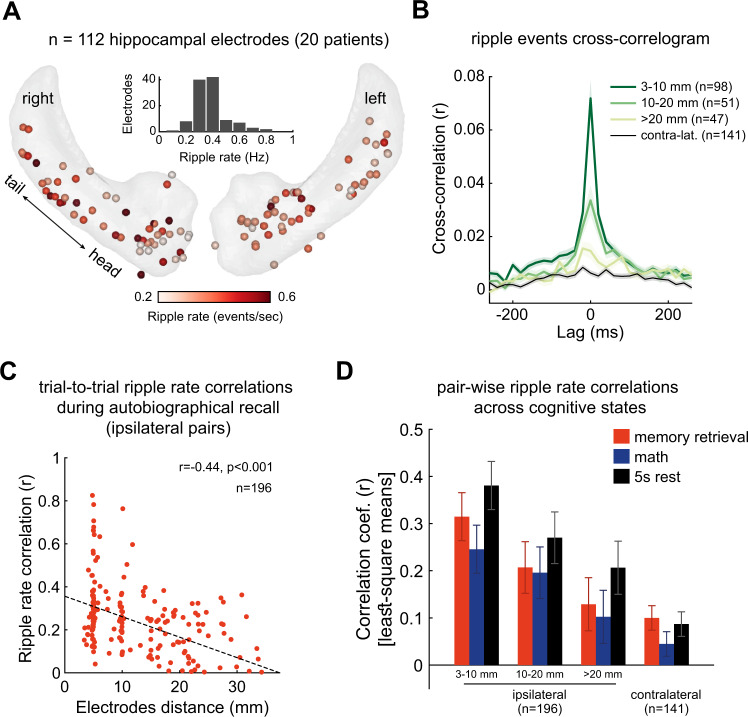
A SPW-R rates computed throughout the entire task (20 patients). Inset: distribution of SPW-R rates across electrodes. B Coincident activation of SPW-Rs as a function of electrode (0.86 mm in diameter) distance (intercontact distance = 4–5 mm). C Trial-to-trail correlation between SPW-R rates during memory retrieval trials. D Correlation coefficients between the contralateral sites were much weaker than across electrode pairs in the same hippocampus/subiculum. Reproduced from ref. with permission, Elsevier.
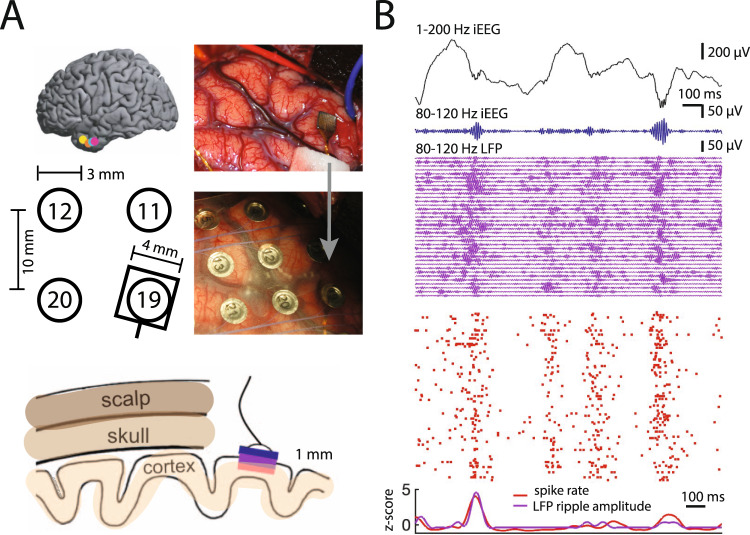
A Locations of the microelectrode arrays with respect to four nearby iEEG channels in one participant (bottom left). Right, Intraoperative photo of implanted array in the anterior temporal lobe before and after placement of an iEEG grid over the it. Bottom, Schematic of scalp, skull and cortex with respect to one iEEG channel on the cortical surface and one array in cortex. B 1500 ms window of 1–200 Hz iEEG signal (black), 80–120 Hz band iEEG signal (blue), 80–120 Hz band LFP signals across all MEA electrodes (purple), and raster plot for sorted units (red). Reprinted from ref. .
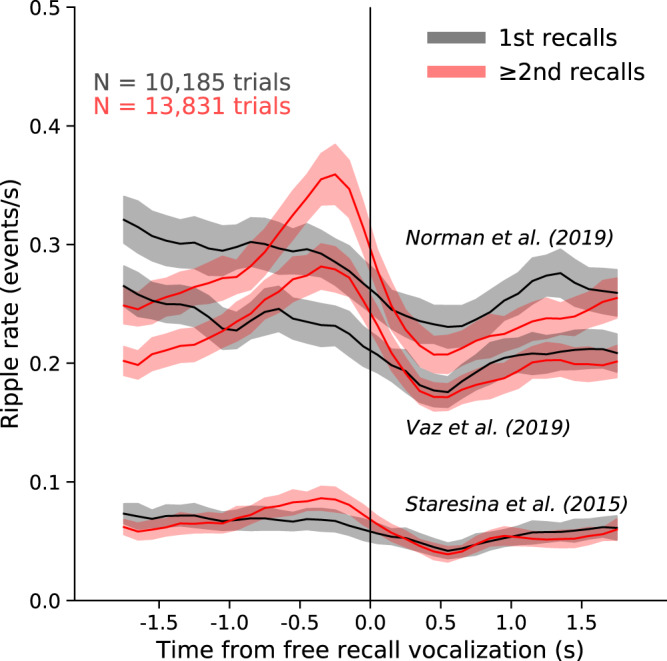
Human intracranial hippocampal CA1 recordings were taken while patients (n = 96) performed a free recall task from a 12-word list (from ref. 109). Recalls were split into the first recall and the remaining (≥2nd) recalls from each list. Ripples were detected using three different published methods (refs. 34, 36, 111) and peri-vocalization time histograms were averaged across trials pooled for all patients using 100 ms bins and a 5-point triangle smooth. While the rise in ripples before recall vocalization for ≥2nd recalls compared to 1st recalls is statistically different for all three detectors, the detected ripple rates vary several-fold depending on the detection method. Figure courtesy of John Sakon.
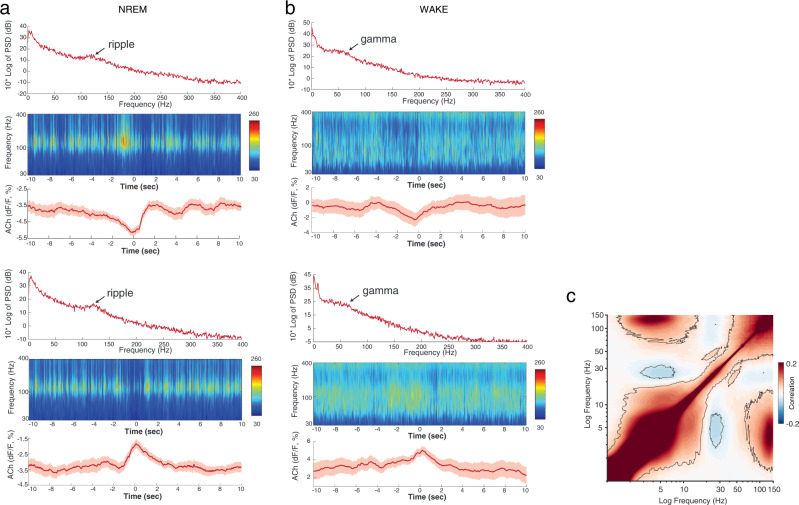
a Power spectrum (0–400 Hz) and time-resolved power spectrum (40–400 Hz) of the LFP recorded from the CA1 pyramidal layer of a mouse, centered at the natural fluctuations of Ach levels (troughs and peaks, respectively). b Same as in b but during waking. Note the absence of ripples (>100 Hz) during Ach peaks, whereas highest gamma power (40–120 Hz) is present at the highest levels of Ach release. Note also the different calibration of the power panels and averaged Ach signal. Based on >50 average epochs. c Average cross-frequency power comodulogram of the LFP from the CA1 pyramidal layer in a macaque. Note the inverse correlation between ripple and beta/gamma (20–80 Hz) frequency bands. a, b Reproduced from ref. , and c reproduced from ref. , CC BY-ND 4.0 (https://creativecommons.org/licenses/by-nd/4.0/ ).
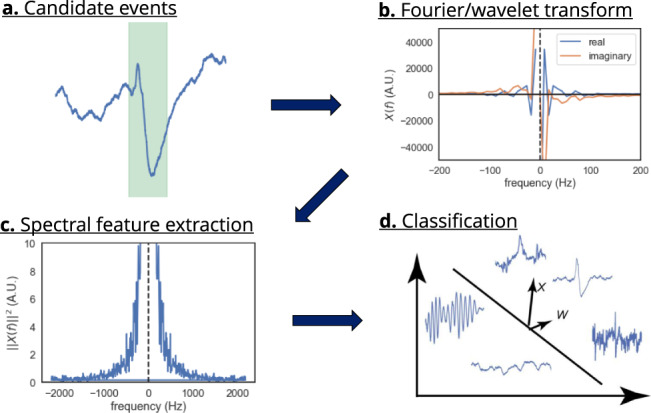
a The recording is segmented into (possibly overlapping) snippets short enough to contain at most one event. b Fourier transform of the event. c Spectral features extracted from Fourier/wavelet transform, followed by postprocessing steps. d Clustering is performed on the resulting features. Figure courtesy of Zhenrui Liao.
Similar articles
-
Short-Term Memory Impairment.2024 Jun 8. In: StatPearls [Internet]. Treasure Island (FL): StatPearls Publishing; 2025 Jan–. 2024 Jun 8. In: StatPearls [Internet]. Treasure Island (FL): StatPearls Publishing; 2025 Jan–. PMID: 31424720 Free Books & Documents.
-
Brain temperature affects quantitative features of hippocampal sharp wave ripples.J Neurophysiol. 2022 May 1;127(5):1417-1425. doi: 10.1152/jn.00047.2022. Epub 2022 Apr 7. J Neurophysiol. 2022. PMID: 35389772 Free PMC article.
-
Brain-wide interactions during hippocampal sharp wave ripples.Proc Natl Acad Sci U S A. 2022 May 17;119(20):e2200931119. doi: 10.1073/pnas.2200931119. Epub 2022 May 13. Proc Natl Acad Sci U S A. 2022. PMID: 35561219 Free PMC article.
-
Consolidated standards of reporting trials (CONSORT) and the completeness of reporting of randomised controlled trials (RCTs) published in medical journals.Cochrane Database Syst Rev. 2012 Nov 14;11(11):MR000030. doi: 10.1002/14651858.MR000030.pub2. Cochrane Database Syst Rev. 2012. PMID: 23152285 Free PMC article.
-
Consensus on Recording Deep Endometriosis Surgery: the CORDES statement.Hum Reprod. 2016 Jun;31(6):1219-23. doi: 10.1093/humrep/dew067. Epub 2016 Apr 19. Hum Reprod. 2016. PMID: 27094477
Cited by
-
Hippocampal sharp-wave ripples correlate with periods of naturally occurring self-generated thoughts in humans.Nat Commun. 2024 May 22;15(1):4078. doi: 10.1038/s41467-024-48367-1. Nat Commun. 2024. PMID: 38778048 Free PMC article.
-
Spike Ripples: Hidden Clues to the Mystery of the Epileptogenic Zone.Epilepsy Curr. 2025 Jan 6;25(2):101-103. doi: 10.1177/15357597241306610. eCollection 2025 Mar-Apr. Epilepsy Curr. 2025. PMID: 39780979 Free PMC article. No abstract available.
-
Physical activity simultaneously improves working memory and ripple-spindle coupling.Commun Biol. 2025 Aug 8;8(1):1187. doi: 10.1038/s42003-025-08618-3. Commun Biol. 2025. PMID: 40781358 Free PMC article.
-
Extracting electromyographic signals from multi-channel LFPs using independent component analysis without direct muscular recording.Cell Rep Methods. 2023 May 17;3(6):100482. doi: 10.1016/j.crmeth.2023.100482. eCollection 2023 Jun 26. Cell Rep Methods. 2023. PMID: 37426755 Free PMC article.
-
Delta oscillation coupled propagating fast ripples precede epileptiform discharges in patients with focal epilepsy.Neurobiol Dis. 2022 Dec;175:105928. doi: 10.1016/j.nbd.2022.105928. Epub 2022 Nov 17. Neurobiol Dis. 2022. PMID: 36403895 Free PMC article.
References
Publication types
MeSH terms
Grants and funding
- RF1 NS127128/NS/NINDS NIH HHS/United States
- RF1 NS121764/NS/NINDS NIH HHS/United States
- RM1 NS132981/NS/NINDS NIH HHS/United States
- R01 MH117777/MH/NIMH NIH HHS/United States
- HHMI/Howard Hughes Medical Institute/United States
- R01 NS121764/NS/NINDS NIH HHS/United States
- R16 NS131108/NS/NINDS NIH HHS/United States
- U01 NS113198/NS/NINDS NIH HHS/United States
- K23 NS104252/NS/NINDS NIH HHS/United States
- U19 NS104590/NS/NINDS NIH HHS/United States
- F31 NS120783/NS/NINDS NIH HHS/United States
- R01 NS106611/NS/NINDS NIH HHS/United States
- R01 MH122391/MH/NIMH NIH HHS/United States
- U19 NS107609/NS/NINDS NIH HHS/United States
- F30 MH126483/MH/NIMH NIH HHS/United States
