

Structural insight into the bulge-containing KRAS oncogene promoter G-quadruplex bound to berberine and coptisine
- PMID: 36224201
- PMCID: PMC9556435
- DOI: 10.1038/s41467-022-33761-4
Structural insight into the bulge-containing KRAS oncogene promoter G-quadruplex bound to berberine and coptisine
Abstract
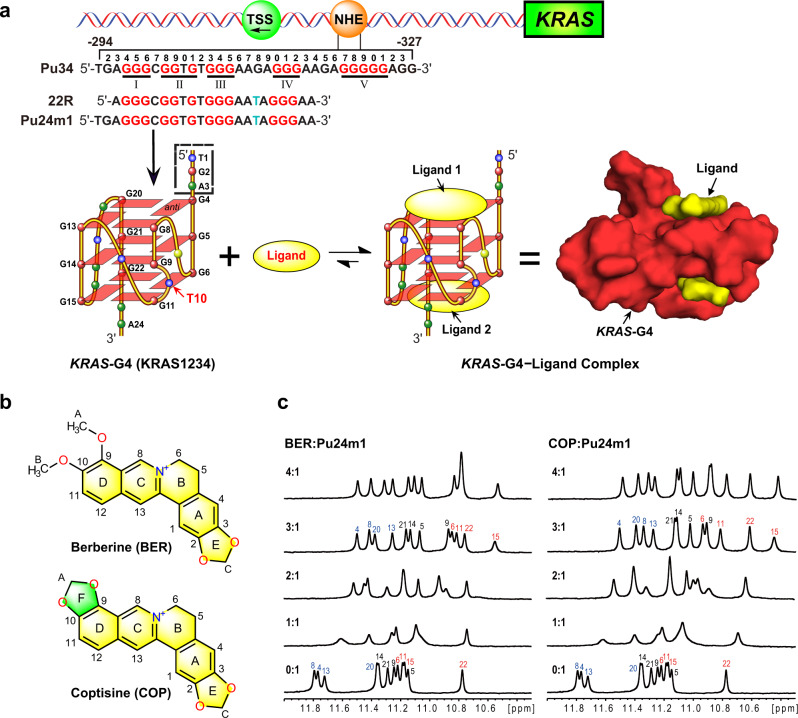
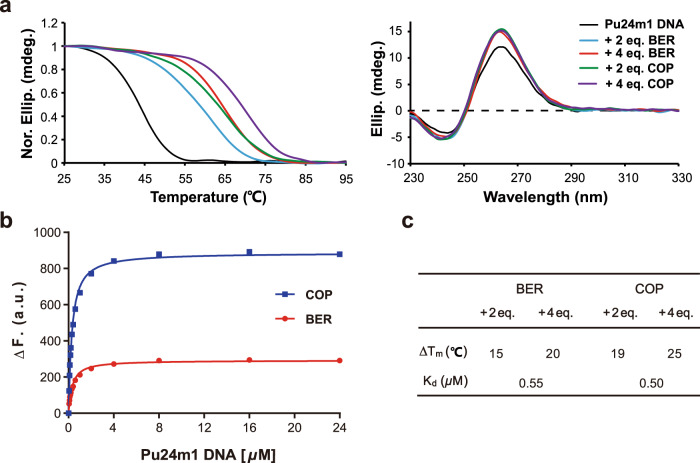
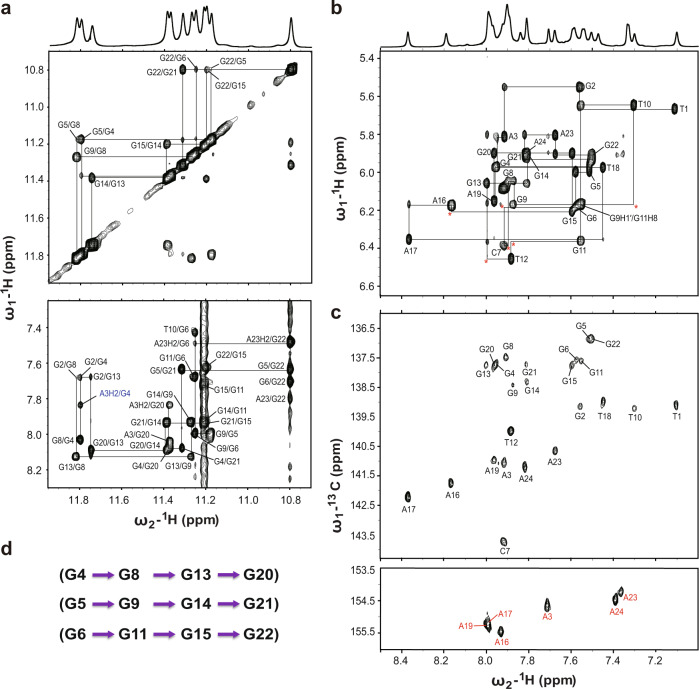
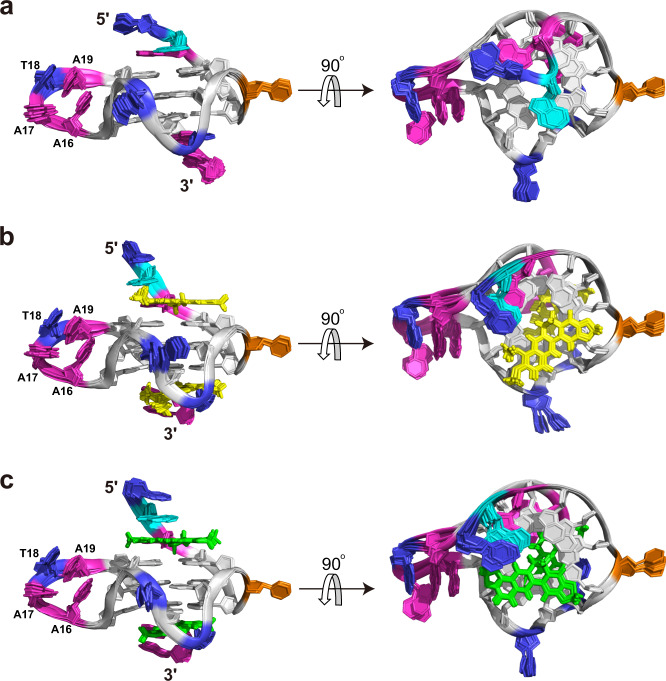
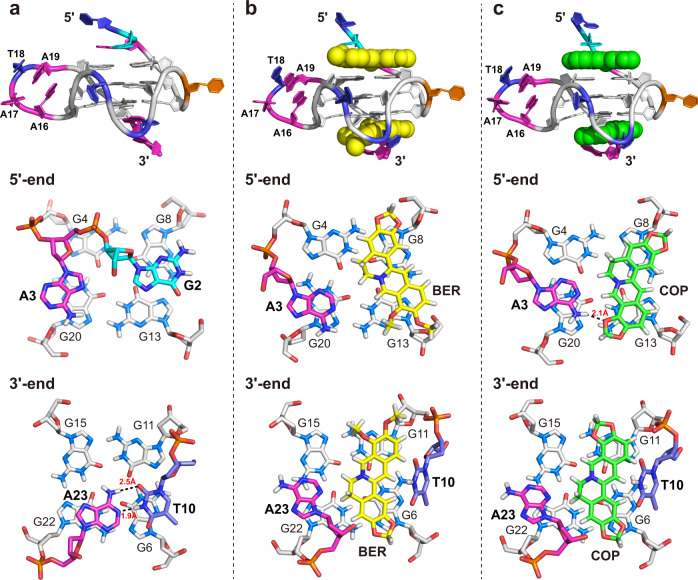
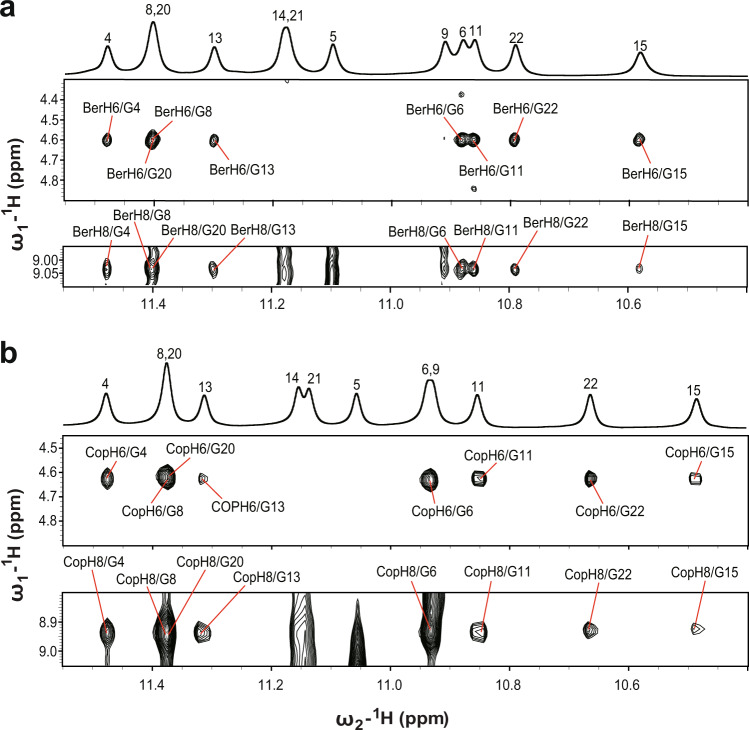
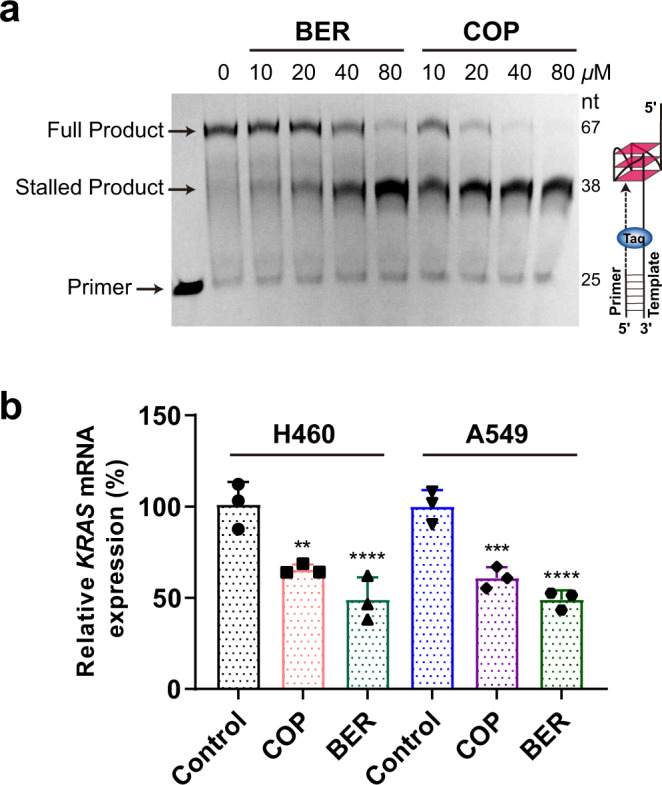
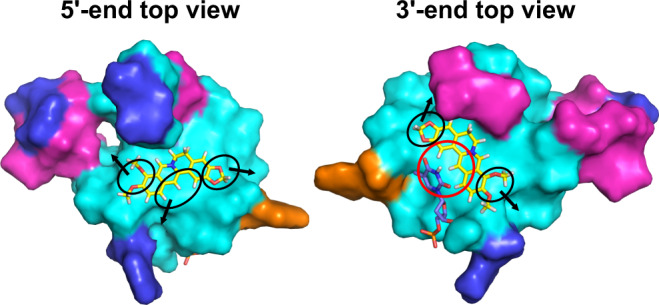
KRAS is one of the most highly mutated oncoproteins, which is overexpressed in various human cancers and implicated in poor survival. The G-quadruplex formed in KRAS oncogene promoter (KRAS-G4) is a transcriptional modulator and amenable to small molecule targeting. However, no available KRAS-G4-ligand complex structure has yet been determined, which seriously hinders the structure-based rational design of KRAS-G4 targeting drugs. In this study, we report the NMR solution structures of a bulge-containing KRAS-G4 bound to berberine and coptisine, respectively. The determined complex structure shows a 2:1 binding stoichiometry with each compound recruiting the adjacent flacking adenine residue to form a "quasi-triad plane" that stacks over the two external G-tetrads. The binding involves both π-stacking and electrostatic interactions. Moreover, berberine and coptisine significantly lowered the KRAS mRNA levels in cancer cells. Our study thus provides molecular details of ligand interactions with KRAS-G4 and is beneficial for the design of specific KRAS-G4-interactive drugs.
© 2022. The Author(s).
Conflict of interest statement
The authors declare no Competing interests.
Figures
Similar articles
-
High resolution crystal structure of a KRAS promoter G-quadruplex reveals a dimer with extensive poly-A π-stacking interactions for small-molecule recognition.Nucleic Acids Res. 2020 Jun 4;48(10):5766-5776. doi: 10.1093/nar/gkaa262. Nucleic Acids Res. 2020. PMID: 32313953 Free PMC article.
-
Solution Structure of Ternary Complex of Berberine Bound to a dGMP-Fill-In Vacancy G-Quadruplex Formed in the PDGFR-β Promoter.J Am Chem Soc. 2021 Oct 13;143(40):16549-16555. doi: 10.1021/jacs.1c06200. Epub 2021 Sep 29. J Am Chem Soc. 2021. PMID: 34586799 Free PMC article.
-
High-resolution three-dimensional NMR structure of the KRAS proto-oncogene promoter reveals key features of a G-quadruplex involved in transcriptional regulation.J Biol Chem. 2017 May 12;292(19):8082-8091. doi: 10.1074/jbc.M117.781906. Epub 2017 Mar 22. J Biol Chem. 2017. PMID: 28330874 Free PMC article.
-
Critical role of hnRNP A1 in activating KRAS transcription in pancreatic cancer cells: A molecular mechanism involving G4 DNA.Biochim Biophys Acta Gen Subj. 2017 May;1861(5 Pt B):1389-1398. doi: 10.1016/j.bbagen.2016.11.031. Epub 2016 Nov 22. Biochim Biophys Acta Gen Subj. 2017. PMID: 27888145 Review.
-
G4 DNA in ras genes and its potential in cancer therapy.Biochim Biophys Acta. 2016 Apr;1859(4):663-74. doi: 10.1016/j.bbagrm.2016.02.002. Epub 2016 Feb 4. Biochim Biophys Acta. 2016. PMID: 26855080 Review.
Cited by
-
Pharmacological properties and therapeutic potential of berberine: a comprehensive review.Front Pharmacol. 2025 Aug 14;16:1604071. doi: 10.3389/fphar.2025.1604071. eCollection 2025. Front Pharmacol. 2025. PMID: 40894216 Free PMC article. Review.
-
Perspectives on NcRNAs in HBV/cccDNA-driven HCC progression.Cancer Cell Int. 2025 Jun 21;25(1):224. doi: 10.1186/s12935-025-03849-0. Cancer Cell Int. 2025. PMID: 40544269 Free PMC article. Review.
-
Antitumor activity of triazine mimic antibiotics for DNA-binding implications (impressive activity in vitro against a variety of tumor types in the NCI-60 screen): NSC 710607 to fight HCT-116 human colon carcinoma cell lines in vivo using the hollow fiber assay and xenograft mouse models.J Cancer Res Clin Oncol. 2023 Aug;149(9):6501-6511. doi: 10.1007/s00432-023-04604-6. Epub 2023 Feb 13. J Cancer Res Clin Oncol. 2023. PMID: 36780052 Free PMC article.
-
Recent Progress and Potential of G4 Ligands in Cancer Immunotherapy.Molecules. 2025 Apr 17;30(8):1805. doi: 10.3390/molecules30081805. Molecules. 2025. PMID: 40333779 Free PMC article. Review.
-
DNA G-Quadruplexes as Targets for Natural Product Drug Discovery.Engineering (Beijing). 2024 Jul;38:39-51. doi: 10.1016/j.eng.2024.03.015. Epub 2024 May 6. Engineering (Beijing). 2024. PMID: 40809342 Free PMC article.
References
Publication types
MeSH terms
Substances
LinkOut - more resources
Full Text Sources
Research Materials
Miscellaneous
