

Network analysis to identify symptoms clusters and temporal interconnections in oncology patients
- PMID: 36224203
- PMCID: PMC9556713
- DOI: 10.1038/s41598-022-21140-4
Network analysis to identify symptoms clusters and temporal interconnections in oncology patients
Abstract
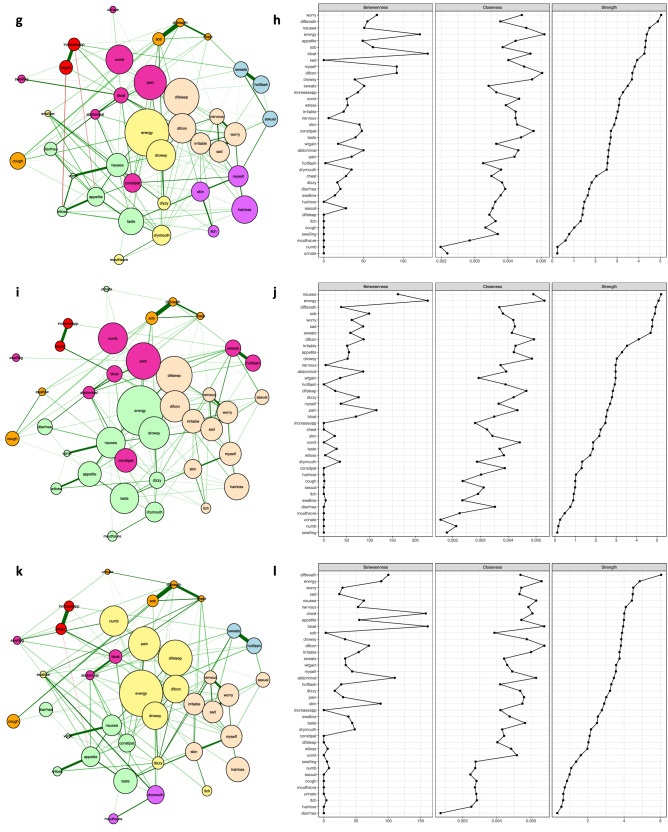
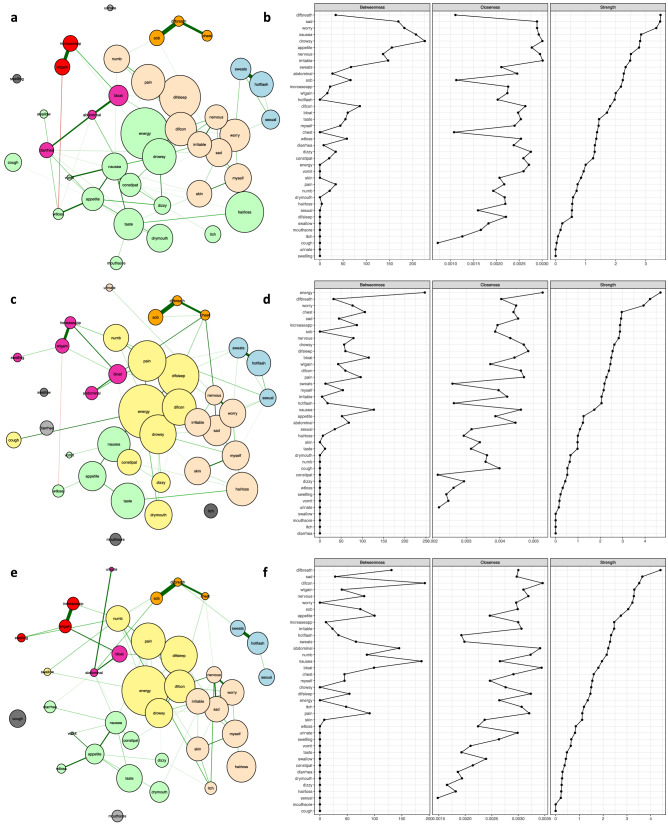
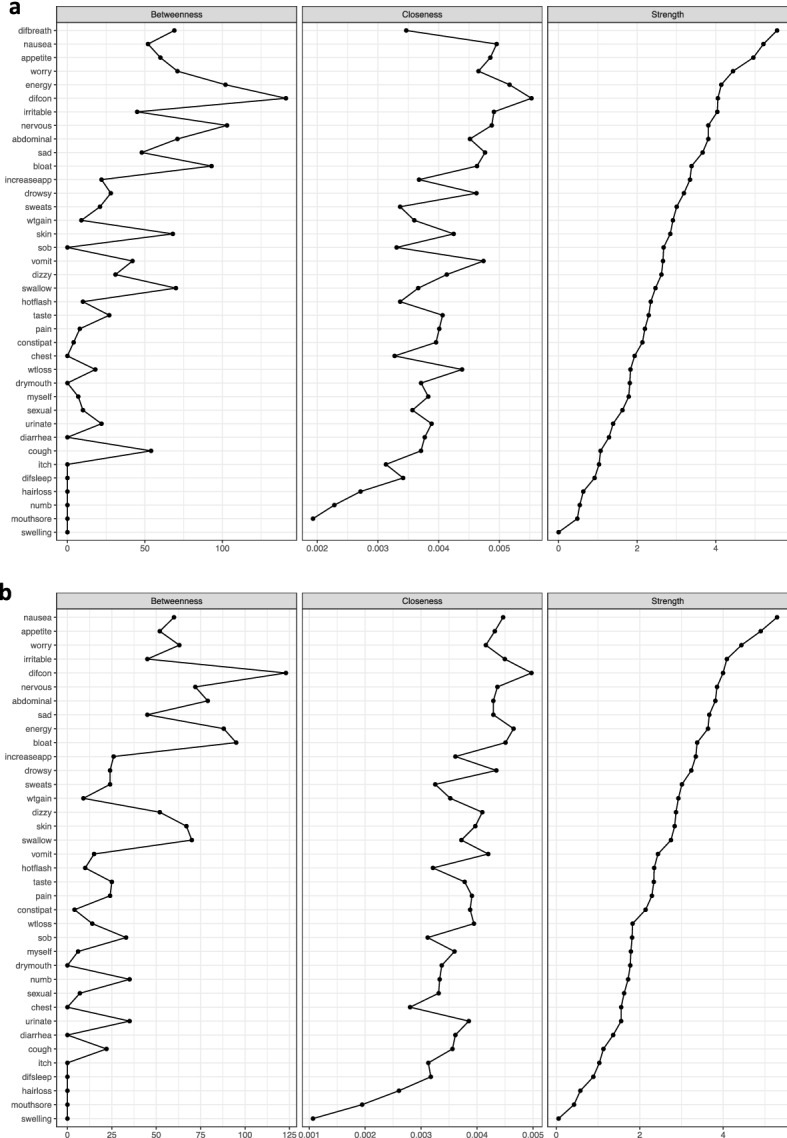
Oncology patients experience numerous co-occurring symptoms during their treatment. The identification of sentinel/core symptoms is a vital prerequisite for therapeutic interventions. In this study, using Network Analysis, we investigated the inter-relationships among 38 common symptoms over time (i.e., a total of six time points over two cycles of chemotherapy) in 987 oncology patients with four different types of cancer (i.e., breast, gastrointestinal, gynaecological, and lung). In addition, we evaluated the associations between and among symptoms and symptoms clusters and examined the strength of these interactions over time. Eight unique symptom clusters were identified within the networks. Findings from this research suggest that changes occur in the relationships and interconnections between and among co-occurring symptoms and symptoms clusters that depend on the time point in the chemotherapy cycle and the type of cancer. The evaluation of the centrality measures provides new insights into the relative importance of individual symptoms within various networks that can be considered as potential targets for symptom management interventions.
© 2022. The Author(s).
Conflict of interest statement
The authors declare no competing interests.
Figures

Similar articles
-
Network Analysis of the Multidimensional Symptom Experience of Oncology.Sci Rep. 2019 Feb 19;9(1):2258. doi: 10.1038/s41598-018-36973-1. Sci Rep. 2019. PMID: 30783135 Free PMC article. Clinical Trial.
-
Stability of symptom clusters and sentinel symptoms during the first two cycles of adjuvant chemotherapy.Support Care Cancer. 2019 May;27(5):1687-1695. doi: 10.1007/s00520-018-4413-9. Epub 2018 Aug 17. Support Care Cancer. 2019. PMID: 30120557
-
Symptom clusters during palliative chemotherapy and their influence on functioning and quality of life.Support Care Cancer. 2017 May;25(5):1519-1527. doi: 10.1007/s00520-016-3545-z. Epub 2016 Dec 28. Support Care Cancer. 2017. PMID: 28032218
-
A review of the literature on symptom clusters in studies that included oncology patients receiving primary or adjuvant chemotherapy.J Clin Nurs. 2018 Feb;27(3-4):516-545. doi: 10.1111/jocn.14057. Epub 2017 Oct 10. J Clin Nurs. 2018. PMID: 28859255 Free PMC article. Review.
-
Telephone interventions for symptom management in adults with cancer.Cochrane Database Syst Rev. 2020 Jun 2;6(6):CD007568. doi: 10.1002/14651858.CD007568.pub2. Cochrane Database Syst Rev. 2020. PMID: 32483832 Free PMC article.
Cited by
-
Network Analysis of Multidimensional Symptoms and Inflammatory Biomarkers in Chinese Patients with Glioma.J Inflamm Res. 2025 May 31;18:7083-7095. doi: 10.2147/JIR.S517105. eCollection 2025. J Inflamm Res. 2025. PMID: 40470305 Free PMC article.
-
Exploring core symptoms and interrelationships among symptoms in children with acute leukemia during chemotherapy: A network analysis.Support Care Cancer. 2023 Sep 16;31(10):578. doi: 10.1007/s00520-023-08024-7. Support Care Cancer. 2023. PMID: 37715817
-
Estimation of Personal Symptom Networks Using the Ising Model for Adult Survivors of Childhood Cancer: A Simulation Study with Real-World Data Application.Clin Epidemiol. 2024 Jul 17;16:461-473. doi: 10.2147/CLEP.S464104. eCollection 2024. Clin Epidemiol. 2024. PMID: 39049900 Free PMC article.
-
Symptom Network Analysis and Unsupervised Clustering of Oncology Patients Identifies Drivers of Symptom Burden and Patient Subgroups With Distinct Symptom Patterns.Cancer Med. 2024 Oct;13(19):e70278. doi: 10.1002/cam4.70278. Cancer Med. 2024. PMID: 39377555 Free PMC article.
-
Network analysis used to investigate the interplay among somatic and psychological symptoms in patients with cancer and cancer survivors: a scoping review.J Cancer Surviv. 2025 Aug;19(4):1198-1211. doi: 10.1007/s11764-024-01543-0. Epub 2024 Mar 26. J Cancer Surviv. 2025. PMID: 38530627 Free PMC article.
References
-
- Dodd, M. J., Miaskowski, C. & Paul, S. M. Symptom clusters and their effect on the functional status of patients with cancer. In Oncology Nursing Forum, vol. 28 (2001). - PubMed
