. 2022 Oct 12;13(1):6028.
doi: 10.1038/s41467-022-33729-4.

Predicting the structure of large protein complexes using AlphaFold and Monte Carlo tree search

Affiliations

Predicting the structure of large protein complexes using AlphaFold and Monte Carlo tree search

Patrick Bryant et al. Nat Commun. .

Abstract

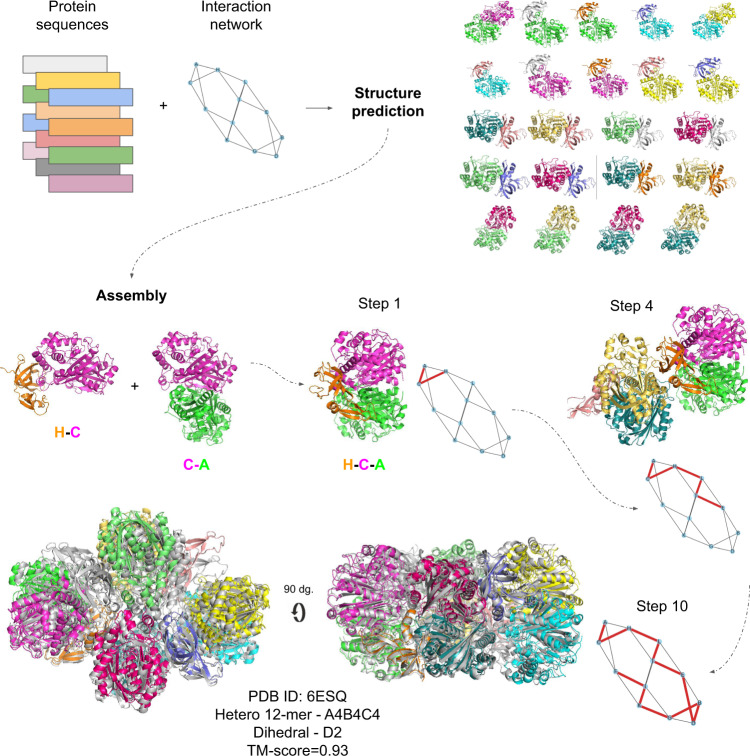
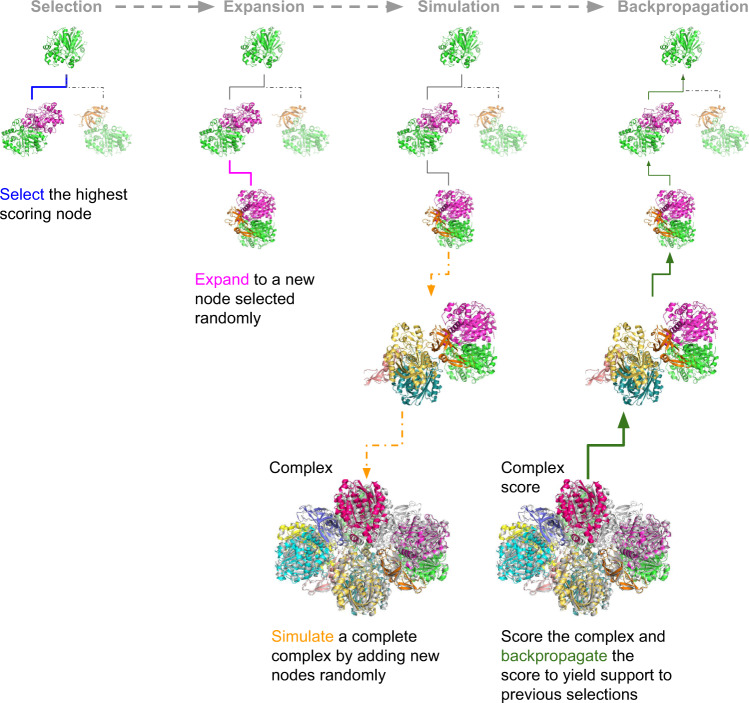
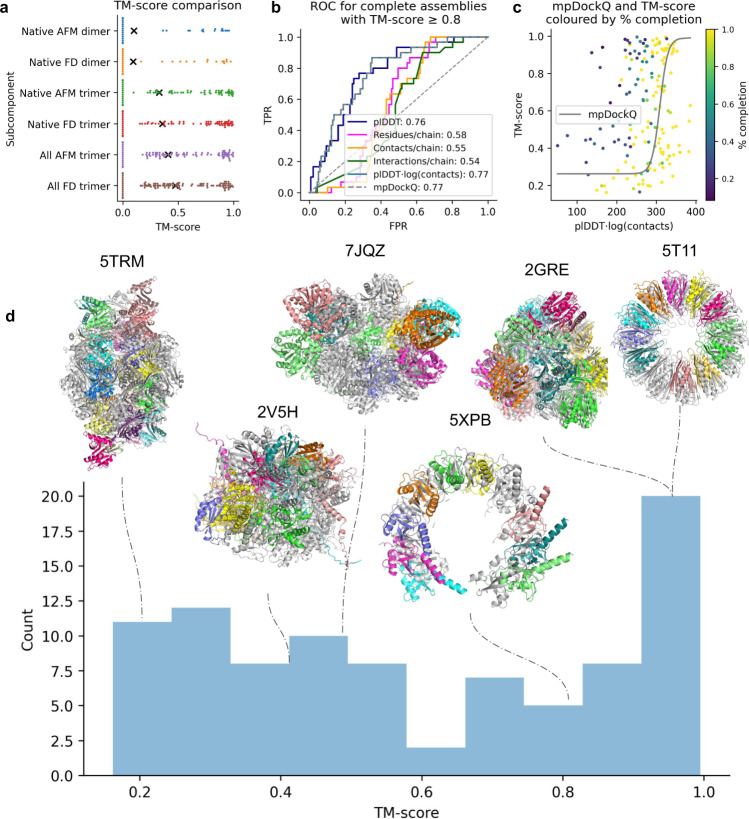
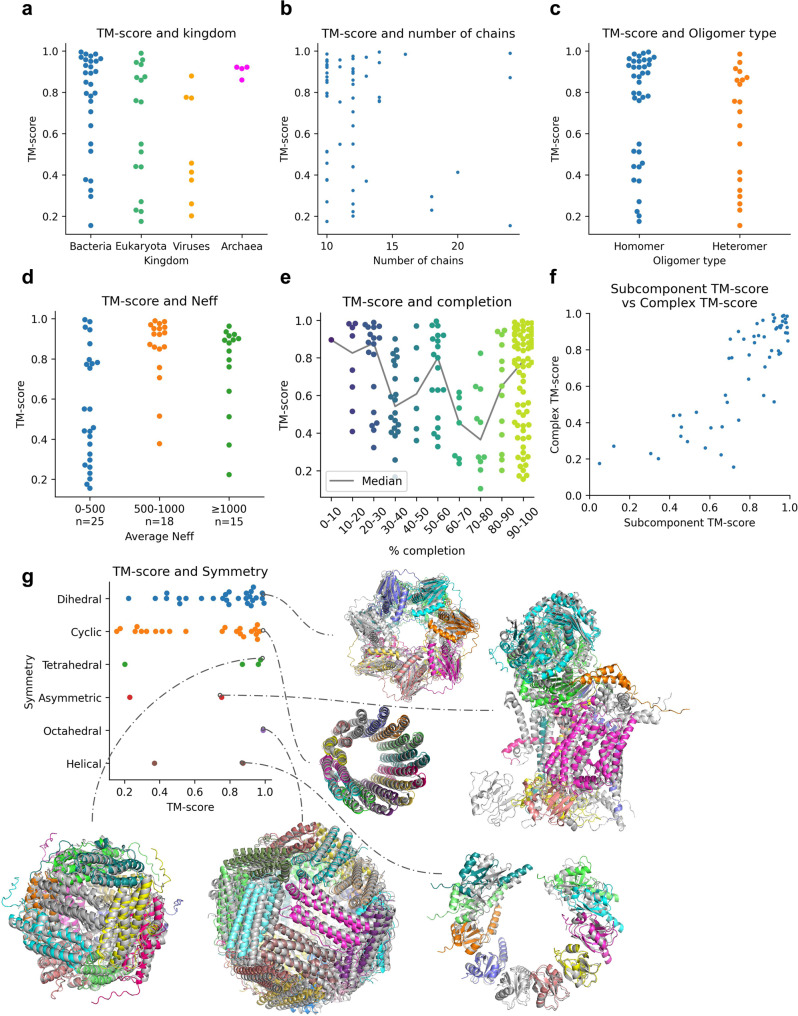
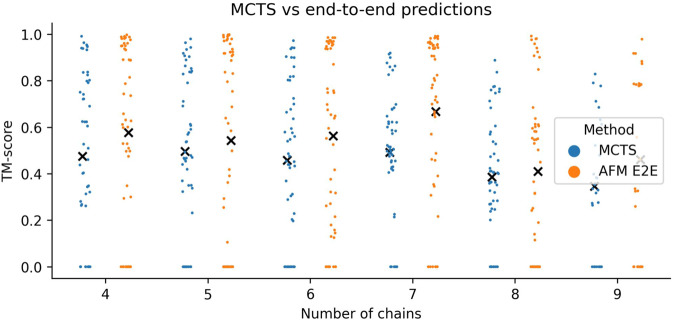
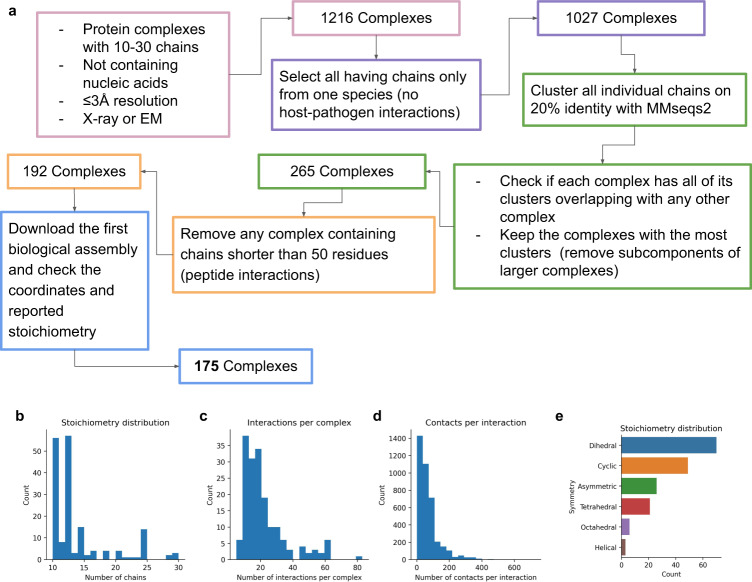
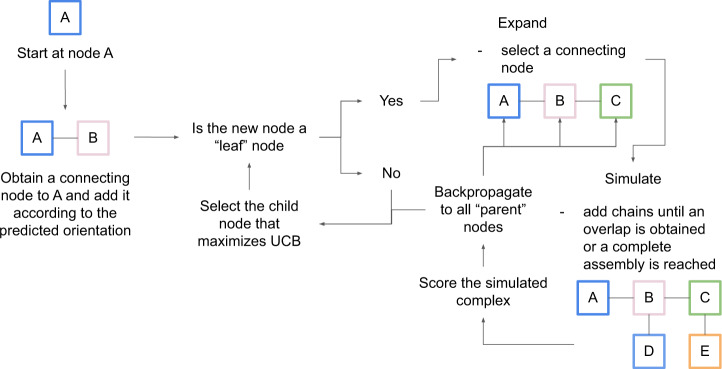
AlphaFold can predict the structure of single- and multiple-chain proteins with very high accuracy. However, the accuracy decreases with the number of chains, and the available GPU memory limits the size of protein complexes which can be predicted. Here we show that one can predict the structure of large complexes starting from predictions of subcomponents. We assemble 91 out of 175 complexes with 10-30 chains from predicted subcomponents using Monte Carlo tree search, with a median TM-score of 0.51. There are 30 highly accurate complexes (TM-score ≥0.8, 33% of complete assemblies). We create a scoring function, mpDockQ, that can distinguish if assemblies are complete and predict their accuracy. We find that complexes containing symmetry are accurately assembled, while asymmetrical complexes remain challenging. The method is freely available and accesible as a Colab notebook https://colab.research.google.com/github/patrickbryant1/MoLPC/blob/master/MoLPC.ipynb .


Conflict of interest statement

The authors declare no competing interests.

Figures

Fig. 1
Fig. 1. Assembly principle for the acetoacetyl-CoA thiolase/HMG-CoA synthase complex (complex 6ESQ).
The structure of all interacting chains is predicted by protein sequences from each chain and the interaction network. From these predictions, an assembly path is constructed using the predictions as a guide. In each step, one new chain is added through a network edge resulting in a sequential construction of the complex. The taken path is outlined in red. The complete assembly is shown in overlap with the native complex (grey). The resulting TM-score is 0.93 using subcomponents from AFM (shown) and 0.92 using FoldDock (not shown).
Fig. 2
Fig. 2. Monte Carlo tree search.
Starting from a node (subcomplex) a new node is selected based on the previously backpropagated scores. From this node, a random node is added (expansion). A complete assembly process is then simulated by adding nodes randomly until an entire complex is assembled or a stop caused by too much overlap is reached. The complex is scored, and the score is backpropagated to all previous nodes, which yields support for the previous selections. The final result is that the nodes most likely to result in high-scoring complexes are joined in a path containing all chains. The principle for the complex 6ESQ is shown.
Fig. 3
Fig. 3. Analysis of assembly success using different methods.
a TM-scores for the complexes that could be assembled to completion using FoldDock (FD) or AFM and predicted native dimeric, native trimeric and all trimeric subcomponents, respectively. The complete set of complexes from the three approaches (n = 108) is shown, with scores of zero representing missing complexes for each approach. The points display the TM-score of the individual complexes and the black “x” marks the average scores. The average TM-scores is 0.09 vs 0.10, 0.36 vs 0.33 and 0.47 vs 0.41 using native dimers, trimers and all trimers for FoldDock vs AFM, respectively. FoldDock thereby outperforms AFM overall. The median scores are low due to the missing complexes between the approaches. Considering only the successful assemblies using native dimers, trimers and all trimers, the median scores are 0.77, 0.80 and 0.51, respectively. b Complex scoring using all trimers as subcomponents. ROC curve, where positives (n = 30) are complete assemblies of TM-score ≥0.8, as a function of the average interface plDDT, the number of interface residues and contacts normalised with the number of chains in each complex, the average interface plDDT times the logarithm of the number of interface contacts and mpDockQ (see c). The best separators are plDDT⋅log(contacts) and mpDockQ, both with AUC 0.83. c TM-score vs the best separator in b), plDDT⋅log(contacts), coloured by the fraction of completion for the assemblies (n = 175). The solid grey line represents a sigmoidal fit creating the mpDockQ score (see Methods section). When the mpDockQ tends to be high, so does the TM-score and % completion of the complex. This suggests that mpDockQ can be used to select when a complex is complete and how accurate it is. d TM-score distribution of the complete complexes (n = 91) assembled using all FoldDock trimers and examples at different thresholds. The assembled complexes (coloured by chain) are in structural superposition with the native ones (grey). The PDB IDs for the complexes shown and their corresponding symmetries and TM-scores are 5TRM (Octahedral, 0.22), 2V5H (Dihedral, 0.45), 7JQZ (Dihedral, 0.51), 5XPB (Helical, 0.82), 2GRE (Tetrahedral, 0.97) and 5T11 (Cyclic, 0.98). At TM-score 0.8, the assembled complex is similar to the native one.
Fig. 4
Fig. 4. Analysis of assembly characteristics using native trimers predicted with FoldDock.
a TM-score per kingdom for the complete assemblies (n = 58). Bacteria is the kingdom with the highest number of complete assemblies (n = 29) and reports a median TM-score of 0.85. Eukaryota (n = 17), Viruses (n = 8) and Archaea (n = 4) have median TM-scores of 0.75, 0.44 and 0.92, respectively. b TM-score vs. the number of chains for the complete assemblies (n = 58). c TM-score vs oligomer type, homomer (n = 38 out of 114) or heteromer (n = 20 out of 61), using complete assemblies. The homomeric complexes have a median TM-score of 0.86 and the heteromeric 0.73. d TM-score and Neff. Average TM-scores are higher for the complexes with over 500 in average Neff value. e TM-score and completion for all complexes (n = 175). The coloured points represent the scores within bins of 10%, and the grey line shows the median for each bin. f Average TM-score of subcomponents vs TM-score of the whole complex for the complete assemblies (n = 58). When the subcomponents display high accuracy, so does the assembled complex (SpearmanR = 0.80). g Distribution of TM-scores and examples of the best assemblies for each symmetry type. The assemblies are coloured by chain, and the true complexes are in structural superposition in grey. The structures shown for each symmetry and the corresponding TM-scores are: 5OVS (Dihedral, 0.99), 2X2V (Cyclic, 0.97), 1DPS (Tetrahedral, 0.98), 1L0L (Asymmetric, 0.75), 1MFR (Octahedral, 0.99) and 5XPB (Helical, 0.88).
Fig. 5
Fig. 5. Comparison of assembly with MCTS vs. AlphaFold-multimer on complexes with 4–9 chains.
Swarm plots displaying the TM-scores (n = 278, n = 50 for each oligomer except for the nonamers, which have n = 28) for assemblies using all possible trimers predicted with FoldDock (MCTS) and AFM end-to-end (E2E). Each point represents one complex with the mean TM-scores marked by a black “x”. The points at zero for MCTS are those complexes that could not be assembled to completion (n = 62) and those for AFM E2E that were out of memory (n = 67). The averages are 0.47 vs 0.58, 0.50 vs 0.54, 0.46 vs 0.56, 0.49 vs 0.67, 0.39 vs 0.41 and 0.35 vs 0.46 for AFM E2E vs MCTS 4–9 chains, respectively.
Fig. 6
Fig. 6. Data selection process and statistics.
a Outline of the data selection process. b Distribution of the number of chains for the 175 complexes. Most complexes have 10–12 chains. c Distribution of the number of interactions between all chains in a complex (n = 175 complexes). On average, there are 22 interactions per complex. d Distribution of the number of contacts per interaction (n = 175 complexes). On average, there are 70 contacts per pair of interacting chains. e Distribution of the symmetry types of the complexes (n = 175 complexes). Dihedral complexes are the most common, followed by cyclic and asymmetric.
Fig. 7
Fig. 7. Branch network of 30 chains all connected to two other chains.
There is only one path that connects all 30 chains (the network itself).
Fig. 8
Fig. 8. Monte Carlo tree search (MCTS) procedure.
Starting at node A, a connecting node (chain) is selected and added according to its predicted orientation. If this node is a “leaf” node (a node that has not been expanded before), an expansion is performed. During the expansion, a new node is added and from this, an entire complex is simulated. The score from the simulation (Eq. 6) is backpropagated to all “parent” nodes of the expansion which is used to determine the UCB (Eq. 5) and thus select the best possible path.

References

    1. Will, C.L. & Lührmann, R. Spliceosome structure and function. Cold Spring Harb. Perspect. Biol. 3, a003707 (2011). - PMC - PubMed
    1. Tanaka K. The proteasome: overview of structure and functions. Proc. Jpn. Acad. Ser. B Phys. Biol. Sci. 2009;85:12–36. doi: 10.2183/pjab.85.12. - DOI - PMC - PubMed
    1. Ditzel L, et al. Crystal structure of the thermosome, the archaeal chaperonin and homolog of CCT. Cell. 1998;93:125–138. doi: 10.1016/S0092-8674(00)81152-6. - DOI - PubMed
    1. Drew K, Wallingford JB, Marcotte EM. hu.MAP 2.0: integration of over 15,000 proteomic experiments builds a global compendium of human multiprotein assemblies. Mol. Syst. Biol. 2021;17:e10016. doi: 10.15252/msb.202010016. - DOI - PMC - PubMed
    1. Giurgiu, M. et al. CORUM: the comprehensive resource of mammalian protein complexes-2019. Nucleic Acids Res. 47, D559–D563 (2019). - PMC - PubMed

Publication types