. 2022 Oct 12;12(1):17074.
doi: 10.1038/s41598-022-14946-9.

Universal dynamics of mitochondrial networks: a finite-size scaling analysis

Affiliations

Universal dynamics of mitochondrial networks: a finite-size scaling analysis

Nahuel Zamponi et al. Sci Rep. .

Abstract

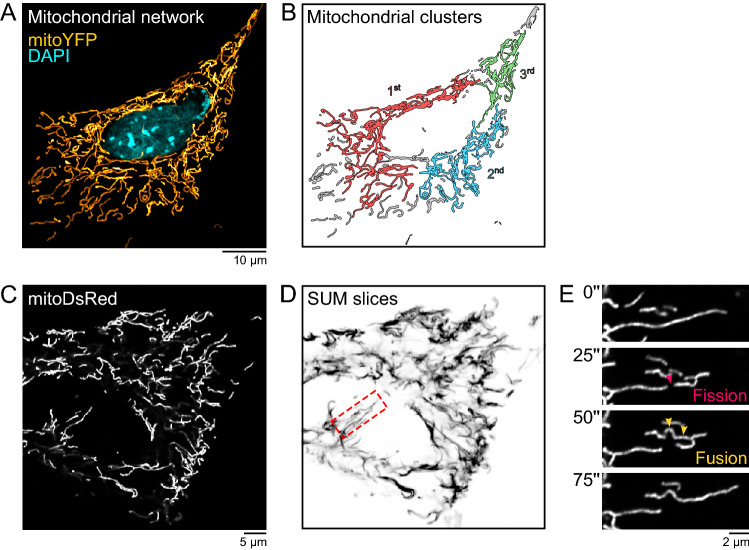
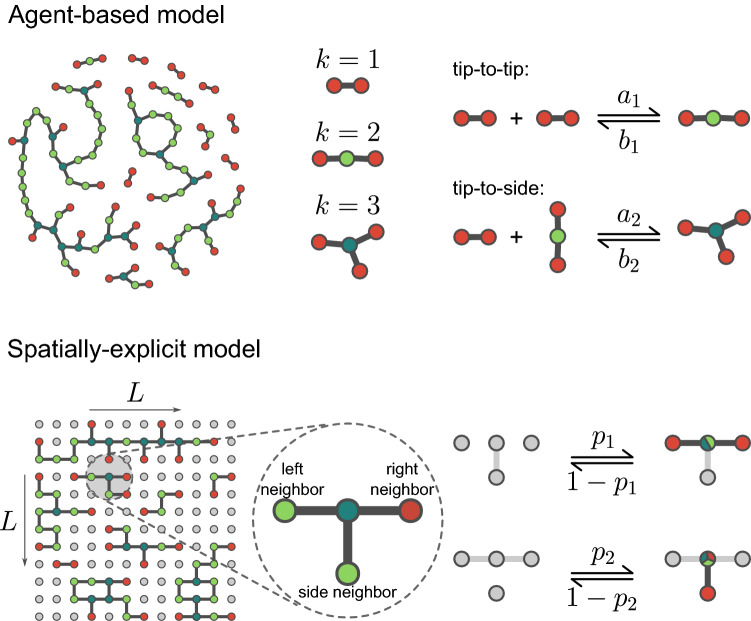
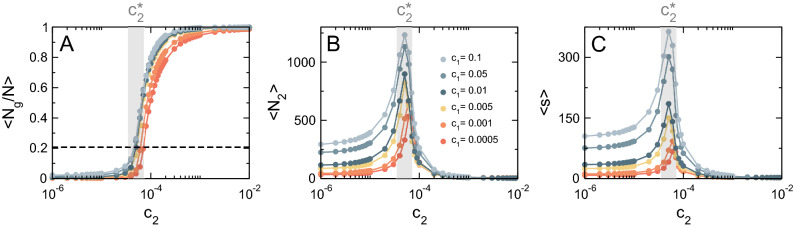
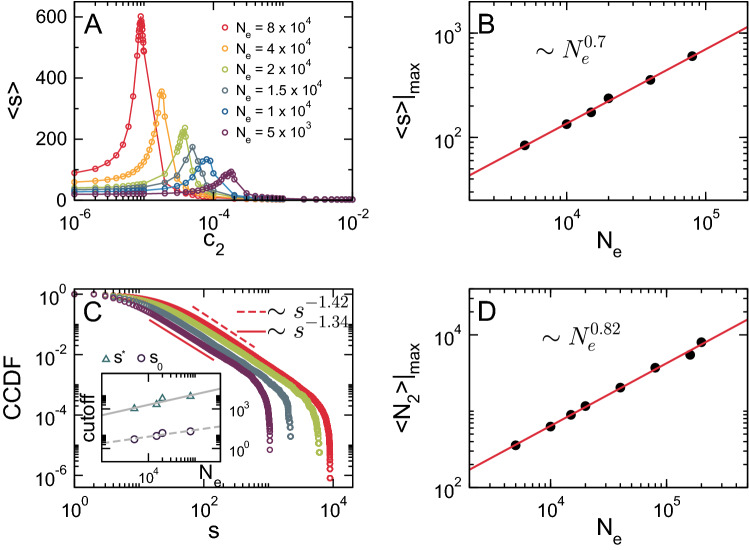
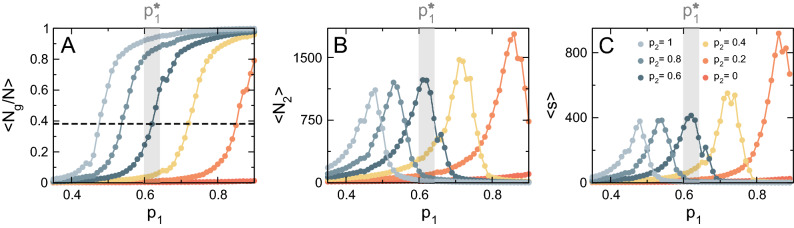
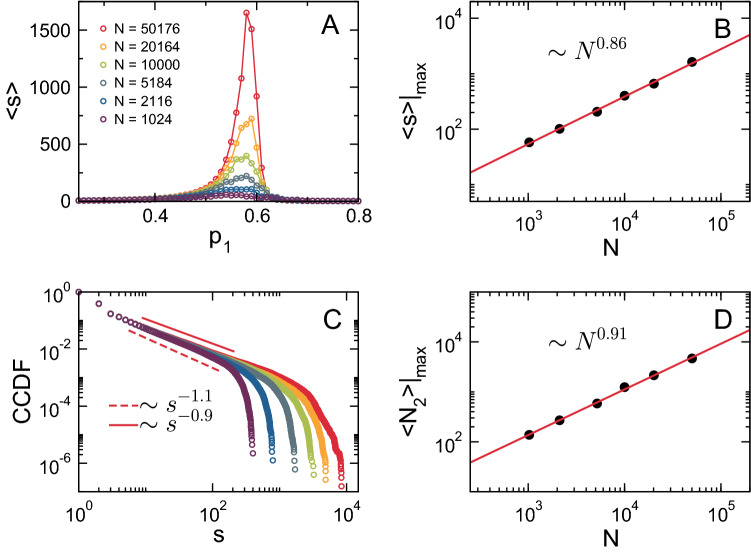
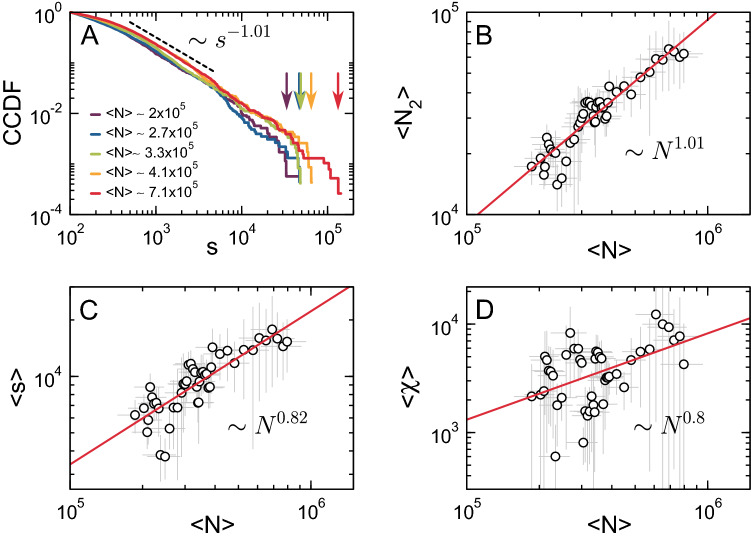
Evidence from models and experiments suggests that the networked structure observed in mitochondria emerges at the critical point of a phase transition controlled by fission and fusion rates. If mitochondria are poised at criticality, the relevant network quantities should scale with the system's size. However, whether or not the expected finite-size effects take place has not been demonstrated yet. Here, we first provide a theoretical framework to interpret the scaling behavior of mitochondrial network quantities by analyzing two conceptually different models of mitochondrial dynamics. Then, we perform a finite-size scaling analysis of real mitochondrial networks extracted from microscopy images and obtain scaling exponents comparable with critical exponents from models and theory. Overall, we provide a universal description of the structural phase transition in mammalian mitochondria.


Conflict of interest statement

The authors declare no competing interests.

Figures

Figure 1
Figure 1
Mitochondrial network structure and dynamics. (A) Mitochondrial network of a mouse embryonic fibroblast (MEF) expressing a mitochondria-targeted yellow fluorescent protein (mitoYFP). (B) Segmentation and identification of the most relevant clusters in the network shown in (A). (C) Live-imaging of a MEF expressing a mitochondria-targeted red fluorescent protein (mitoDSRed). (D) Projection of different time frames revealing regions in the network with slow (dark) and fast (light) mitochondrial dynamics. (E) Zoom-in of the inset in (D) highlighting specific fission and fusion events occurring in the network.
Figure 2
Figure 2
The two models of mitochondrial network dynamics used in this work. In the agent-based model, network nodes do not have explicit spatial coordinates. The final topology of the network emerges from the iteration of two types of events: tip-to-tip events, in which two k=1 units are merged into a k=2 unit (or vice versa), and tip-to-side events, in which a k=1 unit and a k=2 unit are merged into a k=3 unit (or vice versa). In the spatially-explicit model, the network nodes are embedded in a 2-dimensional lattice with predetermined nearest neighborhood interactions. Interactions are anisotropic: a bond is established between a node and its left and right nearest neighbors with probability p1 (or destroyed with probability 1-p1) and with its side nearest neighbor with probability p2 (or destroyed with probability 1-p2).
Figure 3
Figure 3
Phase transition in the AB model. (A) Order parameter Ng/N as a function of the control parameter c2 for a system of size Ne=1.5×10⁴ and different values of c1. Shaded region depicts the pseudo–critical value c2 for c1=0.01. Dashed line denotes the proportion of nodes belonging to the largest cluster at the critical point for c1=0.01. (B) Size of the second largest cluster N2 as a function of c2. (C) Susceptibility s as a function of c2.
Figure 4
Figure 4
Finite-size scaling analysis of the AB model. (A) Susceptibility s as a function of c2 for different system sizes (c1=0.01). s exhibits a size-dependent maximum at a pseudo–critical value c2(Ne). (B) Log-log plot of s|max as a function of Ne, where the solid red line is a power-law fitting with exponent 0.7±0.01. (C) The CCDF of the cluster size distribution at c2(Ne) for different system sizes, where dashed and solid lines correspond to power-law fittings of the central part of the distribution with exponents -1.42 (Ne=8×10⁴) and -1.34 (Ne=5×10³), respectively. The inset shows the scaling of small-size (s0) and large-size (s) cutoffs of the distribution as a function of Ne, where solid and dashed lines correspond to power-law fits with exponents 0.8±0.2 and 0.5±0.1, respectively. (D) Log-log plot of N2|max as a function of Ne, where the solid red line is a power-law fitting with exponent 0.82±0.01.
Figure 5
Figure 5
Phase transition in the SE model. (A) Order parameter Ng/N as a function of the control parameter p1 for a system of size N=1×10⁴ and different values of p2. Shaded region depicts the pseudo–critical value p1 for p2=0.6. Dashed line denotes the proportion of nodes belonging to the largest cluster at the critical point for p2=0.6. (B) Size of the second largest cluster N2 as a function of p1. (C) Susceptibility s as a function of p2.
Figure 6
Figure 6
Finite-size scaling analysis of the SE model. (A) Susceptibility s as a function of p1 for different system sizes (p2=0.7). s exhibits a size-dependent maximum at a pseudo–critical value p1(N). (B) Log-log plot of s|max as a function of N, where the solid red line is a power-law fitting with exponent 0.86±0.02. (C) The CCDF of the cluster size distribution at p1(N) for different system sizes, where solid and dashed lines correspond to power-law fits of the central part of the distribution with exponents -0.9(N=50176) and -1.1(N=1024), respectively. (D) Log-log plot of N2|max as a function of N, where the solid red line is a power-law fitting with exponent 0.91±0.02.
Figure 7
Figure 7
Finite-size scaling analysis of mitochondrial networks from MEFs. (A) The CCDF of the cluster mass distribution for different values of the average total mass of the network N, where the dashed line corresponds to a power-law fit of the central part of the distribution with exponent -1.01±0.01. Arrows indicate how the large-size cutoff increases as a function of N. (B) Log-log plot of N2 as a function of N, where the solid red line is a power-law fitting with exponent 1.01±0.06. (C) Log-log plot of s as a function of N, where the solid red line is a power-law fitting with exponent 0.82±0.08. (D) Log-log plot of χ (Eq. 10) as a function of N, where the solid red line is a power-law fitting with exponent 0.8±0.23. N corresponds to the average total mitochondrial mass estimated from images, used here as a proxy for network size. Symbols correspond to mean values and error bars to standard deviations from different intensity thresholds (see “Methods”).

Similar articles

Cited by

References

    1. Lane N, Martin W. The energetics of genome complexity. Nature. 2010;467:929. doi: 10.1038/nature09486. - DOI - PubMed
    1. Spinelli JB, Haigis MC. The multifaceted contributions of mitochondria to cellular metabolism. Nat. Cell Biol. 2018;20:745. doi: 10.1038/s41556-018-0124-1. - DOI - PMC - PubMed
    1. Sena LA, Chandel NS. Physiological roles of mitochondrial reactive oxygen species. Mol. Cell. 2012;48:158. doi: 10.1016/j.molcel.2012.09.025. - DOI - PMC - PubMed
    1. Eisner V, Picard M, Hajnóczky G. Mitochondrial dynamics in adaptive and maladaptive cellular stress responses. Nat. Cell Biol. 2018;20:755. doi: 10.1038/s41556-018-0133-0. - DOI - PMC - PubMed
    1. Wang C, Youle RJ. The role of mitochondria in apoptosis. Annu. Rev. Genet. 2009;43:95. doi: 10.1146/annurev-genet-102108-134850. - DOI - PMC - PubMed

Publication types