. 2022 Oct 12;13(1):6024.
doi: 10.1038/s41467-022-33706-x.

A single transcription factor facilitates an insect host combating Bacillus thuringiensis infection while maintaining fitness

Affiliations

A single transcription factor facilitates an insect host combating Bacillus thuringiensis infection while maintaining fitness

Zhaojiang Guo et al. Nat Commun. .

Abstract

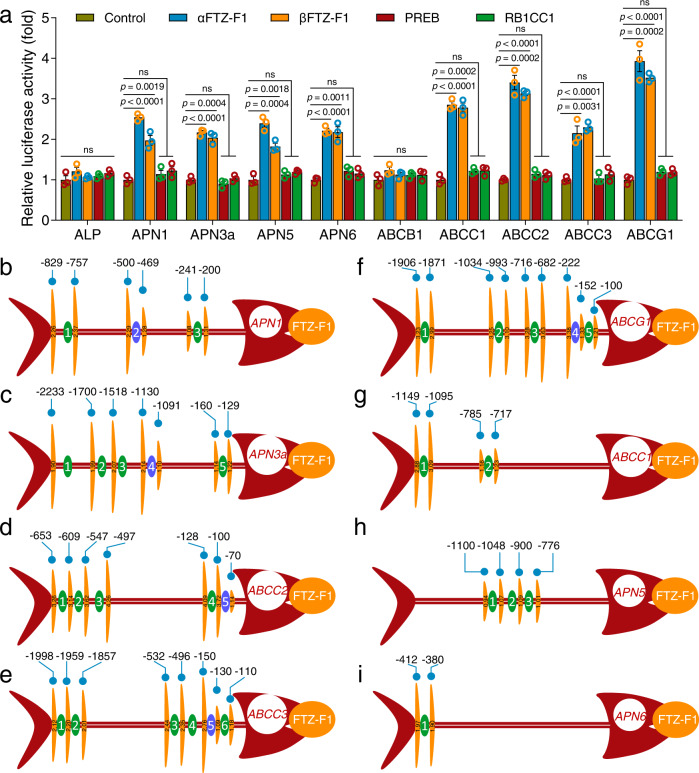
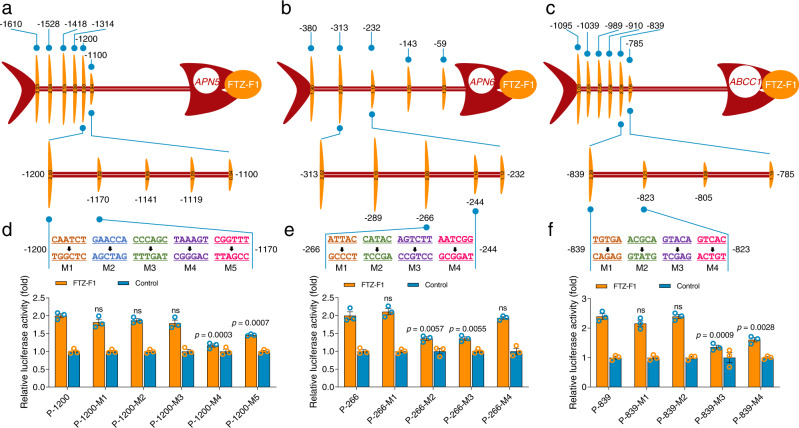
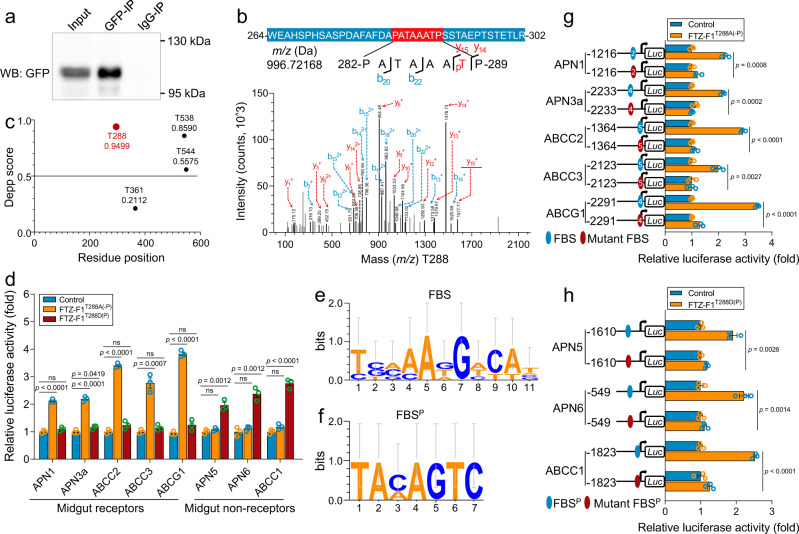
Maintaining fitness during pathogen infection is vital for host survival as an excessive response can be as detrimental as the infection itself. Fitness costs are frequently associated with insect hosts countering the toxic effect of the entomopathogenic bacterium Bacillus thuringiensis (Bt), which delay the evolution of resistance to this pathogen. The insect pest Plutella xylostella has evolved a mechanism to resist Bt toxins without incurring significant fitness costs. Here, we reveal that non-phosphorylated and phosphorylated forms of a MAPK-modulated transcription factor fushi tarazu factor 1 (FTZ-F1) can respectively orchestrate down-regulation of Bt Cry1Ac toxin receptors and up-regulation of non-receptor paralogs via two distinct binding sites, thereby presenting Bt toxin resistance without growth penalty. Our findings reveal how host organisms can co-opt a master molecular switch to overcome pathogen invasion with low cost, and contribute to understanding the underlying mechanism of growth-defense tradeoffs during host-pathogen interactions in P. xylostella.


Conflict of interest statement

The authors declare no competing interests.

Figures

Fig. 1
Fig. 1. FTZ-F1 regulates the expression of multiple midgut Cry toxin receptors and non-receptor paralogous genes.
a Effects of four TFs on the promoter activity of Bt receptor genes and non-receptor paralogous genes. Each pAc5.1-TF expression vector was co-transfected with a pGL4.10-promoter reporter plasmid into S2 cells to detect luciferase activity. An empty pAc5.1 vector was used as a control. The relative luciferase activity (fold) was calculated based on the value of the control, which was assigned an arbitrary value of 1. Differences between control and TF-treated groups were tested by one-way ANOVA with Tukey’s test. Data were presented as mean values ± SEM (n = 3), ns, not significant, p values are shown. bi Preliminary identification of functional FBSs in the promoters of midgut genes by dual-luciferase reporter assays. The FTZ-F1 expression vector was co-transfected with various truncated constructs of midgut gene promoters to identify functional FBSs. The empty pAc5.1 vector was used as a control. The data of relative luciferase activity (fold) represent the mean value and was calculated based on the value of the control (n = 3), which was assigned an arbitrary value of 1. The results are presented as fish-like shapes. The head shows the target gene, and the orange ellipse by the mouth denotes the TF FTZ-F1. The horizontal red fishbone represents the promoter region, and the numbered ellipses represent the predicted FBSs, where present the purple ellipse represents the potential functional FBS. The height of the vertical orange fishbone represents the relative luciferase activity (fold) of the different truncations of a given promoter (the specific values are represented by vertical black Arabic numerals). The horizontal numbers represent the nucleotide position of the different truncations relative to the start codon. Source data are provided as a Source Data file.
Fig. 2
Fig. 2. Preliminary identification of the functional binding sites in the promoters of the non-receptor genes APN5, APN6, and ABCC1 by a dual-luciferase reporter assay.
The FTZ-F1 expression vector was co-transfected with various truncated promoters of non-receptor genes APN5 (a), APN6 (b), and ABCC1 (c). The results are presented using the same fish-like structure as Fig. 1. The lower “bones” represent the second set of deletions created within the region identified as containing the functional binding site from the initial set of deletions. The horizontal numbers represent the nucleotide position of the different truncations relative to the start codon. df The effect of FTZ-F1 on wild-type or mutated promoters of APN5, APN6, and ABCC1 genes. A series of recombinants comprising 5–6 base mutations in each of the promoter regions was constructed and co-transfected with an FTZ-F1 vector to precisely identify the position of the functional FBSs. An empty pAc5.1 vector was used as a control (af). The relative luciferase activity (fold) was calculated based on the value of the control, which was assigned an arbitrary value of 1. Data were presented as mean values (ac) and mean values ± SEM (n = 3) (df), ns, not significant, p values are shown. Differences between wild-type and mutated promoters were tested by one-way ANOVA with Tukey’s test (df). Source data are provided as a Source Data file.
Fig. 3
Fig. 3. Identification of the functional phosphorylation sites for FTZ-F1.
a Immunoprecipitation of exogenous FTZ-F1 from Sf9 cells using anti-GFP. b The putative phosphorylation site T288 of FTZ-F1 was identified by LC-MS/MS. The precursor ion, which ranges from 264 to 302, is shown in the top band with the amino acids in white letters, and the representative fragment ion is shown with a red background with detailed information. The identified phosphorylation site T288 is represented by a red letter and subscripted p, while the phosphorylated peptide on the spectrum is underlined in red. c The DEPP score of the four putative phosphorylation sites was computed using the DEPP software in silico. d The regulatory effect of phosphorylated FTZ-F1T288D(P) and non-phosphorylated FTZ-F1T288A(-P) on midgut genes. A substitutes T mimicking dephosphorylation and D substitutes T mimicking sustained phosphorylation. e, f WebLogo plots highlight the potential functional FBS in receptor gene promoters (e) and FBSP in non-receptor gene promoters (f). g Effect of non-phosphorylated FTZ-F1T288A(-P) on the activity of receptor promoters with either a wild-type or a mutant FBS. For clarity, only the functional FBSs are shown. h Effect of phosphorylated FTZ-F1T288D(P) on the activity of non-receptor promoters with either a wild-type or a mutant FBSP. The empty pAc5.1 vector was used as a control (d, g, h), and the relative luciferase activity (fold) was calculated based on the value of the control, which was assigned an arbitrary value of 1. Data were presented as mean values ± SEM (n = 3), ns, not significant, p values are shown. One-way ANOVA with Tukey’s test was used for comparison. Source data are provided as a Source Data file.
Fig. 4
Fig. 4. Phosphorylated and non-phosphorylated FTZ-F1 preferentially bind to distinct DNA motifs and both function in the nucleus.
a, b EMSA assay validates that the non-phosphorylated FTZ-F1T288A(-P) (a) and the phosphorylated FTZ-F1T288D(P) (b) specifically bind to the FBS (a), and FBSP (b) respectively. The concentrations of the wild-type and mutant probes were 20 fmol; the concentrations of competing cold probes were 100 and 500 fmol. The mutant sequences were 5′-CGCACACACGT−3′ for FBS and 5′-GGCTCCGAAC-3′ for FBSP. c Y1H assays verifying the direct binding of non-phosphorylated FTZ-F1T288A(-P) to FBS, and the direct binding of phosphorylated FTZ-F1T288D(P) to the FBSP using wild-type or mutated binding sites as described below. EV empty vector; positive control, pGADT7-p53 + pABAi-p53. d Subcellular localization of non-phosphorylated FTZ-F1T288A(-P) protein and the phosphorylated FTZ-F1T288D(P) protein. The nuclei were stained with DAPI, the Sf9 cells or cells transfected with the empty plasmids (Pie-EGFP-N1) were used as controls. Scale bar: 10 μm. Source data are provided as a Source Data file.
Fig. 5
Fig. 5. Elevated phosphorylation of FTZ-F1 in vivo enhances resistance of P. xylostella larvae to Cry1Ac toxin.
a FTZ-F1 transcript level in the larval midgut of a susceptible DBM1Ac-S strain and four resistant P. xylostella strains. The relative expression level was quantitated and normalized to the expression level of the RPL32 gene and the value in the DBM1Ac-S strain was set as 1. b Protein expression and phosphorylation levels of FTZ-F1 in the larval midgut of the same five P. xylostella strains. Phosphorylated and non-phosphorylated FTZ-F1 proteins were separated on a Phos-tag SDS-PAGE gel, detected by anti-FTZ-F1, and quantitated by densitometry using the ImageJ 1.51 software and normalized to the β-actin. ce Effect of FTZ-F1 silencing on phosphorylation of FTZ-F1 in the midguts (c), the transcript level of midgut genes (d), and larval susceptibility to an LC50 concentration of Cry1Ac (3980 mg/L) (e) in NIL-R strain. fh Effect of FTZ-F1 silencing on phosphorylation of FTZ-F1 in the midguts (f), the transcript level of midgut genes (g), and larval susceptibility to an LC90 concentration of Cry1Ac (2 mg/L) (h) in DBM1Ac-S strain. Data were presented as mean values (n = 3) (d, g) and mean values ± SEM (n = 3) (a, e, h), ns, not significant, p values are shown. One-way ANOVA with Tukey’s test was used in a, e, h for comparison. Source data are provided as a Source Data file.
Fig. 6
Fig. 6. MAPK cascades regulate the in vivo phosphorylation level of FTZ-F1.
ac Effect of silencing MAP4K4 gene on FTZ-F1 mRNA expression (a), protein level and degree of phosphorylation (b), and larval mortality (c) in the resistant strain NIL-R. df Effect of specific inhibitors of p38, ERK, or JNK on FTZ-F1 mRNA expression (d), protein level and degree of phosphorylation (e), and larval mortality (f) in the resistant strain NIL-R. Relative mRNA expression levels (a, d) were quantitated and normalized to the expression level of the RPL32 gene, the value for the buffer treated strain was set as 1. Phosphorylated and non-phosphorylated FTZ-F1 proteins (b, e) were separated on a Phos-tag SDS-PAGE gel, detected by anti-FTZ-F1 and quantitated by densitometry using the ImageJ 1.51 software and normalized to the β-actin. Data were presented as mean values ± SEM (a, c, d, f). n = 3 biologically independent samples, ns, not significant, p values are shown. The differences between control and dsRNA-treated groups or inhibitor-treated groups were tested by one-way ANOVA with Tukey’s test. Source data are provided as a Source Data file.
Fig. 7
Fig. 7. CRISPR/Cas9-mediated knockout of non-receptor genes in P. xylostella.
a Representative chromatogram of CRISPR/Cas9-induced mutation of ABCC1 gene (top), double-gene knockout of APN6 and APN5 genes (middle), and triple mutant of ABCC1/APN6/APN5 genes by introducing mutations on the base of the double-mutant (bottom). The cleavage site of Cas9 protein is indicated with a red-edged yellow triangle. The arrow indicates the junction position after deletion. b Representative pupal morphology in P. xylostella susceptible DBM1Ac-S, resistant NIL-R, and non-receptor gene-edited strains. cf Evaluation of fitness costs in non-receptor gene mutant strains. A series of biological parameters were compared among non-receptor gene knockout strains (C1KO, N6-5KO, and C1/N6/N5KO) with the susceptible DBM1Ac-S and the parental NIL-R resistant strains. c Pupation rate. d Pupal weight. e Pupal duration. f Hatching rate. Data were presented as mean value ± SEM, n = 5 biologically independent samples with ten larvae per replicate, ns, not significant, p values are shown. One-way ANOVA with Tukey’s test was used for comparison. Source data are provided as a Source Data file.
Fig. 8
Fig. 8. Summary model of the MAPK-activated regulator FTZ-F1 maintaining a growth-defense balance with enhanced tolerance/resistance of P. xylostella to Bt Cry1Ac toxin.
Phosphorylated FTZ-F1 activates non-receptor genes via the motif “TAMAGTC”, while non-phosphorylated FTZ-F1 induces receptor genes via the binding site “YCAAGGYCR”. The activated MAPK cascade elevates the phosphorylation level of FTZ-F1, reducing the pool of non-phosphorylated TF, leading to upregulation of non-receptor gene expression and downregulation of receptor gene expression, which confers tolerance/resistance of P. xylostella to Cry1Ac toxin without growth penalty. Degenerate bases: M(A/C); Y(C/T); R(A/G).

Similar articles

Cited by

References

    1. Bisen, P. S., Debnath, M. & Prasad, G. B. Microbes: Concepts and Applications (John Wiley & Sons, 2012).
    1. Bertrand, J. C. et al. Environmental Microbiology: Fundamentals and Applications: Microbial Ecology (Springer, 2015).
    1. Jones JD, Vance RE, Dangl JL. Intracellular innate immune surveillance devices in plants and animals. Science. 2016;354:aaf6395. doi: 10.1126/science.aaf6395. - DOI - PubMed
    1. Cory JS. Evolution of host resistance to insect pathogens. Curr. Opin. Insect Sci. 2017;21:54–59. doi: 10.1016/j.cois.2017.04.008. - DOI - PubMed
    1. Lopes Fischer N, Naseer N, Shin S, Brodsky IE. Effector-triggered immunity and pathogen sensing in metazoans. Nat. Microbiol. 2020;5:14–26. doi: 10.1038/s41564-019-0623-2. - DOI - PMC - PubMed

Publication types