. 2022 Oct 12;12(1):17081.
doi: 10.1038/s41598-022-21147-x.

Generation and characterization of human U-2 OS cell lines with the CRISPR/Cas9-edited protoporphyrinogen oxidase IX gene

Affiliations

Generation and characterization of human U-2 OS cell lines with the CRISPR/Cas9-edited protoporphyrinogen oxidase IX gene

Zora Novakova et al. Sci Rep. .

Abstract

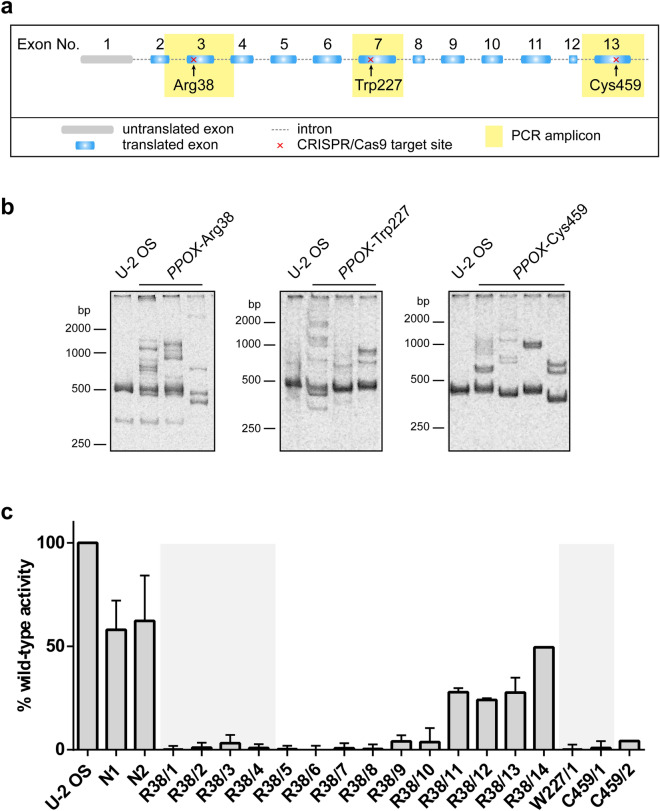
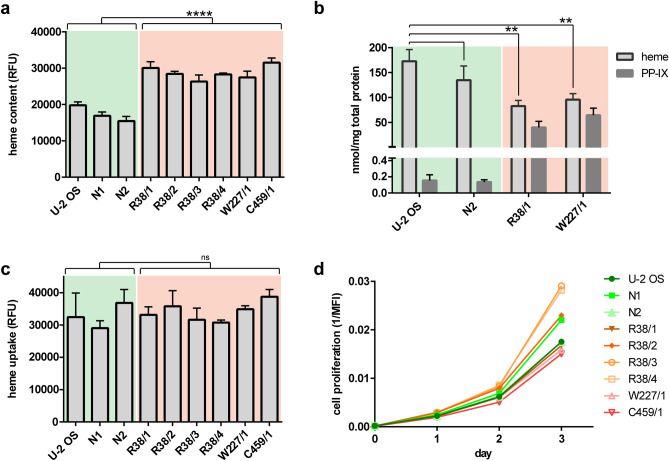
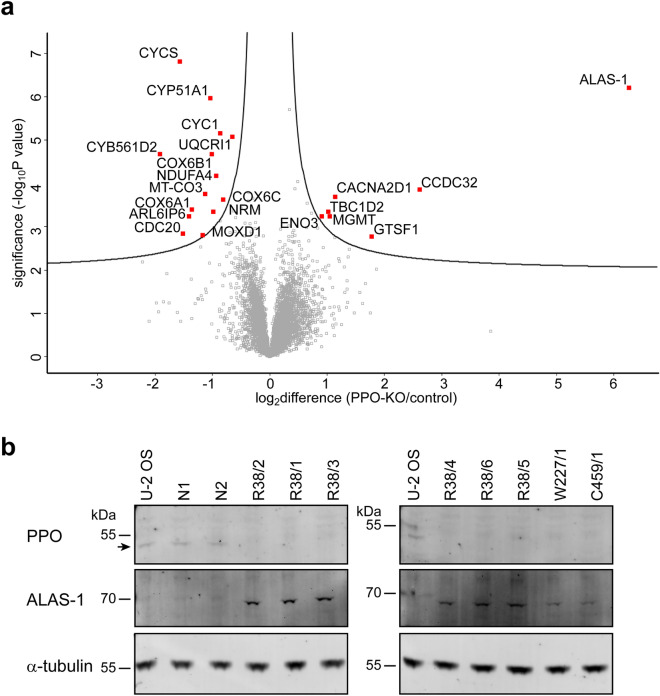
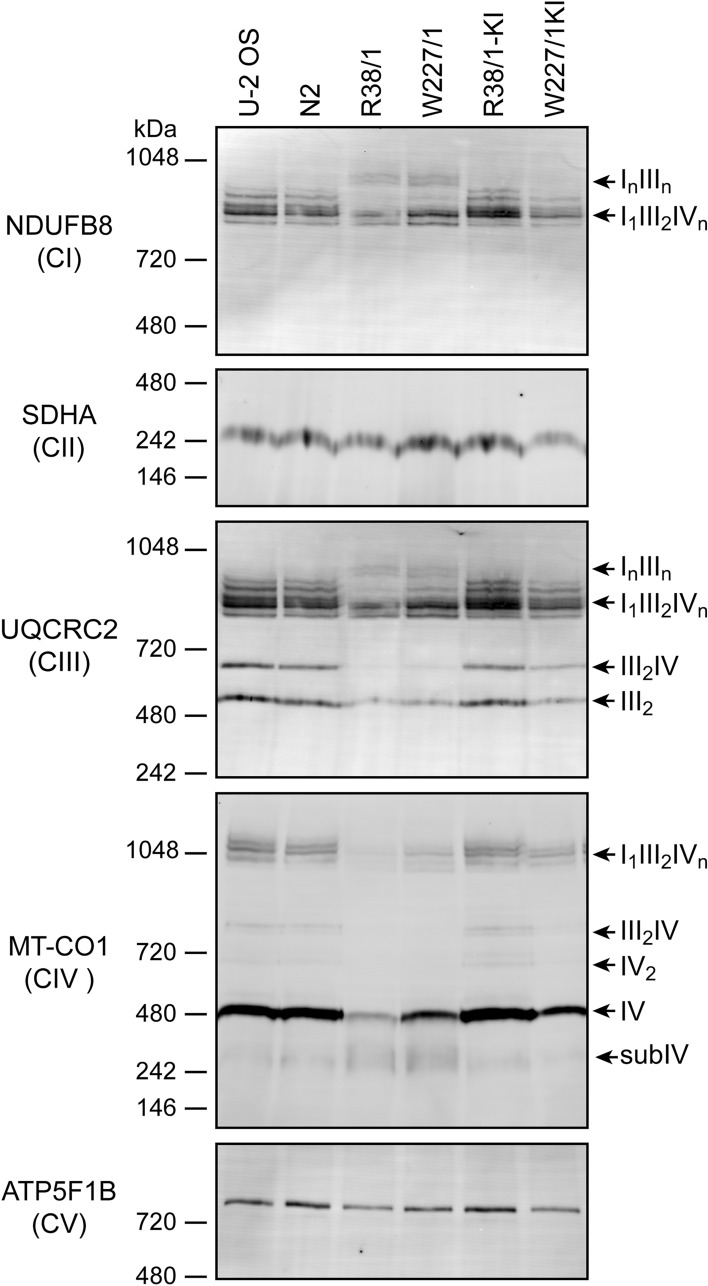
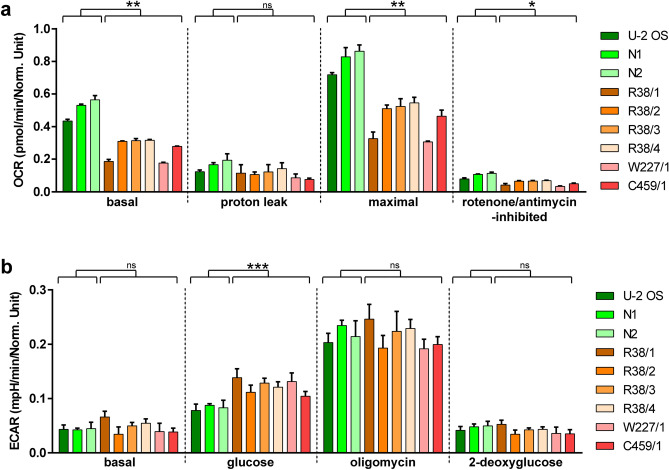
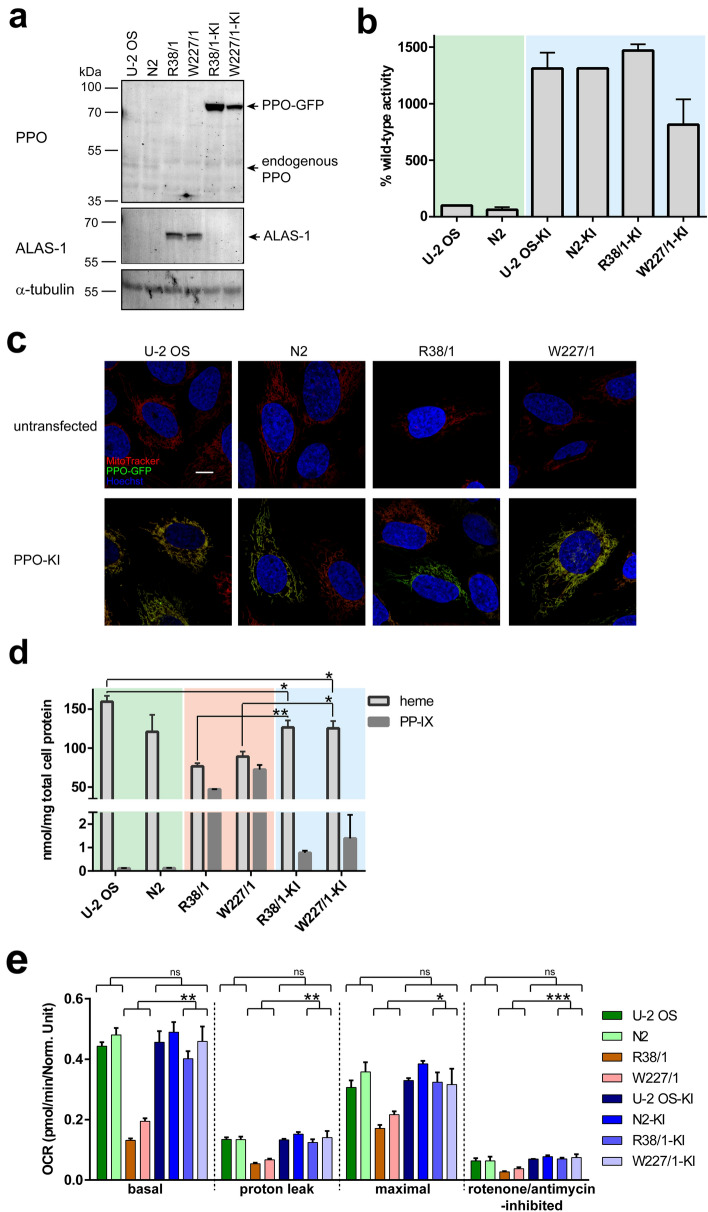
In humans, disruptions in the heme biosynthetic pathway are associated with various types of porphyrias, including variegate porphyria that results from the decreased activity of protoporphyrinogen oxidase IX (PPO; E.C.1.3.3.4), the enzyme catalyzing the penultimate step of the heme biosynthesis. Here we report the generation and characterization of human cell lines, in which PPO was inactivated using the CRISPR/Cas9 system. The PPO knock-out (PPO-KO) cell lines are viable with the normal proliferation rate and show massive accumulation of protoporphyrinogen IX, the PPO substrate. Observed low heme levels trigger a decrease in the amount of functional heme containing respiratory complexes III and IV and overall reduced oxygen consumption rates. Untargeted proteomics further revealed dysregulation of 22 cellular proteins, including strong upregulation of 5-aminolevulinic acid synthase, the major regulatory protein of the heme biosynthesis, as well as additional ten targets with unknown association to heme metabolism. Importantly, knock-in of PPO into PPO-KO cells rescued their wild-type phenotype, confirming the specificity of our model. Overall, our model system exploiting a non-erythroid human U-2 OS cell line reveals physiological consequences of the PPO ablation at the cellular level and can serve as a tool to study various aspects of dysregulated heme metabolism associated with variegate porphyria.


Conflict of interest statement

The authors declare no competing interests.

Figures

Figure 1
Figure 1
Establishing PPO-KO cell lines by CRISPR/Cas9 editing of the PPOX gene. (a) Schematic representation of PPOX gene disruption. Positions of CRISPR/Cas9 target sites are marked by red crosses. Sequences amplified by PCR for detection of heteroduplexes and allele genotyping are highlighted in yellow. (b) Analysis of PPOX allele heteroduplexes from CRISPR/Cas9 edited cell lines. Regions encompassing CRISPR recognition sites were PCR-amplified, annealed, and separated by PAGE with GelRed staining. Representative samples of CRISPR/Cas9 clones of PPOX-Arg38, PPOX-Trp227, and PPOX-Cys459 loci are shown. (c) The PPO enzymatic activity in cell lysates of PPO-KO and control clones was determined by quantifying the conversion of protoporphyrinogen IX to protoporphyrin IX. PPO oxidase activity in individual clones was normalized to the total protein content and is shown as a fraction of the activity of the U-2 OS parental cell line. Cell clones selected for further analysis are highlighted by grey background. Data represent mean (± S.D.); n = 3.
Figure 2
Figure 2
Characterization of PPO-KO cell lines. (a) Content of intracellular heme determined by iron-chelation assay. Statistical significance was calculated by unpaired parametric t-test with Welch’s correction and assigned by **** (P < 0.0001). Data represent mean (± S.D.); n = 3. Control samples and PPO-KO clones are highlighted by green and orange background, respectively. (b) Content of intracellular protoporphyrinogen/protoporphyrin IX and heme determined by RP-HPLC. Statistical significance was calculated by one-way ANOVA and assigned by ** (P < 0.01). Data represent mean (± S.D.); n = 3. (c) Uptake of Zn-protoporphyrin (Zn-PP; fluorescent heme analog) by studied cell lines. Fluorescence of intracellular Zn-PP was determined following 3-h incubation of cells with 60 µM Zn-PP. Statistical significance was calculated by unpaired parametric t-test with Welch’s correction and assigned by ns (non-significant; P > 0.05). Data represent mean (± S.D.); n = 2. (d) Proliferation rate of studied cells was determined by quantifying intracellular concentration of the fluorescent CFSE reagent by flow cytometry. The median of fluorescence intensity (MFI) is plotted against cultivation time. Data represent mean (± S.D.); n = 2.
Figure 3
Figure 3
Analysis of protein levels in PPO-KO cells. (a) Volcano plot of significantly differentially abundant proteins in PPO-KO cells compared to control cell lines. Cell lysates of two control (U-2 OS and N2) and two PPO-KO (R38/1 and W227/1) clones were digested with Lys-C/trypsin and resulting peptides identified and quantified using mass spectrometry-label free quantification analysis. In the volcano plot, the − log10 (Benjamini–Hochberg corrected P value) is plotted against the log2 (fold change: PPO-KO/control). Proteins significantly dysregulated in PPO-KO clones (localized above the curves drawn in Perseus with parameters FDR 0.05, s0 0.1.) are marked in red. (b) Expression levels of PPO (position marked by arrow) and ALAS-1 were determined by Western blotting of cell lysates separated by SDS-PAGE. Alpha-tubulin was used as a loading control.
Figure 4
Figure 4
Analysis of OXPHOS (super)complexes. Protein complexes were extracted from cells by digitonin treatment and 20 µg of total proteins from each sample were separated by BN-PAGE and electroblotted onto a PVDF membrane. Antibodies specific for NDUFB8, SDHA, UQCRC2, MT-CO1 and ATP5F1B were used for detection of the complex CI, CII, CIII, CIV and CV, respectively. Signals of CII and CV were considered as loading controls.
Figure 5
Figure 5
Analysis of mitochondrial respiration and glycolytic function. Oxygen consumption rate (a) and extracellular acidification rate (b) were estimated in PPO-KO clones and PPO knock-in cell lines by Seahorse extracellular flux analyzer. (a) ATP production, maximal respiration and spare respiratory capacity was driven by sequential treatment with 1 µM oligomycin, 1 µM CCCP, and 0.5 µM rotenone + 0.5 µM antimycin, respectively. (b) Basal glycolysis, glycolytic capacity and glycolytic reserve was induced by 10 mM glucose, 1 µM oligomycin, and 50 mM 2-deoxyglucose, respectively. Statistical significance was calculated by unpaired parametric t-test with Welch’s correction and assigned by ***(P < 0.001), **(P < 0.01), *(P < 0.05) and ns (non-significant; P > 0.05).
Figure 6
Figure 6
Characterization of PPO knock-in clones. R38/1, W227/1, U-2 OS, and N2 cell lines were transfected with the PPOX-GFP construct and corresponding knock-in cell lines denoted R38/1-KI, W227/1-KI, U-2 OS-KI and N2-KI, respectively. Control, PPO-KO and PPO-KI samples are highlighted by green, orange and blue background, respectively. (a) Expression levels of PPO-GFP and ALAS-1 were analyzed by Western blotting. Notice markedly higher PPO-GFP expression levels compared to endogenous PPO. Alpha-tubulin was used as a loading control. (b) PPO enzymatic activity in cell lysates was determined by following conversion of protoporphyrinogen IX to protoporphyrin IX. PPO oxidase activity is shown as ratio to the endogenous PPO activity in parent U-2 OS cells (100%). Data represent mean (± S.D.); n = 2. (c) Localization of PPO-GFP (green channel) was assessed by live-cell confocal microscopy. Mitochondria were visualized by vital staining using Mitotracker dye (red channel), cell nuclei were stained by Hoechst 33258 (blue channel). Scale bar 10 µm. (d) Intracellular concentrations of heme and protoporphyrinogen/protoporphyrin IX were determined by RP-HPLC. Data represent mean (± S.D.); n = 2. (e) The oxygen consumption rate was measured by Seahorse. ATP production, maximal respiration, and spare respiratory capacity were determined upon the addition of 1 µM oligomycin, 1 µM CCCP, and 0.5 µM rotenone + 0.5 µM antimycin A, respectively. Statistical significance was calculated by one-way ANOVA and assigned by ***(P < 0.001), **(P < 0.01), *(P < 0.05) and ns (non-significant; P > 0.05).

Similar articles

Cited by

References

    1. Heinemann IU, Jahn M, Jahn D. The biochemistry of heme biosynthesis. Arch. Biochem. Biophys. 2008;474:238–251. doi: 10.1016/j.abb.2008.02.015. - DOI - PubMed
    1. Phillips JD. Heme biosynthesis and the porphyrias. Mol. Genet. Metab. 2019;128:164–177. doi: 10.1016/j.ymgme.2019.04.008. - DOI - PMC - PubMed
    1. Hamza I, Dailey HA. One ring to rule them all: Trafficking of heme and heme synthesis intermediates in the metazoans. Biochim. Biophys. Acta. 1823;1617–1632:2012. doi: 10.1016/j.bbamcr.2012.04.009. - DOI - PMC - PubMed
    1. Swenson SA, et al. From synthesis to utilization: The ins and outs of mitochondrial heme. Cells. 2020 doi: 10.3390/cells9030579. - DOI - PMC - PubMed
    1. Chiabrando D, Vinchi F, Fiorito V, Mercurio S, Tolosano E. Heme in pathophysiology: A matter of scavenging, metabolism and trafficking across cell membranes. Front. Pharmacol. 2014 doi: 10.3389/fphar.2014.00061. - DOI - PMC - PubMed

Publication types