. 2022 Nov;27(11):4485-4501.
doi: 10.1038/s41380-022-01791-5. Epub 2022 Oct 12.

Deletion of Crtc1 leads to hippocampal neuroenergetic impairments associated with depressive-like behavior

Affiliations

Deletion of Crtc1 leads to hippocampal neuroenergetic impairments associated with depressive-like behavior

Antoine Cherix et al. Mol Psychiatry. 2022 Nov.

Abstract

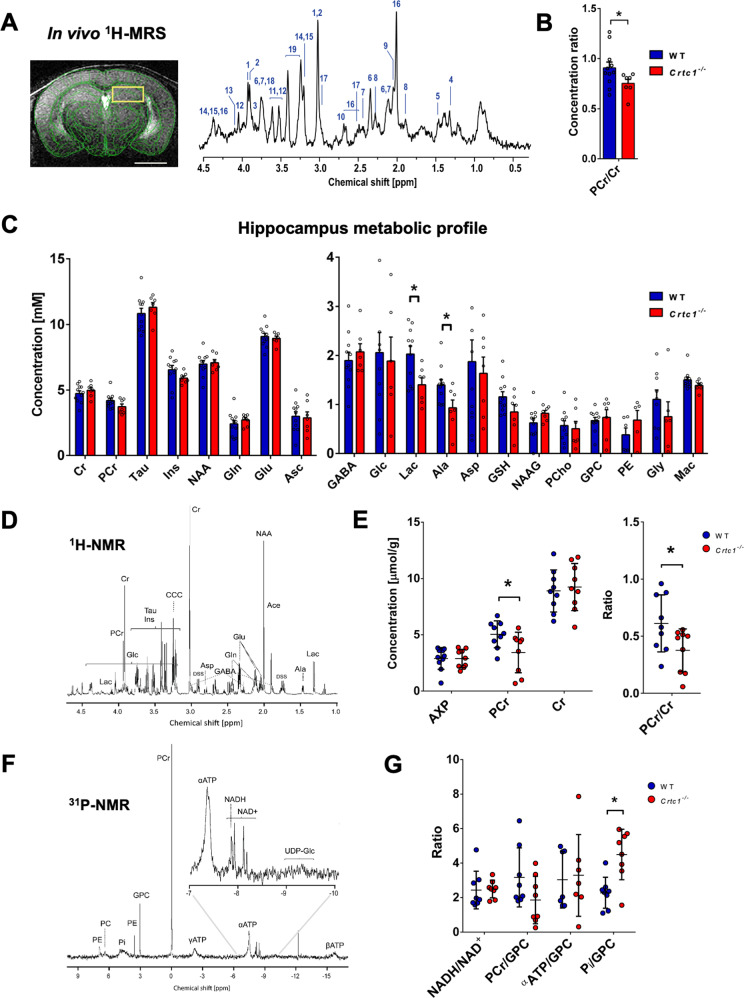
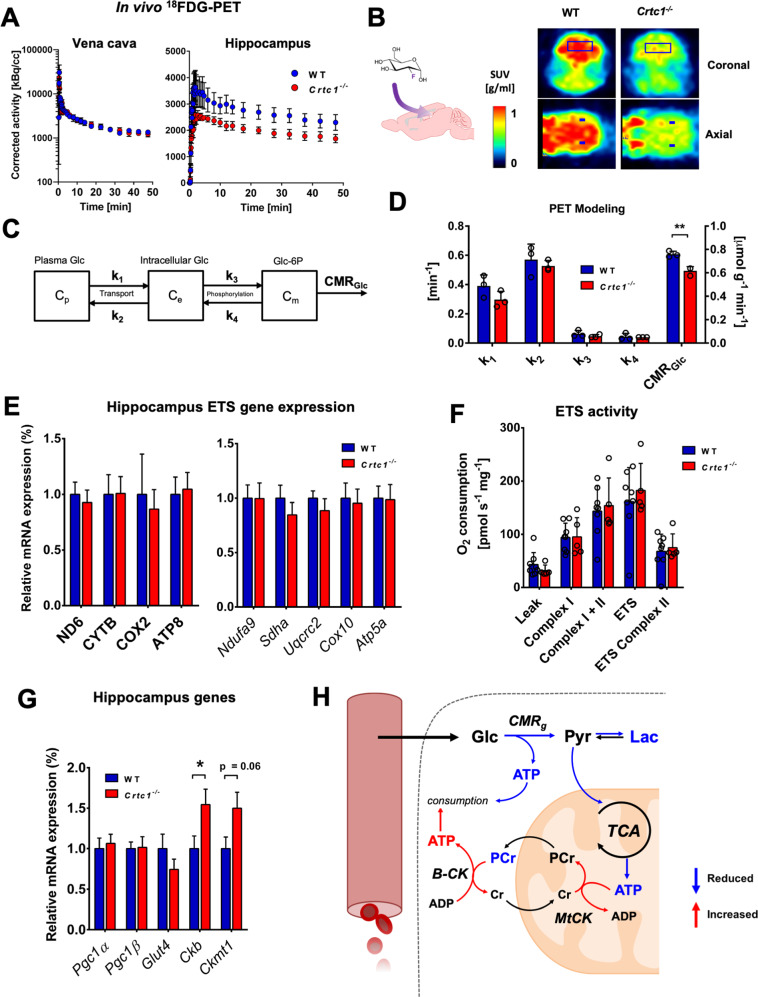
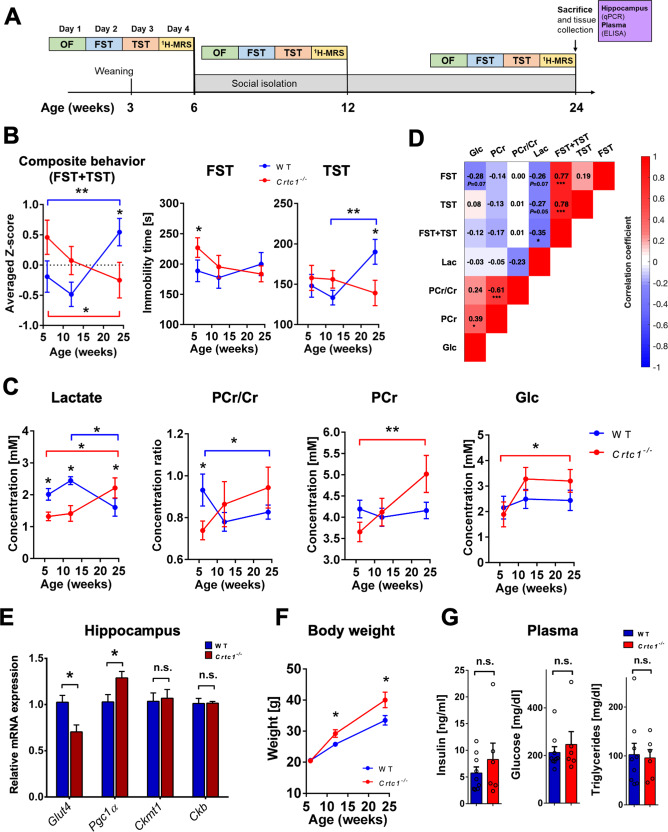
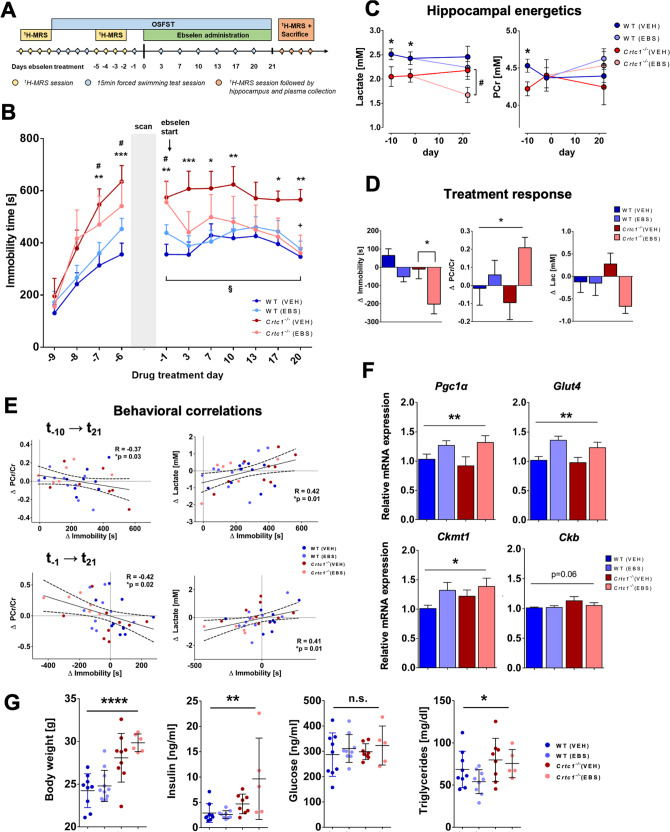
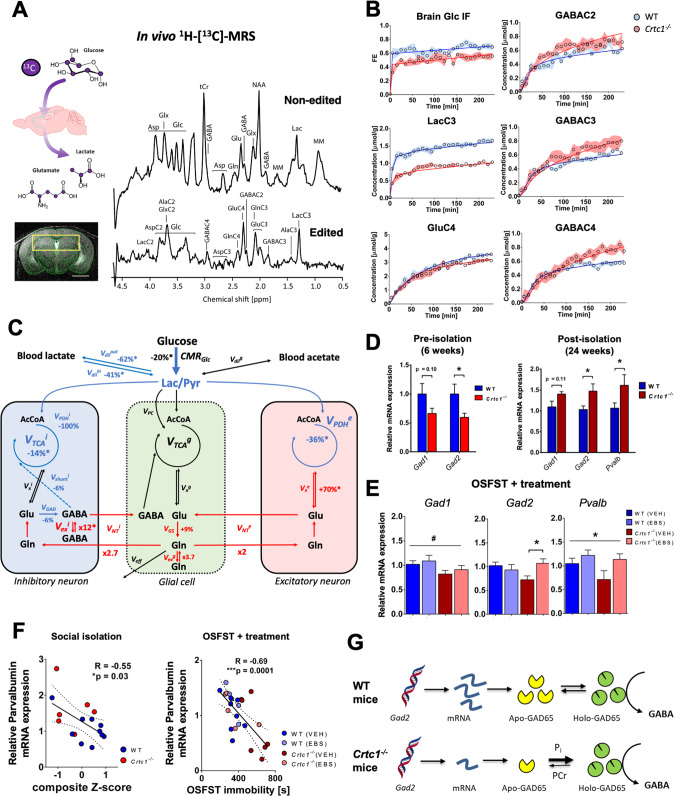
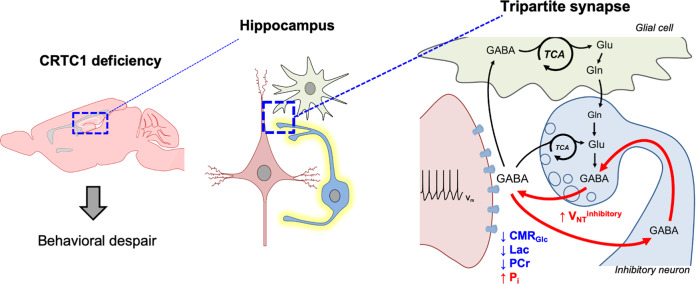
Mood disorders (MD) are a major burden on society as their biology remains poorly understood, challenging both diagnosis and therapy. Among many observed biological dysfunctions, homeostatic dysregulation, such as metabolic syndrome (MeS), shows considerable comorbidity with MD. Recently, CREB-regulated transcription coactivator 1 (CRTC1), a regulator of brain metabolism, was proposed as a promising factor to understand this relationship. Searching for imaging biomarkers and associating them with pathophysiological mechanisms using preclinical models can provide significant insight into these complex psychiatric diseases and help the development of personalized healthcare. Here, we used neuroimaging technologies to show that deletion of Crtc1 in mice leads to an imaging fingerprint of hippocampal metabolic impairment related to depressive-like behavior. By identifying a deficiency in hippocampal glucose metabolism as the underlying molecular/physiological origin of the markers, we could assign an energy-boosting mood-stabilizing treatment, ebselen, which rescued behavior and neuroimaging markers. Finally, our results point toward the GABAergic system as a potential therapeutic target for behavioral dysfunctions related to metabolic disorders. This study provides new insights on Crtc1's and MeS's relationship to MD and establishes depression-related markers with clinical potential.


Conflict of interest statement

The authors declare no competing interests.

Figures

Fig. 1
Fig. 1. Deletion of Crtc1 is associated with a neuroimaging fingerprint of reduced hippocampal neuroenergetics.
A T2-weighted image acquired for localized MRS (VOI including dorsal hippocampus: yellow rectangle), with a scale bar of 2 mm (left) and typical 1H-MRS spectrum acquired in the dorsal hippocampus (DH) of 6 weeks old mice at 14.1 Tesla (right). Metabolites in the spectrum include: 1. phosphocreatine (PCr), 2. creatine (Cr), 3. glucose (Glc), 4. lactate (Lac), 5. alanine (Ala), 6. glutamate (Glu), 7. glutamine (Gln), 8. γ-aminobutyric acid (GABA), 9. N-acetylaspartyl-glutamate (NAAG), 10. aspartate (Asp), 11. glycine (Gly), 12. myo-inositol (Ins), 13. phosphoethanolamine (PE), 14. glycerophosphorylcholine (GPC), 15. phosphorylcholine (PCho), 16. N-acetyl-aspartate (NAA), 17. glutathione (GSH), 18. ascorbate (Asc), 19. taurine (Tau) as well as macromolecules (mac). Spectrum is shown with 3Hz exponential apodization. B, C Quantification of DH neurochemical profile from 1H-MRS in wild-type (WT; n = 10) and Crtc1−/− (n = 6) mice, *p < 0.05, unpaired Student’s t test. Data are shown as mean ± s.e.m. D Typical high-resolution 1H-NMR spectrum of DH extracts acquired at 600 MHz with E quantification of AXP (sum of AMP, ADP and ATP), PCr and Cr in wild-type (n = 8) and Crtc1−/− (n = 8) mice, *p < 0.05, Mann–Whitney test. F Typical high-resolution 31P-NMR spectrum of DH extracts with G quantification of NADH/NAD+ ratio as well as PCr, α-ATP and inorganic phosphate (Pi) relative to the GPC resonance in wild-type (n = 8) and Crtc1−/− (n = 8) mice, *p < 0.05, Mann–Whitney test. All high-resolution data (E and G) are shown as mean ± s.d.
Fig. 2
Fig. 2. Deletion of Crtc1 impacts hippocampal glycolytic metabolism with subsequent mitochondrial allostatic load.
AC In vivo 18FDG-PET results show reduced glycolytic activity in the hippocampus of in Crtc1−/− mice compared to wild-type (WT) mice. A Time course of the radioactive decay-corrected activity, to the start of the acquisition, for vena cava (left) and hippocampus (right) in wild-type (n = 3) and Crtc1−/− (n = 3) mice. B Schematic of brain 18FDG uptake (left) and heat-maps of standard uptake values (SUVs) at steady-state (last 5 min) after 18FDG delivery in one Crtc1−/− and wild-type mouse (right). C Mathematical model used for assessing glucose entry and metabolism from PET data. Glucose (Glc) is in exchange between one plasma (Cp) and one intracellular (Ce) pool with kinetic constants k1 and k2. A glucose-6-phosphate (Glc-6P) pool (Cm) is produced from phosphorylation of intracellular Glc via kinetic constants k3 and k4. Glc-6P is then further metabolized through glycolysis, referred to here as the “cerebral metabolic rate of glucose” (CMRGlc), D Glucose metabolism parameter estimates from mathematical modeling of hippocampal 18FDG-PET data. **p < 0.005, unpaired Student’s t test. EG Mitochondrial status is not directly affected by deletion of Crtc1. E Relative electron transfer system (ETS) gene expression in dorsal hippocampus of wild-type (n = 9) and Crtc1−/− (n = 7) mice. mtDNA-encoded: ND6, complex I; CYTB, complex II; COX2, complex IV; ATP8, complex V. nDNA-encoded: Ndufa9, complex I; Sdha, complex II; Uqcrc2, complex III; Cox10, complex IV; Atp5a, complex V. F Mitochondrial respirometry in dorsal hippocampus of wild-type (n = 8) and Crtc1−/− (n = 5) mice. G Mitochondrial gene expression in dorsal hippocampus of wild-type (n = 9) and Crtc1−/− (n = 8) mice. Pgc1α and β, Peroxisome proliferator-activated receptor gamma coactivator 1 alpha and beta; Ckb, creatine kinase B-type; Ckmt1, creatine kinase mitochondrial type. H Schematic representation of hippocampal mitochondrial allostatic load. Reduced glycolytic function leads to fewer pyruvate available for oxidation in the mitochondria. The resulting lack of ATP produced from mitochondria and glycolysis is compensated by higher PCr hydrolysis, which helps buffer ATP depletion to maintain homeostasis and potentially stimulated by the upregulation of creatine kinases expression. Glc glucose, Pyr pyruvate, B-CK cytoplasmic creatine kinase, MtCK mitochondrial creatine kinase. All data are shown as mean ± s.e.m.
Fig. 3
Fig. 3. Hippocampal neuroenergetic status reflects the depressive-like behavior of Crtc1−/− mice.
A Experimental design, and timeline of the longitudinal protocol used involving social isolation. Wild-type (WT; n = 10) and Crtc1−/− (n = 6) mice underwent a set of behavioral tests including an open-field test (OF; day 1), a forced swim test (FST; day 2) and a tail-suspension test (TST; day 3) followed by a 1H-MRS scan on day 4. After this first set of experiments, animals were isolated at the age of 6 weeks and the whole procedure was repeated at 12 and 24 weeks of age. After the last 1H-MRS scan, animals were sacrificed, and hippocampal and plasma samples were collected for analysis. B A switch in depressive-like behavior between Crtc1−/− and wild-type mice occurs after 18 weeks of social isolation as revealed by the inversion in immobility time in TST (right panel; Interaction: F2,28 = 5.16, p = 0.012), FST (center panel; Interaction: F2,28 = 3.87, p = 0.035) and averaged z-score of TST and FST (left panel; Interaction: F2,28 = 10.26, p = 0.0005). Two-way ANOVA, followed by Fisher LSD post hoc test; *p < 0.05, **p < 0.01. C Hippocampal neuroenergetic profile switches between Crtc1−/− and wild-type mice at the end of 18 weeks of isolation as revealed by the inversion of lactate concentration (left panel; Interaction: F2,28 = 7.32, p = 0.003), PCr/Cr ratio (center left panel; Interaction: F2,28 = 2.79, p = 0.08) and PCr (center right panel; Interaction: F2,28 = 4.78, p = 0.017). Hippocampal glucose levels increased in the Crtc1−/− group only at the end of the 18 weeks of isolation (Time effect: F2,28 = 3.43, p = 0.050). Two-way ANOVA, followed by Bonferroni’s post hoc test; *p < 0.05, **p < 0.01. D Correlative analysis between depressive-like behavior and hippocampal energy metabolite content. A significant negative correlation between Lac and behavior was found when results from FST and TST were considered together (R = −0.351, p = 0.013). Color code represents Pearson’s correlation coefficient and the analysis included all longitudinal age time points. Pearson’s Rs are shown for each correlation with associated p value (uncorrected for multiple comparisons); *p < 0.05, ***p < 0.0001. E At the end of 18 weeks of isolation, hippocampal levels of Pgc1α mRNA were higher while Glut4 levels were lower in Crtc1−/− as compared to wild-type mice. Mitochondrial and cytoplasmic creatine kinases were not significantly different (n.s.) between the two groups. Unpaired Student’s t test, *p < 0.05. F Body weight of all animals increased significantly over time (Time effect: F2,28 = 123.2, p < 0.0001) but increased more in the Crtc1−/− group (Genotype effect: F1,14 = 5.84, p = 0.030; Interaction: F2,28 = 5.11, p = 0.013). Two-way ANOVA followed by Fisher LSD post hoc test *p < 0.05. G Plasma markers of metabolic syndrome (insulin, glucose and triglycerides) were high in both groups but not significantly different from each other (n.s.).
Fig. 4
Fig. 4. Restoring hippocampal energy balance with energy-boosting ebselen mood stabilizer rescues depressive-like behavior in Crtc1−/− mice.
A Experimental design, and timeline of the ebselen treatment protocol during open-space forced swim test (OSFST). First, animals underwent a single basal 1H-MRS scan (during days −13 to −10), followed by 4 consecutive forced swimming sessions (day −9 to −6). During days −5 to −2, animals underwent a second 1H-MRS scan and a fifth swimming session on day −1, prior to the treatment start. Animals were administered ebselen (wild-type(EBS), n = 8; Crtc1−/−(EBS), n = 6) or vehicle (wild-type(VEH), n = 9; Crtc1−/−(VEH), n = 9) twice daily from day 0 and until the end of the OSFST protocol (day 21), while swimming sessions were repeated regularly every 3–4 days. A final 1H-MRS scan was performed at the end of the study (between days 22–25), with subsequent hippocampal and plasma collection for analyses. B Depressive-like behavior in the OSFST was higher in the Crtc1−/− mice (Genotype effect: F1,10 = 65.09, p < 0.0001) but reduced by ebselen (Treatment effect: F1,10 = 5.45, p = 0.04, interaction: F1,10 = 41.84, p < 0.0001). Immobility of all Crtc1−/− mice was increased after the first 4 days swimming session (**p < 0.01, ***p < 0.005 for VEH and #p < 0.05 for EBS vs. their respective wild-type group). Depressive-like behavior of Crtc1−/− VEH group remained significantly higher than wild-type over the 21 days of test (*p < 0.05, **p < 0.01 and ***p < 0.005 for VEH Crtc1−/− vs. VEH wild-type). After the 21 days of OSFST, the depressive-like behavior of the treated Crtc1−/− animals was significantly reduced (+p < 0.05 compared to Crtc1−/− VEH at day 20 and §p < 0.05 compared to Crtc1−/− EBS at day 0). Two-way ANOVA for repeated measures, followed by Fisher LSD post hoc test. C Hippocampal energy metabolite concentrations during the OSFST protocol. Lactate and PCr content were lower in Crtc1−/− animals relative to wild-type animals under basal conditions (days −13 to −10; Unpaired Student’s t test, *p < 0.05; wild-type, n = 22; Crtc1−/−, n = 16), but only lactate remained lower in Crtc1−/− animals after ebselen treatment (days 22–25; Unpaired Student’s t test, #p < 0.05; wild-type(EBS), n = 8; Crtc1−/−(EBS), n = 6). D Ebselen treatment reduced depressive-like behavior and increased hippocampal high-energy phosphate content (difference between day 21 and day 0). Ebselen treatment increased the PCr/Cr ratio (Treatment effect: F1,31 = 4.41, *p = 0.044, two-way ANOVA) and tended to reduce lactate (Treatment effect: F1,31 = 3.49, p = 0.071, two-way ANOVA), together with immobility reduction (Treatment effect: F1,31 = 13.7, p = 0.0008; Genotype effect: F1,31 = 7.30, p = 0.011; two-way ANOVA, followed by Bonferroni’s test, *p < 0.05). E (top) The increase in immobility from baseline (day −10) as a result of OSFST (day 21) correlated with a reduction in PCr/Cr (R = −0.37, *p = 0.03) and rise in lactate (R = 0.42, *p = 0.01). (bottom) Immobility reduction (from day −1) as a result of treatment (day 21) correlated with a rise in PCr/Cr (R = −0.42, *p = 0.02) and a drop of lactate (R = 0.41, *p = 0.01). F Ebselen induced expression of energy-related genes in hippocampus. Treated animals had higher mRNA level of Pgc1α (Treatment effect: F1,27 = 13.28, **p = 0.0087), Glut4 (F1,27 = 8.22, **p = 0.0011) and Ckmt1 (F1,27 = 4.79, *p = 0.037). Relative cytoplasmic creatine kinase (Ckb) expression tend to increase in Crtc1−/− mice at the end of the OSFST protocol (Genotype effect: Ckb: F1,27 = 3.78, p = 0.06; Ckmt1: F1,27 = 1.59, p = 0.21). Two-way ANOVA. G Crtc1−/− showed significantly higher body weight (Genotype effect: F1,31 = 37.7, ****p < 0.0001), plasma insulin (F1,27 = 12.24, **p < 0.0016) and triglyceride levels (F1,27 = 4.78, *p = 0.038) at the end of the OSFST protocol, with not treatment effect (n.s.). Two-way ANOVA; n.s. not significant. Data are reported as mean ± s.e.m.
Fig. 5
Fig. 5. GABAergic dysfunction links impaired hippocampal glucose metabolism with depressive-like behavior in Crtc1−/− susceptible mice.
A Schematic of 13C-labeled glucose brain uptake and subsequent metabolite labeling (upper left) 1H-[13C]-MRS spectra acquired in the bilateral dorsal hippocampus of a 6 weeks old WT mouse (right) as shown with the selected VOI (yellow box) on the associated MRI image (lower left). The non-edited spectrum (top) shows the total metabolic profile, while the edited spectrum (bottom) identifies the fraction of metabolites that have incorporated 13C-labeling. Scale bar = 2 mm. B Fractional isotopic 13C-enrichment (FE) of glucose and key metabolites in the hippocampus during 1H-[13C]-MRS experiment. Fitting of the data with a pseudo 3-compartment model of brain glucose metabolism is shown with a straight line for wild-type (WT; in blue) and Crtc1−/− (in red) mice. 6 weeks old wild-type (n = 8) and Crtc1−/−(n = 8). Data presented as mean ± s.d. C Schematic representation of hippocampal glucose utilization differences between wild-type and Crtc1−/− mice after metabolic flux analysis using a pseudo 3-compartment model. Metabolic fluxes that were higher in Crtc1−/− animals (compared to their wild-type littermates) are shown in red, while those found lower are shown in blue and those found without any difference or fixed during the modeling remain in black. Cerebral metabolic rate of glucose (CMRGlc); brain lactate influx (Vdilin) and outflux (Vdilout) from blood; pyruvate dilution flux (Vdilg); excitatory neuron TCA cycle (VPDHe); inhibitory neuron pyruvate dehydrogenase activity (VPDHi); GABA shunt flux (Vshunti); inhibitory neuron TCA cycle (VTCAi = VPDHi + Vshunti); glial pyruvate carboxylase (VPC); glial TCA cycle (VTCAg); excitatory neuron (Vxe), inhibitory neuron (Vxi) and glial (Vxg) transmitochondrial fluxes; excitatory neurotransmission flux (VNTe); inhibitory neurotransmission flux (VNTi); glutamate decarboxylase activity (VGAD); Gln exchange flux (Vexg); GABAergic exchange flux (Vexi); glutamine synthetase activity (VGS) and Gln efflux (Veff). Relative flux increase/decrease is indicated for Crtc1−/− mice compared to WT littermates, as calculated from fluxes in µmol/g/min from Fig. S5C; and an asterisk (*) indicates a statistically significant difference between the two groups. D GABAergic gene expression (Gad1, Gad2 and parvalbumin (Pvalb)) in the hippocampus under basal conditions (6 weeks age; left) or after social isolation (24 weeks age; right). Unpaired Student’s t test, *p < 0.05; basal, wild-type (n = 6) and Crtc1−/− (n = 6); longitudinal, wild-type (n = 10) and Crtc1−/− (n = 6). E Hippocampal gene expression of Gad1, Gad2 and Pvalb after the OSFST protocol (wild-type(VEH), n = 9; wild-type(EBS), n = 8; Crtc1−/−(VEH), n = 9; Crtc1−/−(EBS), n = 6). Gad1 was significantly reduced in the Crtc1−/− group (Genotype effect: F1,28 = 4.39, *p = 0.045, two-way ANOVA), while ebselen treatment increased the levels of Gad2 (Interaction: F1,27 = 5.53, *p = 0.026, two-way ANOVA; *p < 0.05, Bonferroni’s post hoc test) and parvalbumin (Treatment effect: F1,24 = 4.28, *p = 0.049, two-way ANOVA). F Correlation between depressive-like behavior and level of Pvalb expression in the hippocampus after social isolation (left; 24 weeks of age; R = −0.55, p = 0.03) and OSFST protocols (right; 10 weeks of age; R = −0.69, p = 0.0001). The dotted lines represent the 95% confidence interval of the linear regression line. G Scheme of potential relation between GAD expression level, energy metabolite binding and enzyme activity.
Fig. 6
Fig. 6. Scheme of hippocampal GABAergic hyperactivity resulting from low energetic status linking Crtc1 deletion to depressive-like behavior.
Reduced hippocampal glucose metabolism capacity relative to neuronal neurotransmitter cycling-demands leads to low energetic status (high inorganic phosphate (Pi) and low phosphocreatine (PCr) levels) in Crtc1 deficient mice. This results in excessive GABAergic neurotransmitter cycling and depressive-like behavior.

Similar articles

Cited by

References

    1. Friedrich MJ. Depression is the leading cause of disability around the world. JAMA. 2017;317:1517. - PubMed
    1. Mathers C, Fat DM, Boerma JT The global burden of disease: 2004 update. Geneva: World Health Organization; 2008.
    1. Li X, Frye MA, Shelton RC. Review of pharmacological treatment in mood disorders and future directions for drug development. Neuropsychopharmacology. 2012;37:77–101. doi: 10.1038/npp.2011.198. - DOI - PMC - PubMed
    1. Lenzenweger MF. Endophenotype, intermediate phenotype, biomarker: definitions, concept comparisons, clarifications. Depress Anxiety. 2013;30:185–9. - PubMed
    1. Hasler G, Northoff G. Discovering imaging endophenotypes for major depression. Mol Psychiatry. 2011;16:604–19. doi: 10.1038/mp.2011.23. - DOI - PubMed