. 2022 Dec;27(12):5070-5085.
doi: 10.1038/s41380-022-01804-3. Epub 2022 Oct 12.

Analysis of hyperforin (St. John's wort) action at TRPC6 channel leads to the development of a new class of antidepressant drugs

Affiliations

Analysis of hyperforin (St. John's wort) action at TRPC6 channel leads to the development of a new class of antidepressant drugs

Yamina El Hamdaoui et al. Mol Psychiatry. 2022 Dec.

Abstract

St. John's wort is an herb, long used in folk medicine for the treatment of mild depression. Its antidepressant constituent, hyperforin, has properties such as chemical instability and induction of drug-drug interactions that preclude its use for individual pharmacotherapies. Here we identify the transient receptor potential canonical 6 channel (TRPC6) as a druggable target to control anxious and depressive behavior and as a requirement for hyperforin antidepressant action. We demonstrate that TRPC6 deficiency in mice not only results in anxious and depressive behavior, but also reduces excitability of hippocampal CA1 pyramidal neurons and dentate gyrus granule cells. Using electrophysiology and targeted mutagenesis, we show that hyperforin activates the channel via a specific binding motif at TRPC6. We performed an analysis of hyperforin action to develop a new antidepressant drug that uses the same TRPC6 target mechanism for its antidepressant action. We synthesized the hyperforin analog Hyp13, which shows similar binding to TRPC6 and recapitulates TRPC6-dependent anxiolytic and antidepressant effects in mice. Hyp13 does not activate pregnan-X-receptor (PXR) and thereby loses the potential to induce drug-drug interactions. This may provide a new approach to develop better treatments for depression, since depression remains one of the most treatment-resistant mental disorders, warranting the development of effective drugs based on naturally occurring compounds.


Conflict of interest statement

The authors declare no competing interests.

Figures

Fig. 1
Fig. 1. TRPC6 KO mice exhibit anxious and depressive behavior compared to wild-type (WT) mice.
AD Behavior in the open field test. E, F Behavior in the elevated plus maze test (OA open arm, CA closed arm, Ctr center). G Behavior in the forced swim test. H Sucrose preference test. Data are expressed as means ± s.e.m. (n = 14 per group; *p < 0.05, **/#P < 0.001, ***/$P < 0.001 vs WT).
Fig. 2
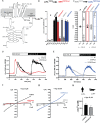
Fig. 2. Reduced hippocampal cell excitability in TRPC6 KO mice.
Whole-cell current-clamp recordings were performed from hippocampal CA1 pyramidal cells and dentate gyrus granule cells in brain slice preparation. Action potentials (APs) were evoked with a depolarizing ramp pulse from 0 to 100 pA for 2 s from resting membrane potential (RMP) or −70 mV (adjusted by current injection). A Voltage traces from CA pyramidal cells from a WT and a TRPC6 KO slice illustrate the evoked APs. The dashed line indicates −70 mV and the gray lines below show the ramp protocol. Histograms summarize the number of APs per ramp (B) and the rheobase (the minimal current necessary to elicit first AP; C in WT and TRPC6 KO hippocampal cells. *p < 0.05; **p < 0.01.
Fig. 3
Fig. 3. Loss of hyperforin-induced excitation in dentate gyrus granule cells of TRPC6 KO mice.
A–C Whole-cell current-clamp recording of granule cells show effects of hyperforin (3 µM) on evoked APs (A, C) and on membrane potential (B). Dashed lines indicate −70 mV, depolarizing ramp was 0–70 pA for WT granule cell and 0–100 pA for TRPC6 KO cell. The hyperforin-induced biphasic response in wt slices was preserved after blocking fast synaptic transmission with kynurenic acid (KA) and picrotoxin (PTX) (C). D, E Voltage-clamp recordings (held at −70 mV) illustrate loss of hyperforin-induced initial inward current in neurons from TRPC6 KO mice (D). The remaining outward current involves K+ channels, as indicated by the loss of current with CsGlu-filled pipette (E). ***p < 0.001.
Fig. 4
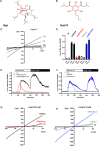
Fig. 4. Identification of the hyperforin binding site at TRPC6 channels.
A The topology model of human TRPC6 (hTRPC6) shows α-helices in cylinders and dashed lines describe region with not sufficient density in CryoEM structure PDB: 6uz8. Potential hyperforin bindings site is marked with a red star. B Sketch demonstrating that amino acids LLKL were mutated in hTRPC6 into the respective amino acids IMRI of hTRPC3 to block hyperforin-mediated TRPC6 activation. In a second step, the amino acids IMRI in hTRPC3 were mutated into the corresponding amino acids LLKL of hTRPC3 to induce a hyperforin-sensitive hTRPC3 channel. hTRPC6 (black), TRPC6mut = IMRITRPC6mut (red), hTRPC3 (gray), TRPC3mut = LLKLTRPC3mut. C Single-cell Ca2+ imaging was conducted in HEK293 cells transiently expressing pcDNA3.1 plasmid vector with DNA coding only for eYFP (ctl, white), hTRPC6 (black), hTRPC6mut (red), hTRPC3 (gray), or hTRPC3mut (blue) all expressed as C-terminal eYFP fusion proteins. Cells were stimulated with the solvent DMSO (0.1%), OAG (100 µM) or hyperforin (10 µM) and intracellular Ca2+ alterations were detected using fura-2 AM (n = 7–9 ± SEM, cells were selected according to their eYFP fluorescence and their OAG sensitivity; Statistical significance was analyzed by ANOVA with post hoc Dunnett’s test ***p < 0.001) C Whole-cell currents were recorded from HEK293 cells transiently expressing eYFP (ctl, white), hTRPC6 (black), hTRPC6mut (red), hTRPC3 (gray), or hTRPC3mut (blue) all expressed as C-terminal eYFP fusion proteins. Mean current density are depicted at +100 and −100 mV after application of hyperforin (10 µM). Currents were normalized to the basic currents before compound application were subtracted (n = 3 ± SEM¸ Statistical significance was analyzed by ANOVA with post hoc Dunnett’s test ***p < 0.001). D Representative time traces were monitored in HEK293 ctl cells (dashed line), hTRPC6-expressing HEK293 cells (black) or hTRPC6mut (red) stimulated with OAG (100 µM) 60 s after starting the experiment and after 300 s hyperforin (10 µM) was applied. E Representative time traces were monitored in HEK293 ctl cells (dashed line), hTRPC3-expressing HEK293 cells (gray) or hTRPC3mut (blue) stimulated with OAG (100 µM) 60 s after starting the experiment and after 300 s hyperforin (10 µM) was applied. F Whole-cell currents recorded from HEK293 ctl cells (dashed line), hTRPC6-expressing HEK293 cells (black) or hTRPC6mut (red). Application of hyperforin (10 µM) resulted in an increase in outward and inward current in hTRPC6 expressing cells. This effect is lost in TRPC6mut expressing cells. G Whole-cell currents recorded from HEK293 ctl cells (dashed line), hTRPC3-expressing HEK293 cells (gray) or hTRPC3mut (blue). Application of hyperforin (10 µM) showed no effect in ctl and hTRPC3 expressing cells but resulted in an increase in outward and inward current in hTRPC3mut expressing cells. H The hyperforin binding site LLKL at human hTRPC6 differs in the last amino acid from rat and mouse TRPC6 LLKF. To test if this amino acid interferes with hyperforin binding to TRPC6, we compared hTRPC6 with hTRPC6 LLKF. Single-cell calcium imaging was conducted in HEK239 cells transiently expressing hTRPC6 or hTRPC6 LLKF. Cells were stimulated with hyperforin (10 µM) and Fura-2-AM 340/380 nm ratio changes were analyzed and afterward converted into intracellular Ca2+ in nM. No significant differences were observed (n = 3 ± SEM, cells were selected according to their eYFP fluorescence; statistical significance was calculated using unpaired t-test, not significant 0.0576).
Fig. 5
Fig. 5. Interaction studies of TRPC6 C-terminal peptides with hyperforin and membranes.
CD spectra of wild-type TRPC6 peptides in the absence and presence of hyperforin (A). Laurdan fluorescence measurement to monitor membrane fluidity changes caused by hyperforin (white bars), TRPC6 peptide (black bars), and TRPC6mut peptide (red bars) (B). Amino acid sequences from TRPC6 and TRPC6mut are shown in (C). Differences between the two sequences are underlined. Tryptophan fluorescence using residue W782 as a reporter of TRPC6 (D) and TRPC6mut titrated with hyperforin (E). Fluorescence maxima (vertical black line in D and E) were blotted against hyperforin concentration and normalized against fluorescence maxima without hyperforin (F).
Fig. 6
Fig. 6. Characterization of the simplified hyperforin-derivative Hyp13.
Chemical structure of hyperforin (A) and Hyp13 (B). The phloroglucinol core structure is highlighted in red. (C) Concentration dependent effect of Hyp13 in HEK293 cells expressing hTRPC6 channels in whole cell patch clamp experminents. D Hyp13 also interacts to the LLKL binding motif at TRPC6. Single-cell Ca2+ imaging was conducted in HEK293 cells transiently expressing pcDNA3.1 plasmid vector with DNA coding only for eYFP (ctl, white), hTRPC6 (black), hTRPC6mut (red), hTRPC3 (gray), or hTRPC3mut (blue) all expressed as C-terminal eYFP fusion proteins. Cells were stimulated with the hyperforin (10 µM) or Hyp13 (10 µM) and intracellular Ca2+ alterations were detected using fura-2 AM (n = 7–9 ± SEM, cells were selected according to their eYFP fluorescence and their OAG sensitivity). E Representative time traces were monitored in HEK293 ctl cells (dashed line), hTRPC6-expressing HEK293 cells (black) or hTRPC6mut (red) stimulated with OAG (100 µM) 60 s after starting the experiment and after 300 s hyperforin (10 µM) was applied. F Representative time traces were monitored in HEK293 ctl cells (dashed line), hTRPC3-expressing HEK293 cells (gray) or hTRPC3mut (blue) stimulated with OAG (100 µM) 60 s after starting the experiment and after 300 s hyperforin (10 µM) was applied. G Whole-cell currents recorded from HEK293 ctl cells (dashed line), hTRPC6-expressing HEK293 cells (black) or hTRPC6mut (red). Application of Hyp13 (10 µM) resulted in an increase in outward and inward current in hTRPC6 expressing cells. This effect is lost in TRPC6mut expressing cells. H Whole-cell currents recorded from HEK293 ctl cells (dashed line), hTRPC3-expressing HEK293 cells (gray) or hTRPC3mut (blue). Application of Hyp13 (10 µM) showed no effect in ctl and hTRPC3 expressing cells but resulted in an increase in outward and inward current in hTRPC3mut expressing cells.
Fig. 7
Fig. 7. Hyp13 does not activate PXR.
Induction of PXR activity by hyperforin and its derivate in HepG2 cells (A). HepG2 cells were co-transfected with plasmids expressing GAL4-responsive UAS-driven firefly luciferase, human PXR-LBD fused to GAL4-DBD, and Renilla luciferase. The transfected cells were exposed to 10 µM of positive controls rifampicin and SR12813 or different concentrations of hyperforin and its derivate. After 24 h, cell lysates were assayed for firefly and Renilla luciferase activity. Firefly luciferase activity was normalized against Renilla luciferase activity and fold induction relative to the solvent control (SC 0.5% DMSO) was calculated. Data are presented as means ± SD of three independent experiments performed with six replicates each. B Gene expression analysis of CYP3A4. Differentiated HepaRG cells were exposed to hyperforin and its derivate as well 10 µM Rifampicin (PC) for 24 h. Total mRNA was isolated and transcribed into cDNA and subsequently mRNA expression of CYP3A4 was analyzed by real-time qPCR. For relative quantification, Ct values were normalized to reference genes (ACTB and GAPDH) according to the ΔΔCT method. Log2 fold changes of 2−ΔΔCT values were calculated and mRNA levels were expressed in relation to the solvent control (SC 0.5% DMSO). Data are presented as means ± SD of two to three independent experiments.
Fig. 8
Fig. 8. TRPC6 channels are essential for Hyp13-mediated anxiolytic effects.
Anxiolytic effects of Hyp13 (Hyp) are TRPC6 dependent. Anxiolytic effects were shown in the open field test as measured by the A center time, B center entries, and C center locomotion. TRPC6 knock out (KO) mice do not show these effects. Data are expressed as means ± s.e.m. (n = 11–12 per group; *p < 0.05, **P < 0.001).

Similar articles

Cited by

References

    1. Vigo D, Thornicroft G, Atun R. Estimating the true global burden of mental illness. Lancet Psychiatry. 2016;3:171–8. - PubMed
    1. Park LT, Zarate CA. Depression in the primary care setting. N Engl J Med. 2019;380:558–68.. - PMC - PubMed
    1. Duman RS, Aghajanian GK, Sanacora G, Krystal JH. Synaptic plasticity and depression: New insights from stress and rapid-acting antidepressants. Nat Med. 2016;22:238–49. - PMC - PubMed
    1. Linde K, Mulrow CD. St John’s wort for depression. Cochrane Database Syst Rev. 2000;2:CD000448. - PubMed
    1. Linde K, Berner MM, Kriston L. St John’s wort for major depression. Cochrane Database Syst Rev. 2008;4:CD000448. - PMC - PubMed

Publication types

MeSH terms