. 2022 Oct 12;5(1):1084.
doi: 10.1038/s42003-022-04056-7.

Decoding the transcriptome of calcified atherosclerotic plaque at single-cell resolution

Affiliations

Decoding the transcriptome of calcified atherosclerotic plaque at single-cell resolution

Tom Alsaigh et al. Commun Biol. .

Abstract

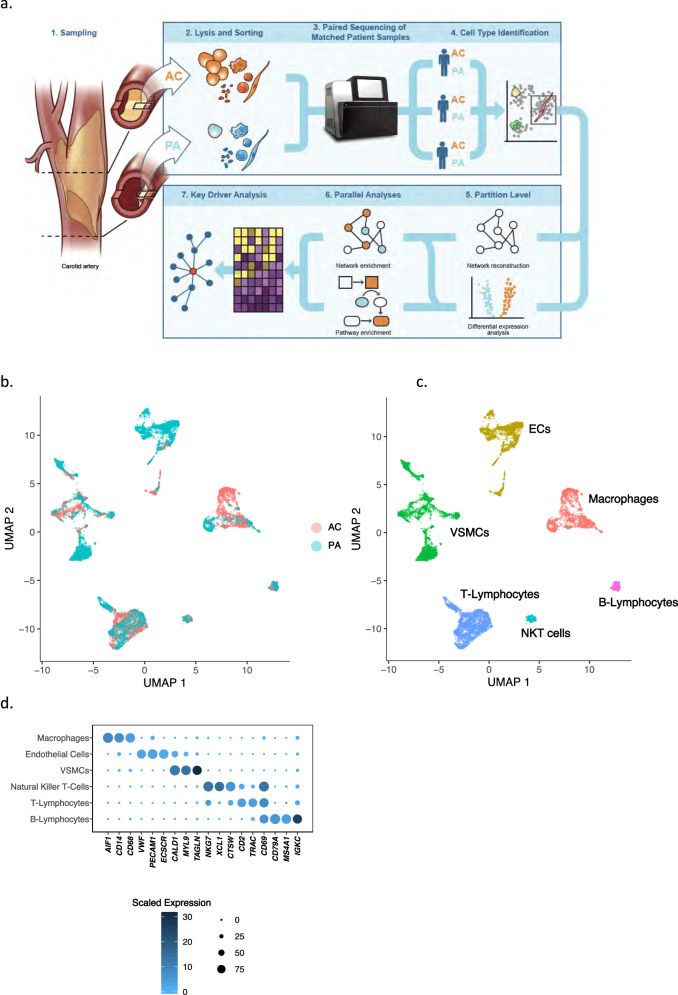
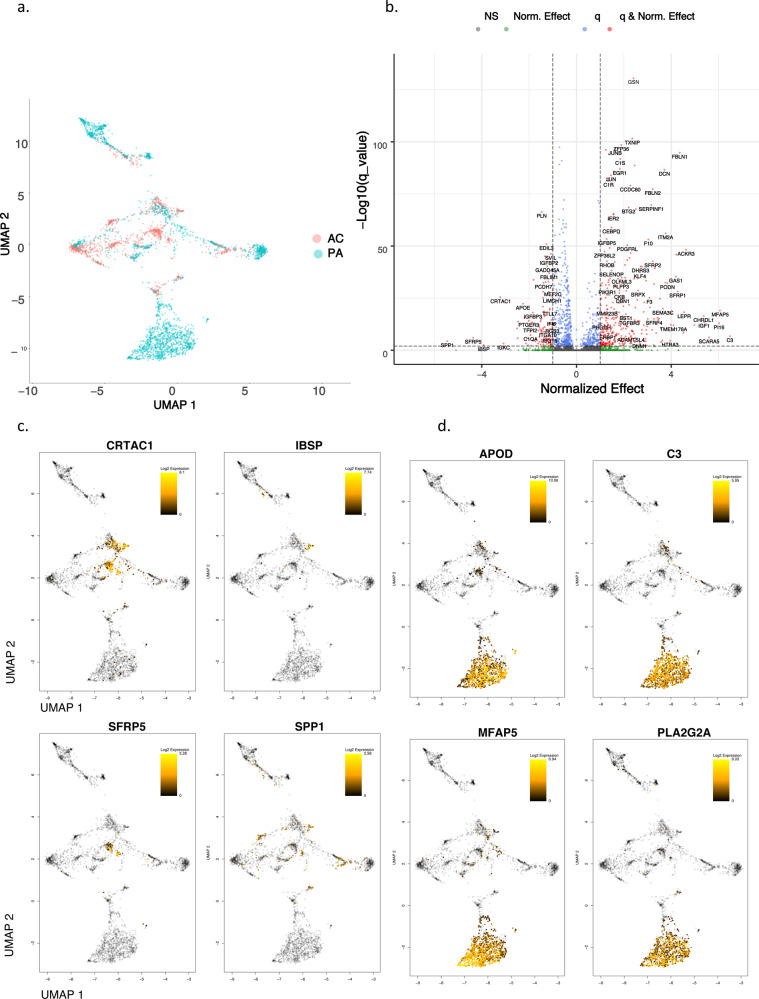
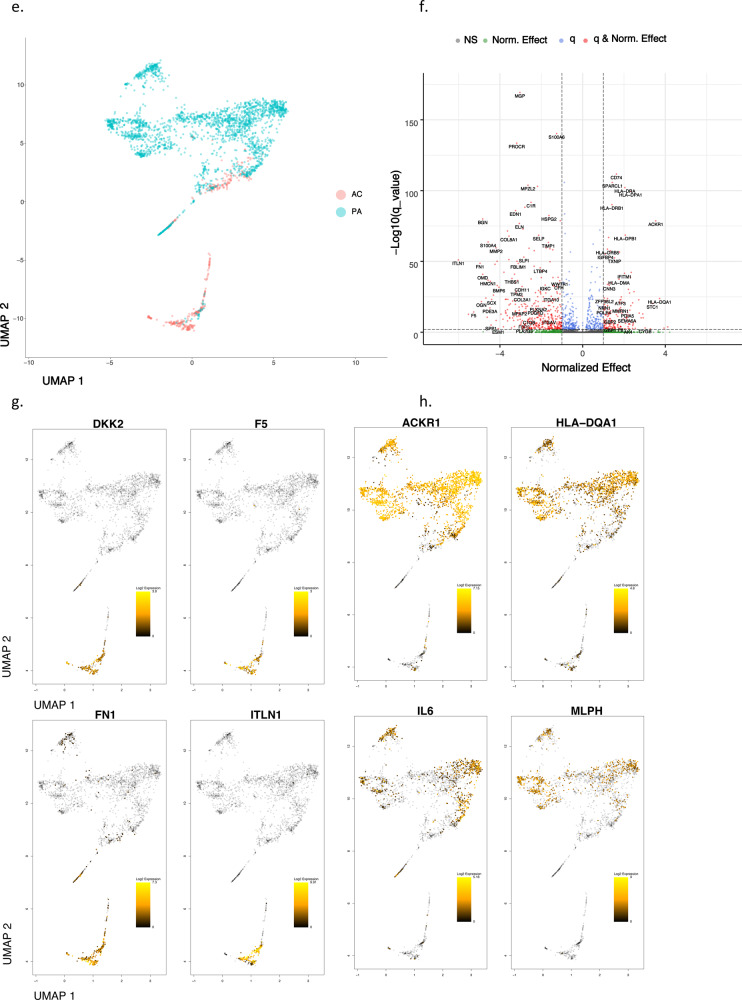
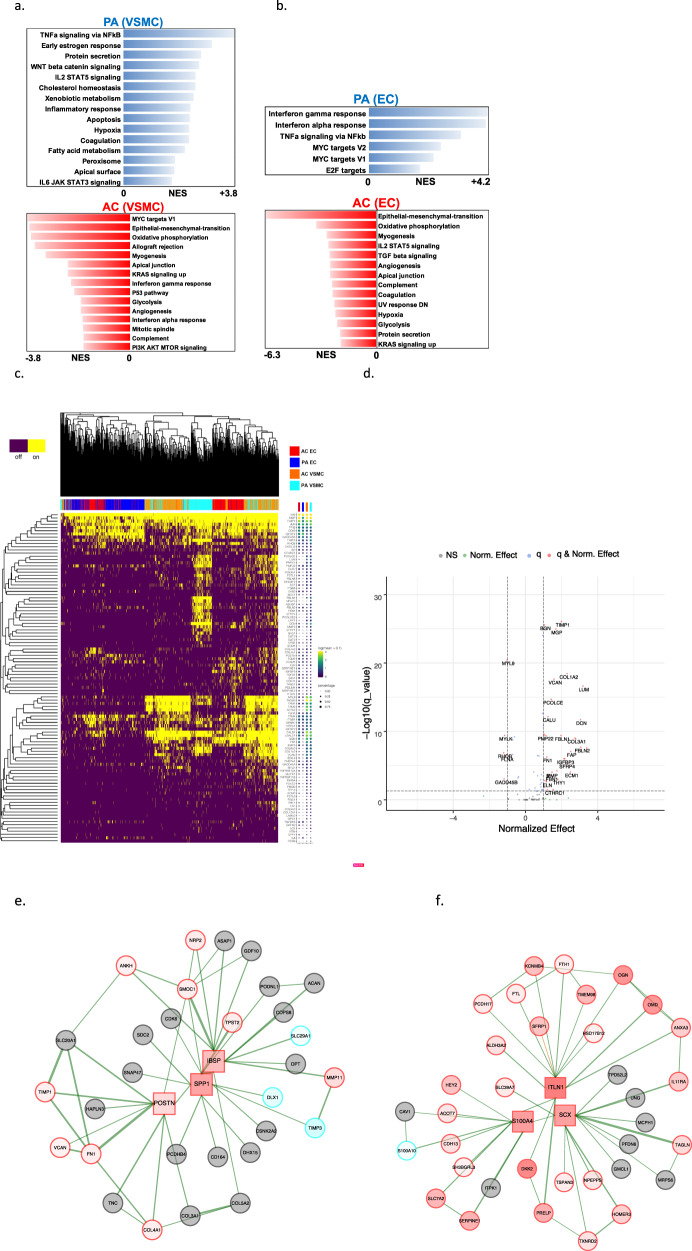
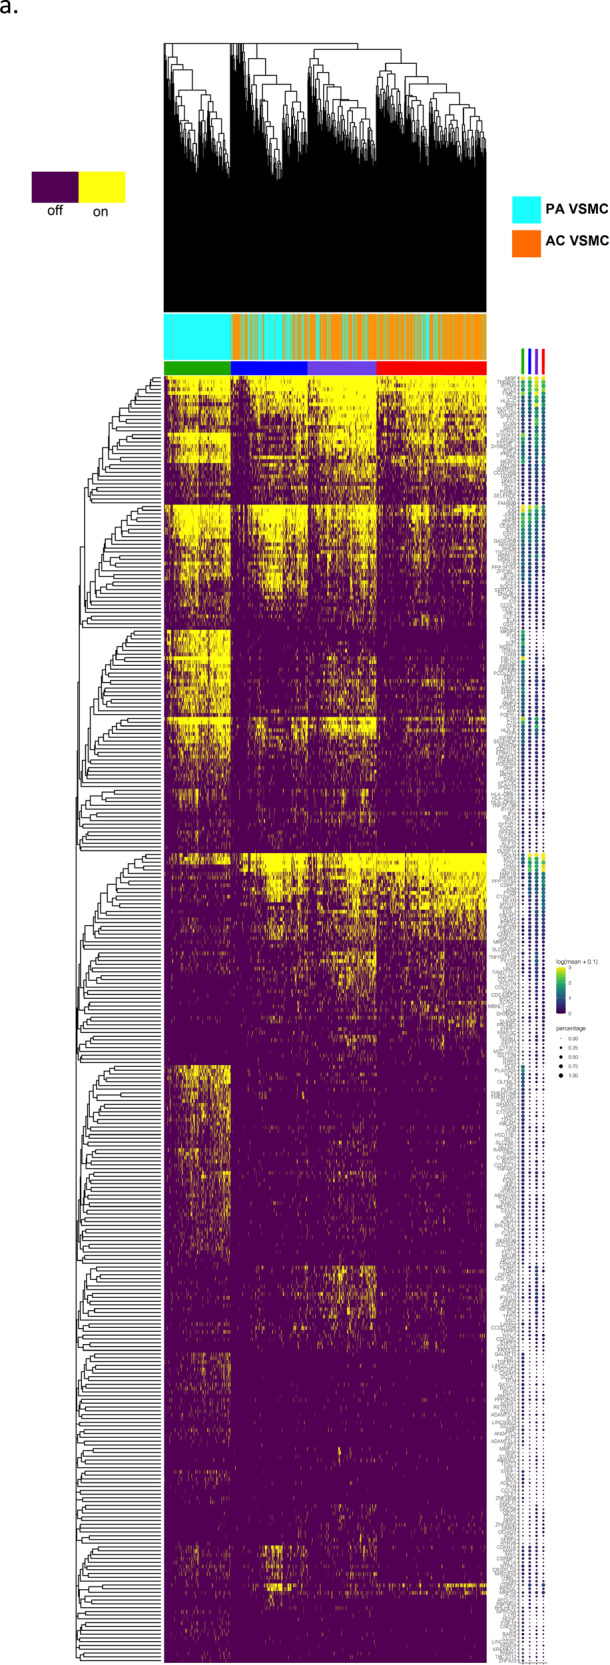
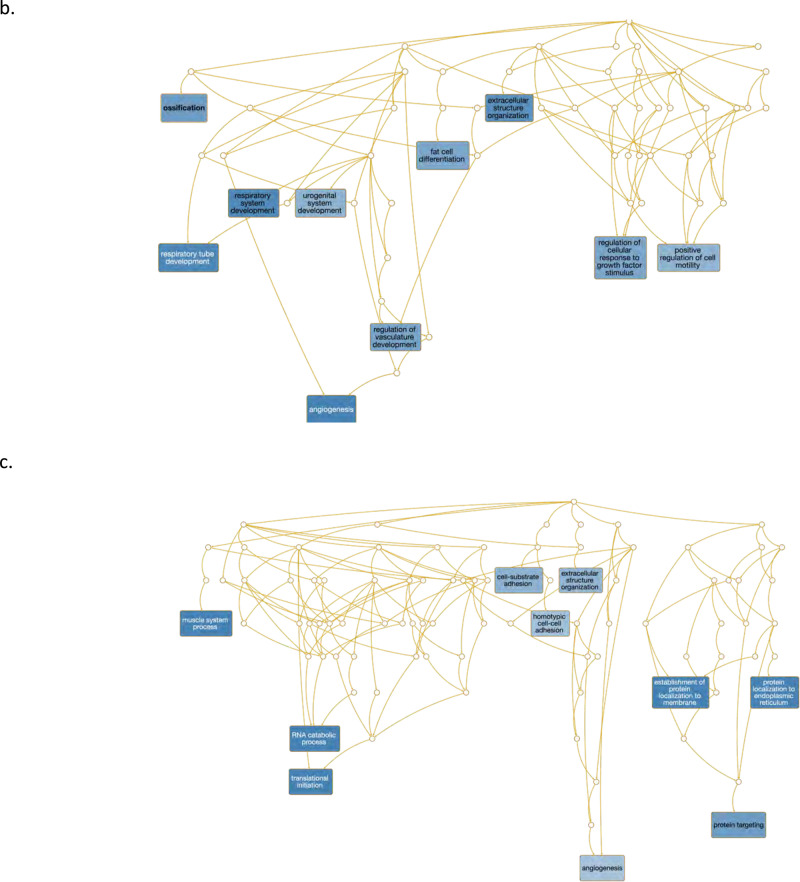
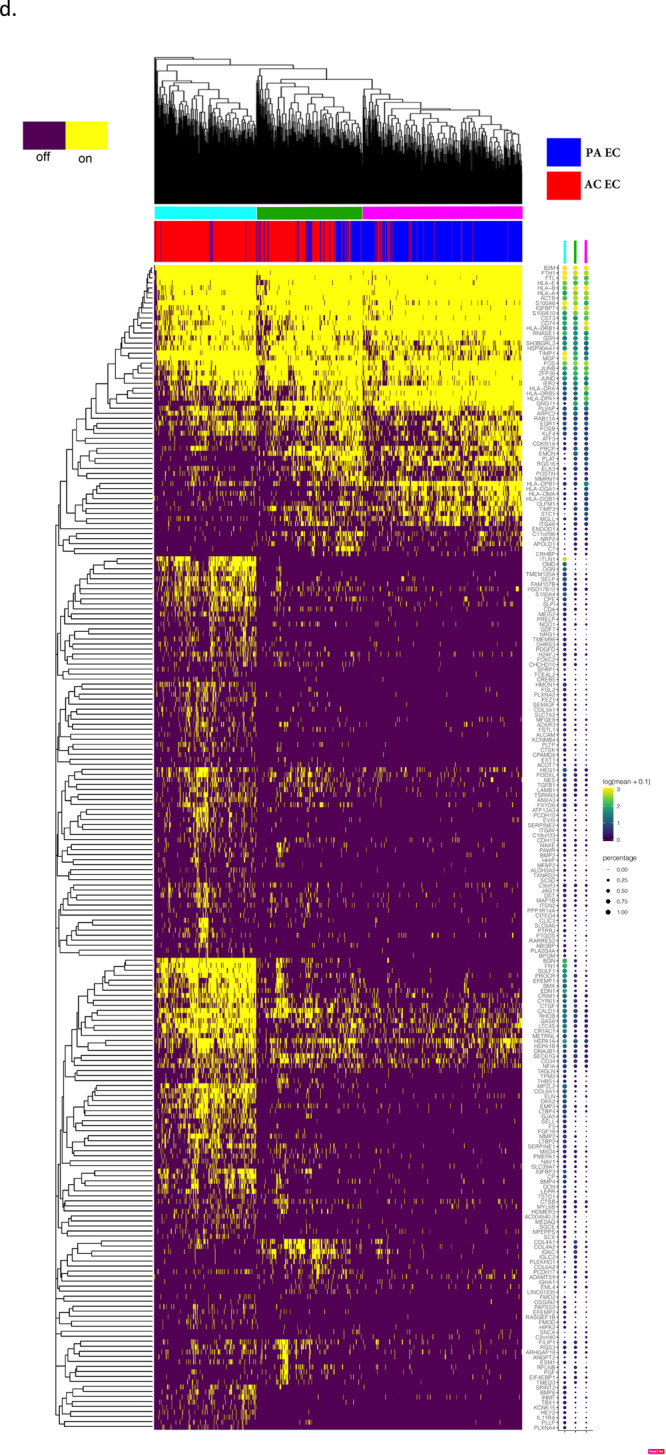
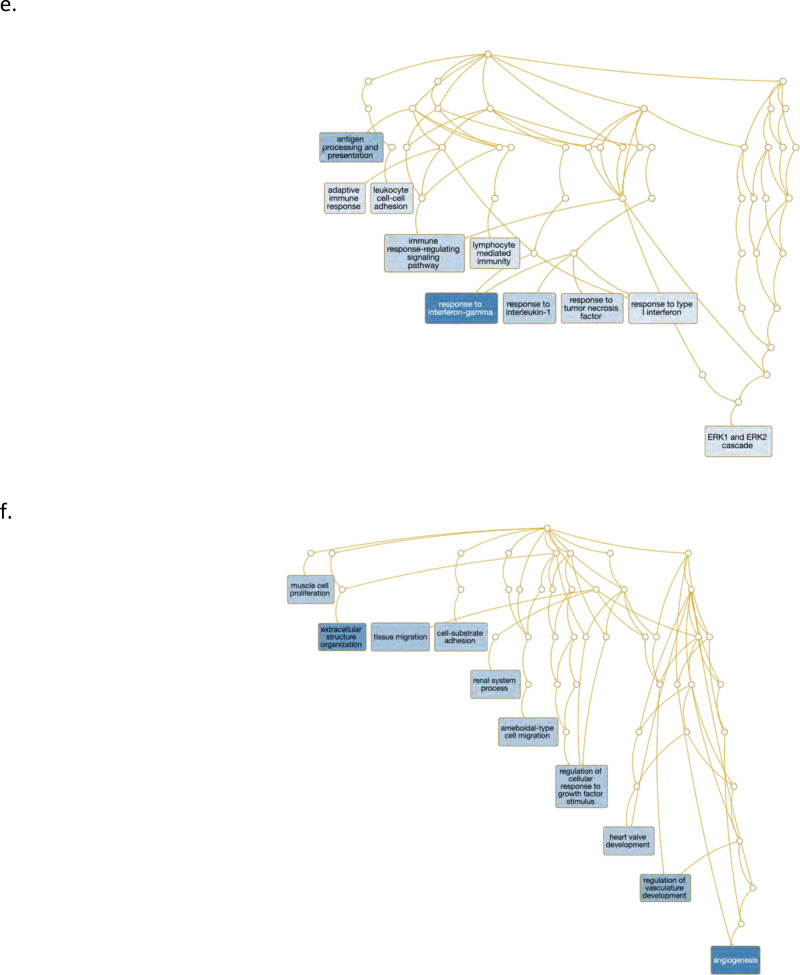
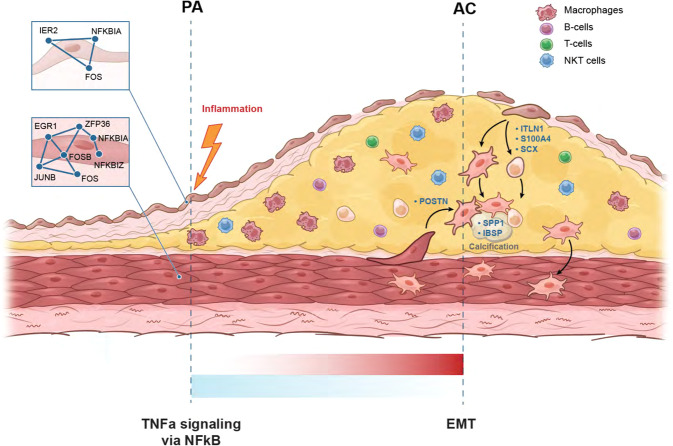
Atherogenesis involves an interplay of inflammation, tissue remodeling and cellular transdifferentiation (CTD), making it especially difficult to precisely delineate its pathophysiology. Here we use single-cell RNA sequencing and systems-biology approaches to analyze the transcriptional profiles of vascular smooth muscle cells (VSMCs) and endothelial cells (ECs) in calcified atherosclerotic core (AC) plaques and patient-matched proximal adjacent (PA) portions of carotid artery tissue from patients undergoing carotid endarterectomy. Our results reveal an anatomic distinction whereby PA cells express inflammatory mediators, while cells expressing matrix-secreting genes occupy a majority of the AC region. Systems biology analysis indicates that inflammation in PA ECs and VSMCs may be driven by TNFa signaling. Furthermore, we identify POSTN, SPP1 and IBSP in AC VSMCs, and ITLN1, SCX and S100A4 in AC ECs as possible candidate drivers of CTD in the atherosclerotic core. These results establish an anatomic framework for atherogenesis which forms the basis for exploration of a site-specific strategy for disruption of disease progression.


Conflict of interest statement

The authors declare no competing interests.

Figures

Fig. 1
Fig. 1. Data processing produces 6 main cell group partitions.
a Schematic diagram of analytical steps from tissue dissociation to key driver analysis. b, c UMAP visualization of 6 major cell types following doublet removal via gene exclusion criteria (see Supplemental Methods), separated by anatomic location (b), and by cell type (c). d Dotplot depicting cell-type marker genes, resulting in the identification of macrophages, ECs, VSMCs, NKT cells, T- and B-Lymphocytes. Dot size depicts the fraction of cells expressing a gene. Dot color depicts the degree of expression of each gene. n = 3 for PA and AC groups.
Fig. 2
Fig. 2. Differential gene expression in VSMCs and ECs.
a, e UMAP visualization of VSMCs (a) and ECs (e), separated by anatomic location. b, f Volcano plots of the top differentially expressed genes in VSMCs (b) and ECs (f). Dotted lines represented q-value 0.5 and <−0.5 corresponding to PA and AC cells, respectively. c, d UMAP visualization of the top 4 upregulated genes in AC VSMCs (c), and PA VSMCs (d). Gray-colored cells indicate 0 expression of designated gene, while color bar gradient indicates lowest (black) to highest (yellow) gene expression level. g, h UMAP visualization of the top 4 upregulated genes in AC ECs (g), and PA ECs (h). Color scheme is similar to the above-described parameters. VSMCs = 3674 cells; ECs = 2764 cells. n = 3 for PA and AC groups.
Fig. 3
Fig. 3. Gene set enrichment analysis and gene co-expression networks identify key gene drivers of EMT hallmark biologic process.
a, b Normalized enrichment score (NES) ranking of all significant PA and AC Hallmarks generated from GSEA analysis of differentially expressed genes for VSMCs (a) and ECs (b) (FDR q-value < 0.05). c Fully clustered on/off heatmap visualization of overlap between leading edge EMT hallmark genes generated by GSEA. Heatmaps are downsampled and represent 448 cells from each cell type and anatomic location (1792 total cells). A dotplot corresponding to gene expression levels for each cell type in the heatmap is included. Dot size depicts the fraction of cells expressing a gene. Dot color depicts the degree of expression of each gene. d Volcano plot of differentially expressed genes between the two groups of VSMCs in (c). Dotted lines represented q-value<0.01 and normalized effect >0.5 and <−0.5. e, f Gene co-expression networks generated from VSMC Module 13 (d) and EC Module 1 (e) representing the EMT hallmark from GSEA analysis. Genes are separated by anatomic location (red = AC genes, cyan = PA genes), differential expression (darker shade = higher DE, gray = non-significantly DEGs), correlation with other connected genes (green line = positive correlation, orange line = negative correlation) and strength of correlation (connecting line thickness). Significantly DEGs (q < 0.05) with high connectivity scores (>0.3) are denoted by a box instead of a circle. n = 3 for PA and AC groups.
Fig. 4
Fig. 4. Evaluation of VSMC and EC subpopulations.
a, d Biclustered heatmap visualization of all significant genes (q < 0.05) from VSMC (a) and EC (d) modules enriched with differentially expressed genes. a 1224 VSMCs from each anatomic location (2448 cells total). Large color bar denotes PA (cyan) and AC (orange) VSMCs. Small color bar above denotes distinct cell subpopulations (blue, forest green, lime green, brown, purple, magenta, red). d 448 ECs from each anatomic location (896 cells total) in. Large color bar denotes PA (blue) and AC (red) ECs. Small color bar above denotes distinct cell subpopulations (cyan, green, magenta). A dotplot corresponding to gene expression levels for each cell subpopulation on the heatmap is included. Colored dots next to specific genes correspond to critical genes related to the designated cell subpopulation. Continuous gene expression based gene ontology enrichment analysis of biological function performed based on the fraction of AC cells per subpopulation of VSMCs (b, c) and ECs (e, f). n = 3 for PA and AC groups.
Fig. 5
Fig. 5. Schematic of atherosclerotic plaque by anatomic location.
Illustrates key hallmark processes in PA and AC VSMCs and ECs. Inflammatory gene signatures shown in the PA portion, and matrix secreting genes up-regulated in the AC region. See main text for details.

Similar articles

Cited by

References

    1. Sage AP, Tsiantoulas D, Binder CJ, Mallat Z. The role of B cells in atherosclerosis. Nat. Rev. Cardiol. 2019;16:180–196. doi: 10.1038/s41569-018-0106-9. - DOI - PubMed
    1. Coll-Bonfill N, Musri MM, Ivo V, Barberà JA, Tura-Ceide O. Transdifferentiation of endothelial cells to smooth muscle cells play an important role in vascular remodelling. Am. J. Stem Cells. 2015;4:13–21. - PMC - PubMed
    1. Bennett MR, Sinha S, Owens GK. Vascular smooth muscle cells in atherosclerosis. Circ. Res. 2016;118:692–702. doi: 10.1161/CIRCRESAHA.115.306361. - DOI - PMC - PubMed
    1. Basatemur, G. L., Jørgensen, H. F., Clarke, M. C. H., Bennett, M. R. & Mallat, Z. Vascular smooth muscle cells in atherosclerosis. Nat. Rev. Cardiol.10.1038/s41569-019-0227-9 (2019). - PubMed
    1. Gimbrone MA, Jr., García-Cardeña G. Endothelial cell dysfunction and the pathobiology of atherosclerosis. Circ. Res. 2016;118:620–636. doi: 10.1161/CIRCRESAHA.115.306301. - DOI - PMC - PubMed

Publication types

Substances