. 2022 Nov;41(46):5008-5019.
doi: 10.1038/s41388-022-02496-3. Epub 2022 Oct 12.

Intralesional TLR4 agonist treatment strengthens the organ defense against colonizing cancer cells in the brain

Affiliations

Intralesional TLR4 agonist treatment strengthens the organ defense against colonizing cancer cells in the brain

Raquel Blazquez et al. Oncogene. 2022 Nov.

Abstract

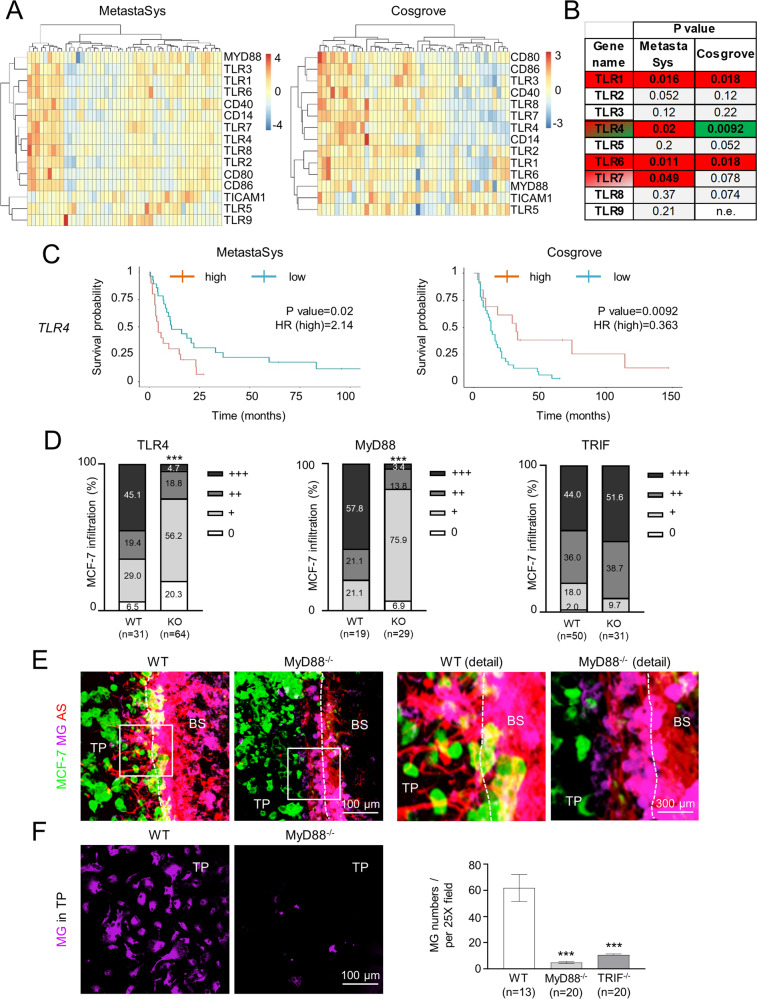
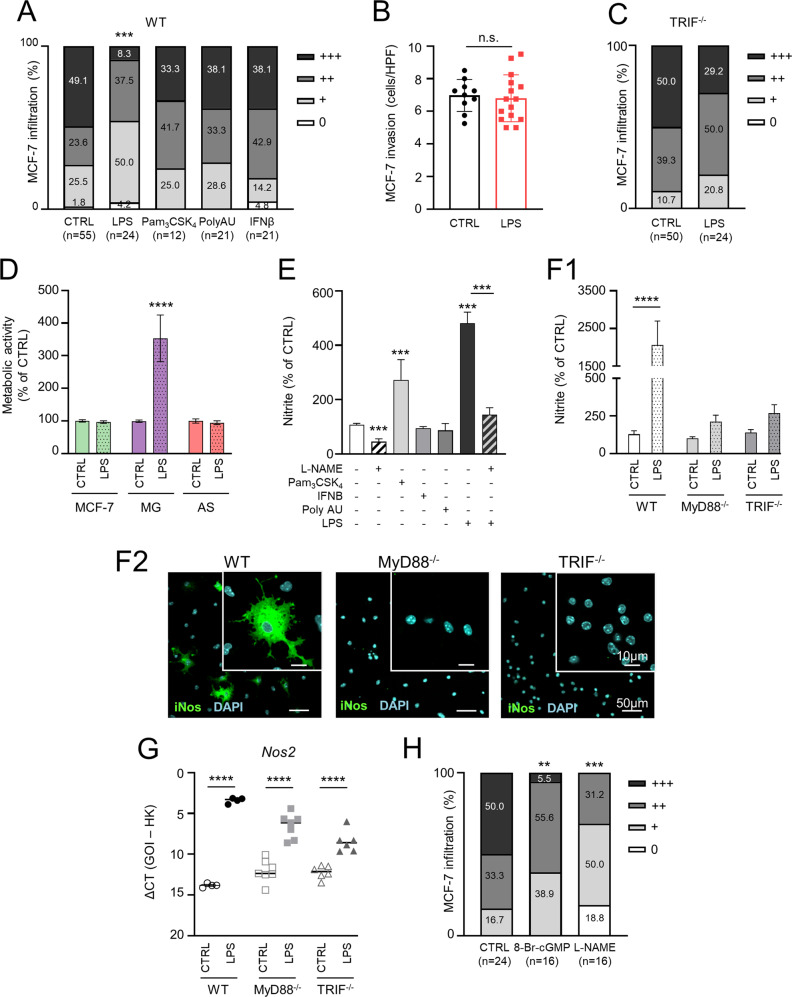
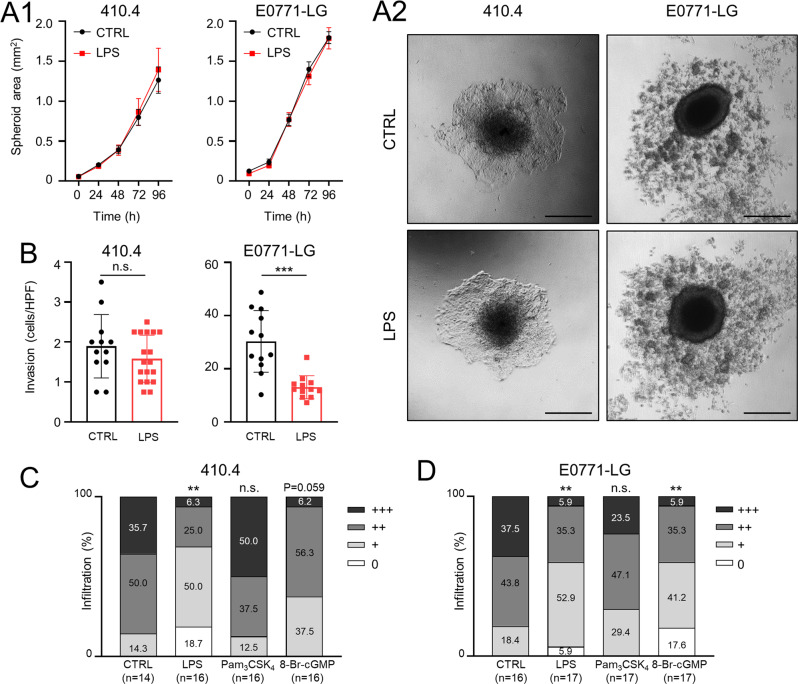
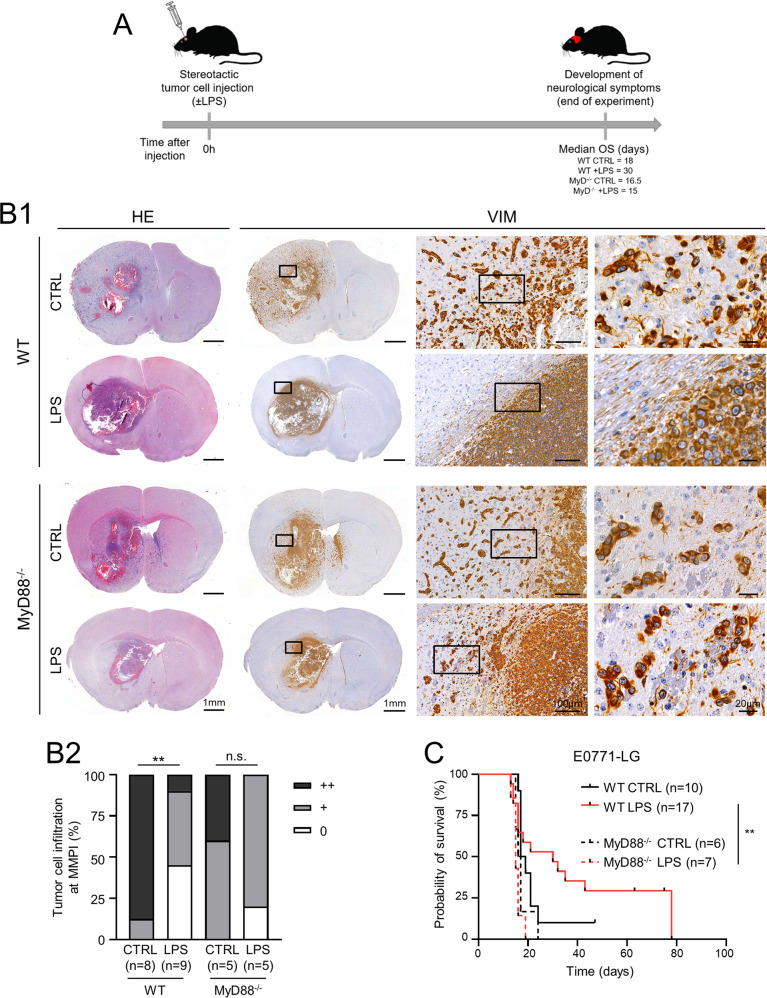
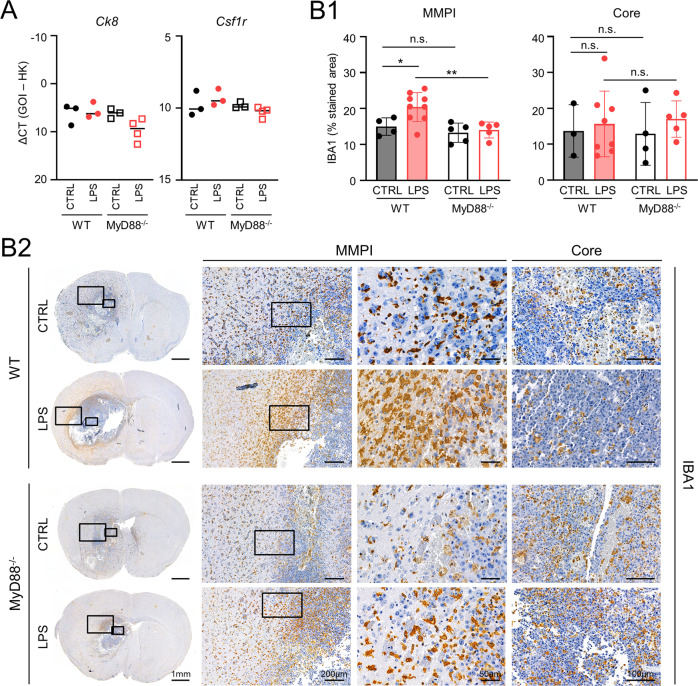
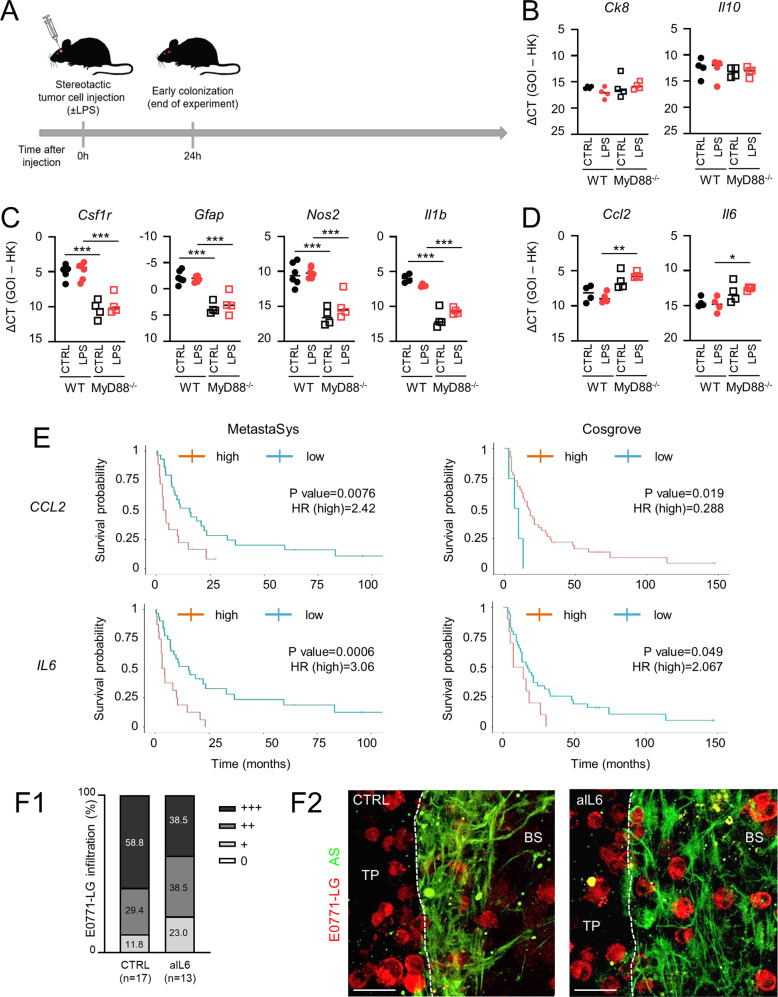
Brain metastasis in breast cancer remains difficult to treat and its incidence is increasing. Therefore, the development of new therapies is of utmost clinical relevance. Recently, toll-like receptor (TLR) 4 was correlated with IL6 expression and poor prognosis in 1 215 breast cancer primaries. In contrast, we demonstrated that TLR4 stimulation reduces microglia-assisted breast cancer cell invasion. However, the expression, prognostic value, or therapeutic potential of TLR signaling in breast cancer brain metastasis have not been investigated. We thus tested the prognostic value of various TLRs in two brain-metastasis gene sets. Furthermore, we investigated different TLR agonists, as well as MyD88 and TRIF-deficient microenvironments in organotypic brain-slice ex vivo co-cultures and in vivo colonization experiments. These experiments underline the ambiguous roles of TLR4, its adapter MyD88, and the target nitric oxide (NO) during brain colonization. Moreover, analysis of the gene expression datasets of breast cancer brain metastasis patients revealed associations of TLR1 and IL6 with poor overall survival. Finally, our finding that a single LPS application at the onset of colonization shapes the later microglia/macrophage reaction at the macro-metastasis brain-parenchyma interface (MMPI) and reduces metastatic infiltration into the brain parenchyma may prove useful in immunotherapeutic considerations.


Conflict of interest statement

The authors declare no competing interests.

Figures

Fig. 1
Fig. 1. Clinical relevance of TLR expression in human brain metastases and contribution of TLR4 to tumor cell infiltration.
A Expression heatmap of selected TLR-related genes in BCBMs patients. Unsupervised hierarchical clustering heatmap of the expression of selected genes in BCBMs MetastaSys (n = 48; left) and Cosgrove (n = 45; right) cohorts. The color code indicates gene expression (red = high; blue = low). B Summary table of log-rank test p-values with color code indicating the relationship between the gene expression of the indicated TLR signaling components (red = high; green = low; grey = not significant; n.e. = not expressed) and BCBM patient poorer prognosis in the BCBM patient cohorts. C Kaplan-Meier survival curves of BCBM patients in MetastaSys (left) or Cosgrove (right) cohorts stratified on the basis of TLR4 expression (P value = log-rank test p-value; HR = hazard ratio). D Organotypic brain-slice ex vivo co-culture with MCF-7 tumor cells and brain slices from C57BL/6 wild-type (WT) and TLR4 knockout (KO), MyD88 KO, or TRIF KO mice. Data represent the percentage degree of tumor-cell infiltration into the brain slices after 96 hours (n ≥ 19; ***p < 0.001; Mann-Whitney test). E Representative pictures of MCF-7 cells co-cultured with brain slices from WT and MyD88−/− mice (TP tumor plug, BS brain slice). MCF-7 tumor cells are depicted in green; activated MG (IL-B4) and AS (GFAP) are illustrated in purple and red, respectively. Images of the MMPI at higher magnification are portrayed (upper row, right). F Representative pictures (left) and quantification (right) of MG (IL-B4) present in the tumor plug (TP), indicated as the number of MG cells per 25X field (n ≥ 13; mean ± SEM; ***p < 0. 001; unpaired t-test).
Fig. 2
Fig. 2. Role of MyD88, TRIF and NO in tumor cell infiltration.
A Organotypic brain-slice ex vivo co-culture with MCF-7 tumor cells and WT brain slices stimulated with LPS (1 µg/ml), Pam3CSK4 (1 µg/ml), recombinant IFNβ (100 ng/ml), or Poly(A:U) (1 µg/ml). Data represent the percentage degree of tumor-cell infiltration into the brain slices after 96 h (n ≥ 12; ***p < 0.001; Mann-Whitney test). B MCF-7 tumor-cell invasion after PBS (CTRL) or LPS (1 µg/ml) stimulation. Data represent the average tumor cell number migrated per high power field (HPF) after 96 hours (n ≥ 10; mean ± SD; n.s. = not significant; unpaired t-test). C Organotypic brain-slice ex vivo co-culture with MCF-7 tumor cells and brain slices from TRIF-/- mice after PBS (CTRL) or LPS (1 µg/ml) stimulation. Data represent the percentage degree of tumor-cell infiltration into the brain slices after 96 h (n ≥ 24; Mann-Whitney test). D Metabolic activity of the indicated cell types after stimulation with PBS (CTRL) or LPS (1 µg/ml) assessed by means of MTT conversion assay (n ≥ 8; mean ± SD; ***p < 0.001; one-way ANOVA followed by Sidak´s multiple comparisons test). E NO release as a function of nitrite accumulation in supernatants of WT MG after stimulation with L-NAME (1 mM), Pam3CSK4 (10 ng/ml), recombinant IFNβ (10 ng/ml), Poly(A:U) (1 µg/ml), and LPS (100 ng/ml) (n ≥ 6; mean ± SEM; ***p ≤ 0.001; unpaired t-test). F NO release as a function of nitrite accumulation in supernatants of WT, MyD88−/−, and TRIF−/− MG after LPS (100 ng/ml) stimulation. (F1) NO release is indicated as the percentage of nitrite accumulated compared to the control (CTRL; n ≥ 5; mean ± SEM; ****p < 0.0001; one-way ANOVA followed by Sidak’s multiple comparisons). (F2) Representative confocal images depicting iNos induction after LPS stimulation. G Quantitative RT-PCR analysis of Nos2 expression in wild-type (WT) or MyD88−/− MG after LPS (100 ng/ml) stimulation. Data represent the ΔCt value between the gene of interest (GOI = Nos2) and two housekeeping (HK) genes (n ≥ 4; mean; ****p < 0.0001; one-way ANOVA followed by Sidak’s multiple comparisons). H Organotypic brain-slice ex vivo co-culture with MCF-7 tumor cells and stimulated with 8-Br-cGMP (10 µM) or L-NAME (100 µM). Data represent the percentage degree of tumor-cell infiltration into the brain slices after 96 hours (n ≥ 16; **p < 0.01, ***p < 0.001; Mann-Whitney test).
Fig. 3
Fig. 3. Effect of TLR activation on tumor cell growth, invasion and infiltration.
A 3D tumor cell spheroids (410.4 left, E0771-LG right) formed by the hanging-drop method. (A1) The spheroid area (in mm2) upon treatment with LPS (1 µg/ml) is depicted compared to the control (CTRL; mean ± SD, n ≥ 3; two-way ANOVA followed by Sidak’s multiple comparisons test). (A2) Representative images of spheroid outgrowth after 96 h are illustrated. Scale bars represent 500 µm. B 410.4 (left) or E0771-LG (right) tumor cell invasion after PBS (CTRL) or LPS (1 µg/ml) stimulation. Data represent the average tumor cell number migrated per high power field (HPF) after 96 h (n ≥ 12; mean ± SD; n.s. = not significant, ***p < 0.001; unpaired t-test). Organotypic brain-slice ex vivo co-cultures with 410.4 (C) or E0771-LG (D) tumor cells and stimulated with LPS (1 µg/ml), Pam3CSK4 (1 µg/ml), or 8-Br-cGMP (10 µM). Data represent the percentage degree of tumor-cell infiltration into the brain slices (WT) after 96 hours (n ≥ 14; n.s. = not significant, **p < 0. 01; Mann-Whitney test).
Fig. 4
Fig. 4. Impact of TLR4 activation via MyD88 on metastatic infiltration and survival.
A Scheme depicting the timeline of the long-term in vivo experiment. Median OS of the different groups is indicated. B Characterization of E0771-LG infiltration at the MMPI. (B1) Representative images of histology (HE) and vimentin (VIM) immunohistochemistry (IHC) in coronal brain sections of wild-type (WT) or MyD88−/− mice injected with E0771-LG tumor cells and stimulated either with PBS (CTRL) or with LPS (1 µg/ml). Higher magnification images portraying metastatic infiltration at the MMPI are also presented. (B2) Quantification of the degree of tumor cell infiltration at the MMPI is indicated as the percentage of animals with high (++), medium (+), or low (0) metastatic infiltration at the MMPI (n ≥ 5; n.s. = not significant, **p < 0.01; Mann-Whitney test). C Kaplan-Meier survival curves of WT (straight line) or MyD88−/− (dashed line) mice injected with E0771-LG tumor cells and stimulated either with PBS (black) or with LPS (red) (n ≥ 6; **p < 0.01; log-rank test).
Fig. 5
Fig. 5. Impact of TLR4 activation on Mɸ/MG response in brain metastasis mouse models.
A qPCR analysis of Ck8 and Csf1r expression in brain metastases of wild-type (WT, dots) or MyD88−/− (squares) mice injected with E0771-LG tumor cells and stimulated either with PBS (CTRL; black) or with LPS (red) (n ≥ 3; mean; one-way ANOVA followed by Sidak’s multiple comparisons). B Characterization of Mɸ/MG activation in brain metastases of wild-type (WT, full bars) or MyD88−/− (empty bars) mice injected with E0771-LG tumor cells and stimulated either with PBS (CTRL; black) or with LPS (red). (B1) Quantification of IBA1 staining is indicated as the percentage of stained area in the respective brain region (n ≥ 4; mean ± SD; n.s. not significant, *p < 0.05, **p < 0.01; one-way ANOVA followed by Sidak’s multiple comparisons). (B2) IHC staining of activated Mɸ/MG (IBA1). Representative images of coronal brain sections and images of MMPI and tumor core at higher magnification are depicted.
Fig. 6
Fig. 6. Target genes under the control of TLR4/MyD88.
A Scheme depicting the timeline of the short-term in vivo experiments (early colonization). BD qPCR analysis of the indicated genes in brain metastases of wild-type (WT, dots) or MyD88−/− (squares) mice injected with E0771-LG tumor cells and stimulated either with PBS (CTRL; black) or with LPS (red). Tumors were isolated 24 h after tumor cell inoculation (n ≥ 4; mean; *p < 0.05, **p < 0.01, ***p < 0.001; one-way ANOVA followed by Sidak’s multiple comparisons). E Kaplan-Meier survival curves of BCBM patients in MetastaSys (left) or Cosgrove (right) cohorts stratified on the basis of CCL2 (top) or IL6 (bottom) expression (P value = log-rank test p-value; HR = hazard ratio). F Organotypic brain-slice ex vivo co-cultures with E0771-LG tumor cells stimulated with isotype control (CTRL) or anti-IL6 (1 µg/ml). Data represent the percentage degree of tumor cell infiltration into the brain slices (WT) after 96 hours (n ≥ 13; Mann-Whitney test). (F2) Representative pictures of the organotypic ex vivo co-cultures with E0771-LG cells (TP tumor plug, BS brain slice). E0771-LG tumor cells are depicted in red and AS (GFAP) are shown in green. Scale bars represent 30 µm.

Similar articles

Cited by

References

    1. Steeg PS, Camphausen KA, Smith QR. Brain metastases as preventive and therapeutic targets. Nat Rev Cancer. 2011;11:352–63. doi: 10.1038/nrc3053. - DOI - PMC - PubMed
    1. Rostami R, Mittal S, Rostami P, Tavassoli F, Jabbari B. Brain metastasis in breast cancer: a comprehensive literature review. J Neurooncol. 2016;127:407–14. doi: 10.1007/s11060-016-2075-3. - DOI - PubMed
    1. Lin X, DeAngelis LM. Treatment of brain metastases. J Clin Oncol. 2015;33:3475–84. doi: 10.1200/JCO.2015.60.9503. - DOI - PMC - PubMed
    1. Kudo Y, Haymaker C, Zhang J, Reuben A, Duose DY, Fujimoto J, et al. Suppressed immune microenvironment and repertoire in brain metastases from patients with resected non-small-cell lung cancer. Ann Oncol: Off J Eur Soc Med Oncol/ESMO. 2019;30:1521–30. doi: 10.1093/annonc/mdz207. - DOI - PMC - PubMed
    1. Schulz M, Michels B, Niesel K, Stein S, Farin H, Rodel F, et al. Cellular and molecular changes of brain metastases-associated myeloid cells during disease progression and therapeutic response. iScience. 2020;23:101178. doi: 10.1016/j.isci.2020.101178. - DOI - PMC - PubMed

Publication types

MeSH terms

Substances