. 2022 Oct 12;5(1):1085.
doi: 10.1038/s42003-022-04017-0.

Structural analysis of the overoxidized Cu/Zn-superoxide dismutase in ROS-induced ALS filament formation

Affiliations

Structural analysis of the overoxidized Cu/Zn-superoxide dismutase in ROS-induced ALS filament formation

Yeongjin Baek et al. Commun Biol. .

Abstract

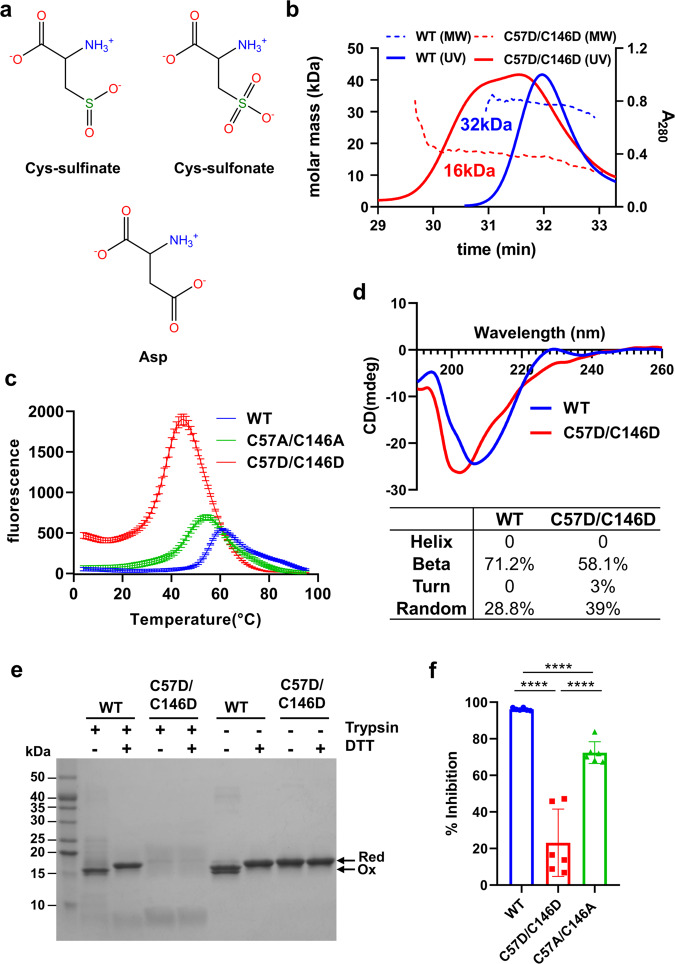
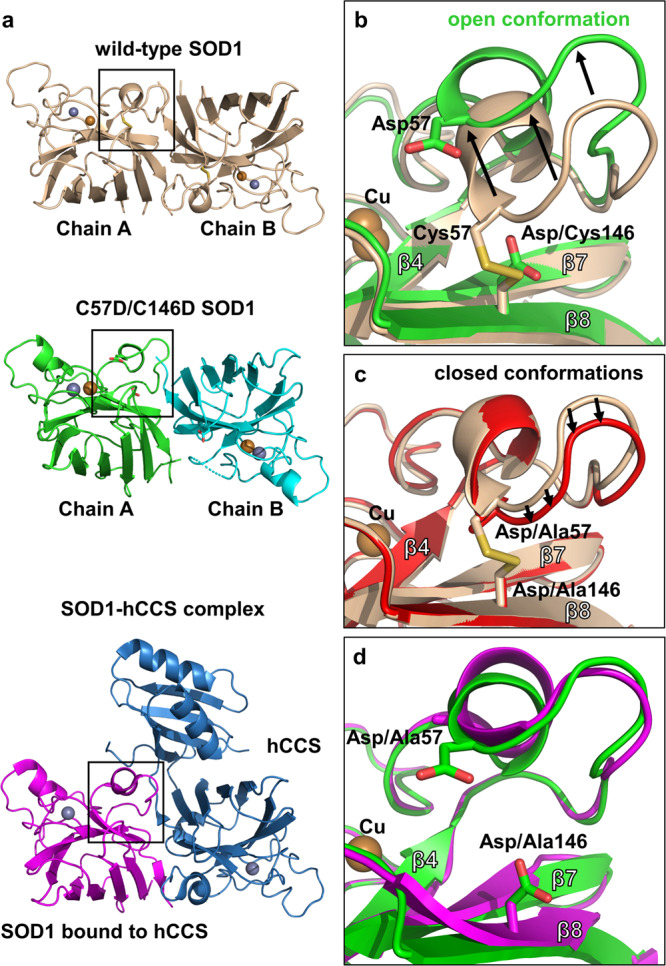
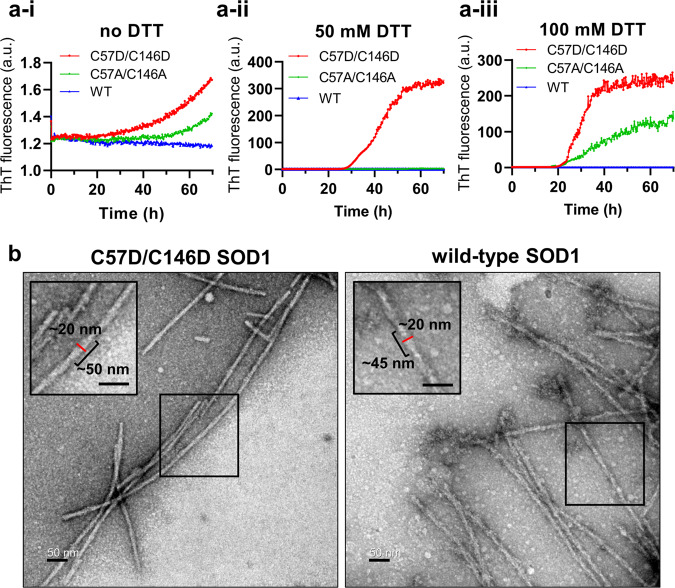
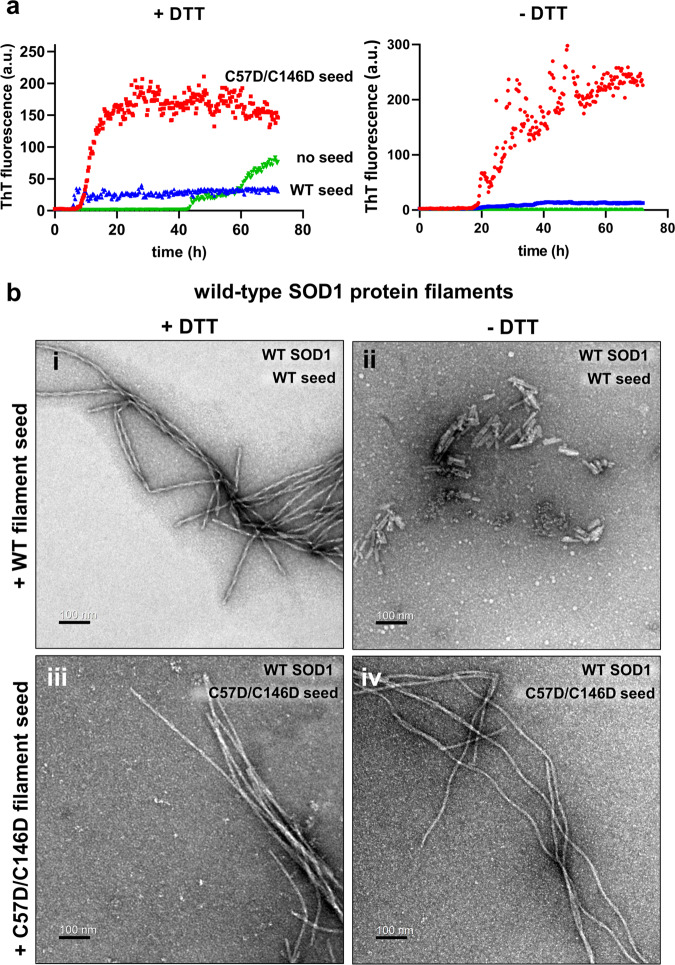
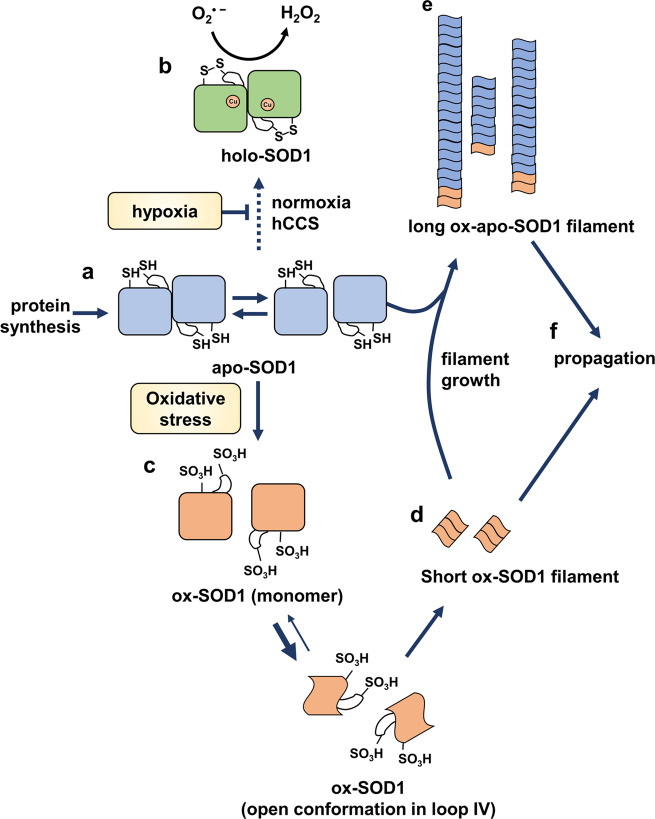
Eukaryotic Cu, Zn-superoxide dismutase (SOD1) is primarily responsible for cytotoxic filament formation in amyotrophic lateral sclerosis (ALS) neurons. Two cysteine residues in SOD1 form an intramolecular disulfide bond. This study aims to explore the molecular mechanism of SOD1 filament formation by cysteine overoxidation in sporadic ALS (sALS). In this study, we determined the crystal structure of the double mutant (C57D/C146D) SOD1 that mimics the overoxidation of the disulfide-forming cysteine residues. The structure revealed the open and relaxed conformation of loop IV containing the mutated Asp57. The double mutant SOD1 produced more contagious filaments than wild-type protein, promoting filament formation of the wild-type SOD1 proteins. Importantly, we further found that HOCl treatment to the wild-type SOD1 proteins facilitated their filament formation. We propose a feasible mechanism for SOD1 filament formation in ALS from the wild-type SOD1, suggesting that overoxidized SOD1 is a triggering factor of sALS. Our findings extend our understanding of other neurodegenerative disorders associated with ROS stresses at the molecular level.


Conflict of interest statement

The authors declare no competing interests.

Figures

Fig. 1
Fig. 1. Effect of the C57D/C146D mutation on the biochemical properties of purified SOD1 proteins.
a Structural comparison of cysteine-sulfinic acid and cysteine-sulfonic acid to aspartic acid. Cysteine-sulfinic acid and -sulfonic acid are the overoxidized forms of cysteine in the presence of ROS. Note that aspartic acid mimics Cys-sulfinic acid and Cys-sulfonic acid in terms of the electrostatic charge and the atomic arrangement. Detailed descriptions are in Supplementary Fig. 1. b SEC-MALS profiles of the purified wild-type (blue) and C57D/C146D mutant (red) SOD1 proteins. The UV absorbance at 280 nm (A280 at the right Y-axis) of the SEC is represented by solid lines. The molecular mass (the left Y-axis) based on MALS is represented by a dotted line. The average molar mass of wild-type or C57D/C146D mutant SOD1 is indicated under the dotted lines. c Tm measurement by the thermal shift assay of the wild-type SOD1 protein (WT, blue line), C57A/C146A mutant SOD1 protein (green line), and C57D/C146D mutant SOD1 protein (red line). Individual raw data points displayed for each temperature represented the average of three endpoint readings with ±SD. According to the analyzing results (Supplementary Fig. 2c), the Tm values of the wild-type, C57A/C146A, and C57D/C146D were 56 °C, 47 °C, and 38 °C, respectively. d Top, far-UV CD spectra of the wild-type SOD1 (WT, blue line) and C57D/C146D mutant SOD1 (red line) at the wavelength range of 190-260 nm. Bottom, the estimated secondary structure of wild-type and mutant protein calculated based on CD spectra. The proportion of each secondary structure constituting the SOD1 protein is expressed as a percentage. e Proteolytic digestion of the wild-type (WT) and C57D/C146D mutant SOD1 proteins by trypsin. The proteins were digested at 37 °C for 1 h in the presence or absence of 5 mM DTT and then subjected to SDS-PAGE. The redox states of SOD1 proteins are indicated by arrows to the right of the SDS polyacrylamide gel image. All the cysteines in SOD1 are reduced (red), or an intramolecular bond is formed between Cys57 and Cys146 (Ox). f Relative superoxide dismutase activities of the wild-type (blue), C57D/C146D (red), and C57A/C146A (green) mutant SOD1 protein. Inhibition of cytochrome c reduction by superoxide in the presence of SOD1 was represented in bar graphs with mean ± SD from six individual experiments. Statistical comparisons were performed using an unpaired two-tailed Student’s t-test. Differences were considered statistically significant at P-values < 0.05. **** denote p < 0.0001. Raw data are presented in Supplementary Fig. 2e.
Fig. 2
Fig. 2. Cellular inclusions of the ectopically expressed SOD1 proteins in SK-N-SH cells.
a The dot blot analysis of the misfolded SOD1 ectopically expressed in SK-N-SH cells. To detect the misfolded SOD1 in the cell lysate, the anti-misfolded SOD1 antibody was used (left). SK-N-SH cells were transfected with pcDNA3.1 plasmid (EV), pcDNA3.1 expressing wild-type SOD1 (SOD1-WT), or pcDNA3.1 expressing C57D/C146D mutant SOD1 (SOD1-C57D/C146D). The Zn2+ chelator (TPEN) or the Cu2+ chelator (ATN-224) was treated in the cells during SOD1 transfection. Actin was detected by the actin antibody as a loading control (right). b Top, immunofluorescence staining of overexpressed SOD1 in SK-N-SH cells. SK-N-SH cells transfected with pcDNA3.1 expressing the wild-type SOD1 or the C57D/C146D SOD1 gene were incubated with Cu2+ chelator (ATN-224, right panels) or Zn2+ chelator (TPEN, middle panels), or without any treatment (left panels) for 12 h. Cells were visualized by the appropriate antibody and dyes: SOD1 in green, ER in red, and DNA in blue. Colocalization of SOD1 with ER shows an orange field. Arrows indicate the cytoplasmic accumulation of SOD1 proteins. White arrows indicated cells with SOD1 inclusions. Scale bar; 10 μm. Bottom, statistical quantification of the inclusion positive cells detected by immunofluorescence staining. The percentages of inclusion positive cells to the total cells were represented in bar graphs with mean ± SD from seven biological replicates. Statistical comparisons were performed using Student’s t-test. Statistical comparisons were performed using Student’s t-test. P-value < 0.05 was considered significant. *, **, *** denote p < 0.05, p < 0.01 and p < 0.001, respectively.
Fig. 3
Fig. 3. Crystal structure of the C57D/C146D mutant SOD1 at 1.8 Å resolution.
a Structural comparison of C57D/C146D mutant SOD1 (chain A;green, chain B; cyan) with wild-type holo-SOD1 dimer (wheat) or with C57A/C146A mutant SOD1 (magenta) bound to human copper chaperone of SOD1 (hCCS, blue) (6FP6). The structure of the asymmetric unit of C57D/C146D mutant SOD1 consists of two protomers (chains A and B). Each subunit is depicted by the ribbon representation. The gold spheres represent Cu2+, and the gray spheres represent Zn2+. The loop IV regions are marked as three small boxes. b Loop IV region in the C57D/C146D mutant SOD1 structure aligned with wild-type SOD1. The C57D/C146D mutant SOD1 is colored green, and the wild-type SOD1 structure is colored wheat. The secondary structural elements are labeled. The gold sphere represents Cu2+. Each residue is labeled and indicated in the stick representations with the ribbon diagram of the background. c Loop IV region in the C57A/C146A mutant SOD1 structure (6FOI) aligned with wild-type SOD1. The C57A/C146A mutant SOD1 is colored red, and the wild-type SOD1 structure is colored wheat. The secondary structure elements are labeled. The gold sphere represents Cu2+. Each residue is labeled and indicated in the stick representations with the ribbon diagram of the background. d Loop IV region of the C57D/C146D mutant SOD1 structure aligned with the C57A/C146A mutant SOD1 structure bound to the hCCS (6FP6). The C57D/C146D mutant SOD1 is colored green, and the C57A/C146A mutant SOD1 is colored magenta. The secondary structural elements are labeled. The gold sphere represents Cu2+. Each residue is labeled and indicated in the stick representations with the ribbon diagram of the background.
Fig. 4
Fig. 4. Amyloid-like filament formation of the SOD1 proteins.
a Thioflavin T (ThT) fluorescence intensities representing the filament formation of the C57D/C146D mutant SOD1 (red), C57A/C146A mutant SOD1 (green), and wild-type SOD1 (WT, blue) proteins in the reaction buffer containing 0 mM DTT (A-i), 50 mM DTT (A-ii), and 100 mM DTT (A-iii). The data points are represented by the mean values of six independent experiments. The individual raw datasets are presented in Supplementary Fig. 6a. b Negative-stain transmission electron micrographs of the C57D/C146D mutant SOD1 (left) or wild-type SOD1 (right) proteins. Both proteins were incubated in reaction buffer containing 50 mM DTT for 90 h. The boxes within the micrographs are enlarged in the corners of the micrographs. Scale bars indicate 50 nm.
Fig. 5
Fig. 5. Promoted filament formation of the wild-type and C57D/C146D mutant by the preformed filaments.
a ThT fluorescence intensities, representing the filamentation of the wild-type SOD1 protein in the buffer containing wild-type or C57D/C146D mutant SOD1 filament in the presence of 50 mM DTT (left) or the absence of DTT (right). The data points are shown as the mean of three independent experiments. The raw data are presented in Supplementary Fig. 8b. b Morphologies of the seeded wild-type SOD1 filaments shown in the negative-stain transmission electron micrographs. The wild-type SOD1 filaments seeded by the wild-type filament in the absence and presence of 50 mM DTT are displayed in (i) and (ii), respectively. The wild-type SOD1 filaments seeded by the C57D/C146D mutant SOD1 filament in the absence and presence of 50 mM DTT are shown in (iii) and (iv). Scale bars indicate 100 nm.
Fig. 6
Fig. 6. Promotion of SOD1 filament formation by HOCl.
The ThT fluorescence intensities represent the filament formation of the wild-type SOD1 protein (a) or the C6A/C111A mutant SOD1 protein (b). Each protein was treated with HOCl (red), H2O2 (blue), or none (black). The data points are shown as the mean of three independent experiments. The individual raw datasets are presented in Supplementary Fig. 10.
Fig. 7
Fig. 7. Proposed mechanism of sALS development from wild-type SOD1.
a Newly synthesized SOD1 does not have Cu2+, and the cysteine residues are reduced, resulting in apo-SOD1 in an equilibrium between the monomeric and dimeric forms. b In the normoxic state, apo-SOD1 undergoes the maturation process. Disulfide bond formation and copper insertion occur by hCCS, resulting in holo-SOD1 with full superoxide dismutase activity. Under hypoxic conditions, disulfide bond formation by hCCS is inhibited, and immature apo-SOD1 accumulates in the cytosol. c In the presence of excess ROS, such as HOCl, with unknown environmental factors, a small amount of apo-SOD1 is overoxidized in an irreversible manner, resulting in ox-SOD1. d The structure of Ox-SOD1 with the open conformation in loop IV starts to form a short filamentous structure. e Filamentous ox-SOD1 is rapidly elongated by recruiting apo-SOD1, resulting in the ox-apo-SOD1 filament. f Filamentous ox-apo-SOD1 propagates to other regions in neurons or adjacent neuronal cells.

Similar articles

Cited by

References

    1. Soto C, Pritzkow S. Protein misfolding, aggregation, and conformational strains in neurodegenerative diseases. Nat. Neurosci. 2018;21:1332–1340. doi: 10.1038/s41593-018-0235-9. - DOI - PMC - PubMed
    1. Valentine JS, Doucette PA, Zittin Potter S. Copper-zinc superoxide dismutase and amyotrophic lateral sclerosis. Annu. Rev. Biochem. 2005;74:563–593. doi: 10.1146/annurev.biochem.72.121801.161647. - DOI - PubMed
    1. Wang H, Ying Z, Wang G. Ataxin-3 regulates aggresome formation of copper-zinc superoxide dismutase (SOD1) by editing K63-linked polyubiquitin chains. J. Biol. Chem. 2012;287:28576–28585. doi: 10.1074/jbc.M111.299990. - DOI - PMC - PubMed
    1. Weisberg SJ, et al. Compartmentalization of superoxide dismutase 1 (SOD1G93A) aggregates determines their toxicity. Proc. Natl Acad. Sci. USA. 2012;109:15811–15816. doi: 10.1073/pnas.1205829109. - DOI - PMC - PubMed
    1. Kim, B. W., Ryu, J., Jeong, Y. E., Kim, J. & Martin, L. J. Human motor neurons with SOD1-G93A mutation generated from CRISPR/Cas9 gene-edited iPSCs develop pathological features of amyotrophic lateral sclerosis. Front. Cell. Neurosci.14, 604171 (2020). - PMC - PubMed

Publication types