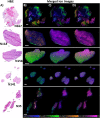
Mass spectrometry imaging discriminates glioblastoma tumor cell subpopulations and different microvascular formations based on their lipid profiles
- PMID: 36224354
- PMCID: PMC9556690
- DOI: 10.1038/s41598-022-22093-4
Mass spectrometry imaging discriminates glioblastoma tumor cell subpopulations and different microvascular formations based on their lipid profiles
Abstract
Glioblastoma is a prevalent malignant brain tumor and despite clinical intervention, tumor recurrence is frequent and usually fatal. Genomic investigations have provided a greater understanding of molecular heterogeneity in glioblastoma, yet there are still no curative treatments, and the prognosis has remained unchanged. The aggressive nature of glioblastoma is attributed to the heterogeneity in tumor cell subpopulations and aberrant microvascular proliferation. Ganglioside-directed immunotherapy and membrane lipid therapy have shown efficacy in the treatment of glioblastoma. To truly harness these novel therapeutics and develop a regimen that improves clinical outcome, a greater understanding of the altered lipidomic profiles within the glioblastoma tumor microenvironment is urgently needed. In this work, high resolution mass spectrometry imaging was utilized to investigate lipid heterogeneity in human glioblastoma samples. Data presented offers the first insight into the histology-specific accumulation of lipids involved in cell metabolism and signaling. Cardiolipins, phosphatidylinositol, ceramide-1-phosphate, and gangliosides, including the glioblastoma stem cell marker, GD3, were shown to differentially accumulate in tumor and endothelial cell subpopulations. Conversely, a reduction in sphingomyelins and sulfatides were detected in tumor cell regions. Cellular accumulation for each lipid class was dependent upon their fatty acid residue composition, highlighting the importance of understanding lipid structure-function relationships. Discriminating ions were identified and correlated to histopathology and Ki67 proliferation index. These results identified multiple lipids within the glioblastoma microenvironment that warrant further investigation for the development of predictive biomarkers and lipid-based therapeutics.
© 2022. The Author(s).
Conflict of interest statement
The authors declare no competing interests.
Figures


Similar articles
-
Aberrant ganglioside composition in glioblastoma multiforme and peritumoral tissue: A mass spectrometry characterization.Biochimie. 2017 Jun;137:56-68. doi: 10.1016/j.biochi.2017.03.001. Epub 2017 Mar 10. Biochimie. 2017. PMID: 28286312
-
Method for lipidomic analysis: p53 expression modulation of sulfatide, ganglioside, and phospholipid composition of U87 MG glioblastoma cells.Anal Chem. 2007 Nov 15;79(22):8423-30. doi: 10.1021/ac071413m. Epub 2007 Oct 12. Anal Chem. 2007. PMID: 17929901 Free PMC article.
-
Gangliosides of Human Glioblastoma Multiforme: A Comprehensive Mapping and Structural Analysis by Ion Mobility Tandem Mass Spectrometry.J Am Soc Mass Spectrom. 2021 May 5;32(5):1249-1257. doi: 10.1021/jasms.1c00088. Epub 2021 Apr 26. J Am Soc Mass Spectrom. 2021. PMID: 33900081
-
Molecular Heterogeneity and Immunosuppressive Microenvironment in Glioblastoma.Front Immunol. 2020 Jul 17;11:1402. doi: 10.3389/fimmu.2020.01402. eCollection 2020. Front Immunol. 2020. PMID: 32765498 Free PMC article. Review.
-
Membrane lipids modifications in human gliomas of different degree of malignancy.J Neurosurg Sci. 1992 Jan-Mar;36(1):11-25. J Neurosurg Sci. 1992. PMID: 1323645 Review.
Cited by
-
Multiplex protein imaging in tumour biology.Nat Rev Cancer. 2024 Mar;24(3):171-191. doi: 10.1038/s41568-023-00657-4. Epub 2024 Feb 5. Nat Rev Cancer. 2024. PMID: 38316945 Review.
-
MALDI-MSI-LC-MS/MS Workflow for Single-Section Single Step Combined Proteomics and Quantitative Lipidomics.Anal Chem. 2024 Mar 12;96(10):4266-4274. doi: 10.1021/acs.analchem.3c05850. Epub 2024 Mar 4. Anal Chem. 2024. PMID: 38469638 Free PMC article.
-
Advances in Mass Spectrometry of Gangliosides Expressed in Brain Cancers.Int J Mol Sci. 2024 Jan 22;25(2):1335. doi: 10.3390/ijms25021335. Int J Mol Sci. 2024. PMID: 38279335 Free PMC article. Review.
-
The tumour microenvironment, treatment resistance and recurrence in glioblastoma.J Transl Med. 2024 Jun 6;22(1):540. doi: 10.1186/s12967-024-05301-9. J Transl Med. 2024. PMID: 38844944 Free PMC article. Review.
-
DESI-MSI-guided exploration of metabolic-phenotypic relationships reveals a correlation between PI 38:3 and proliferating cells in clear cell renal cell carcinoma via single-section co-registration of multimodal imaging.Anal Bioanal Chem. 2024 Jul;416(18):4015-4028. doi: 10.1007/s00216-024-05339-0. Epub 2024 May 23. Anal Bioanal Chem. 2024. PMID: 38780655 Free PMC article.
References
Publication types
MeSH terms
Substances
LinkOut - more resources
Full Text Sources
Medical

