. 2022 Oct;610(7933):796-803.
doi: 10.1038/s41586-022-05314-8. Epub 2022 Oct 12.

Structures of the TMC-1 complex illuminate mechanosensory transduction

Affiliations

Structures of the TMC-1 complex illuminate mechanosensory transduction

Hanbin Jeong et al. Nature. 2022 Oct.

Abstract

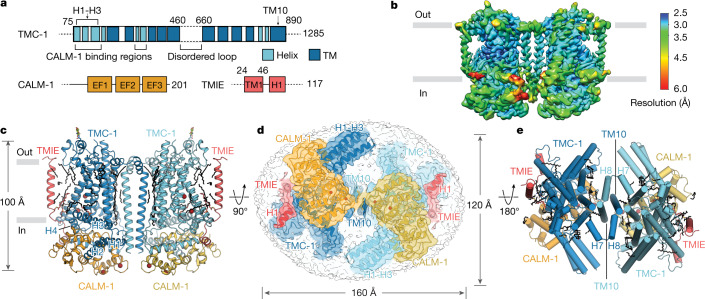
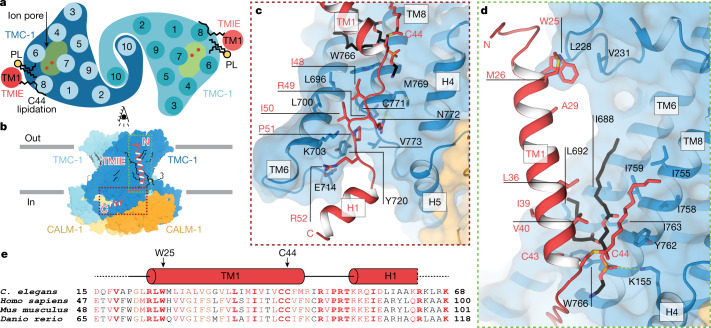
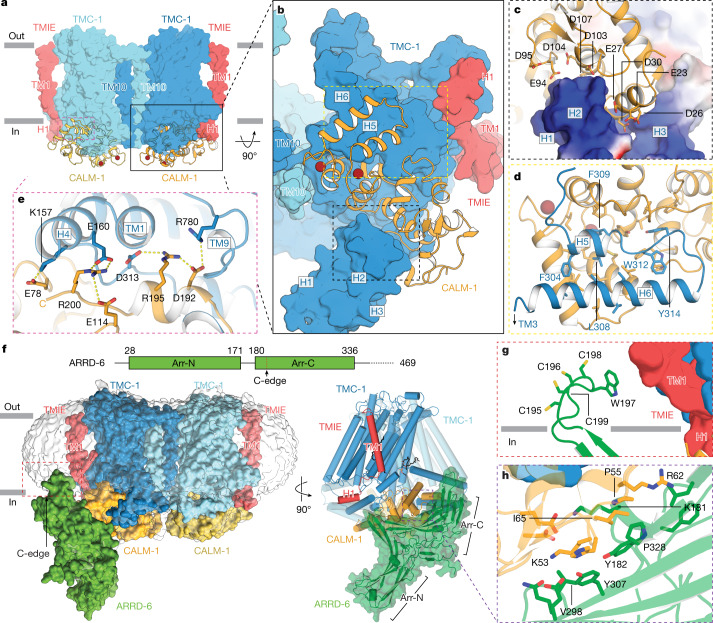
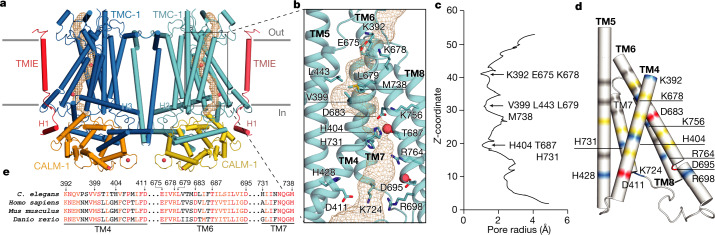
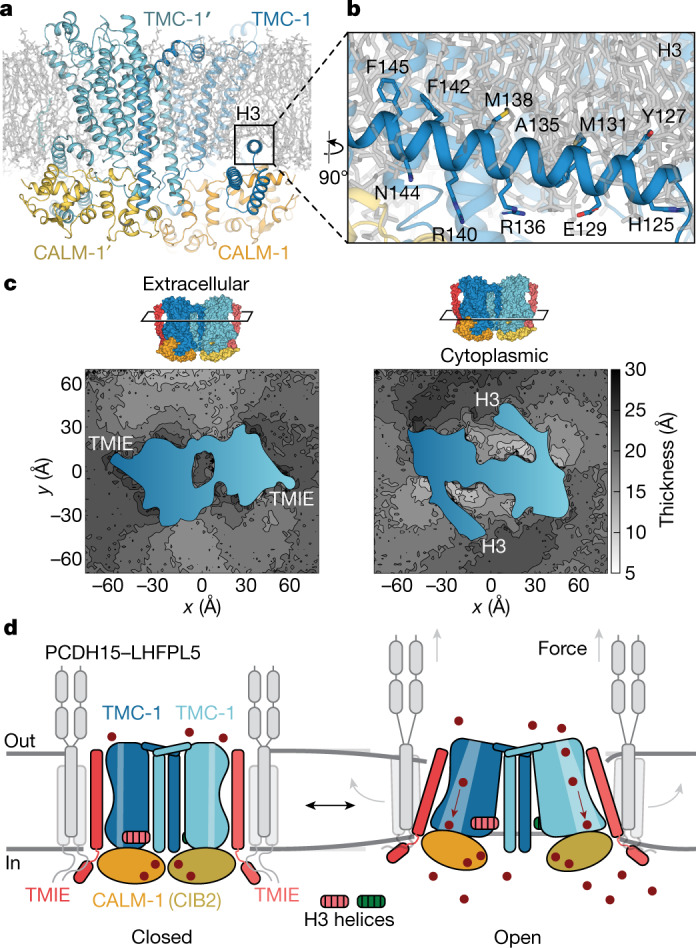
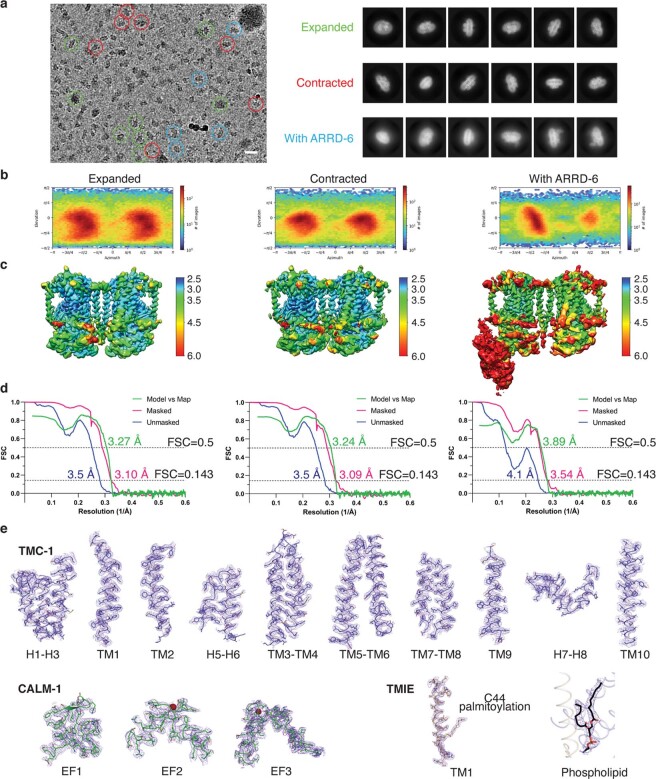
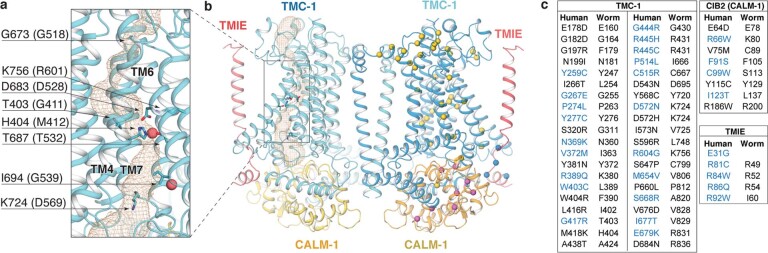
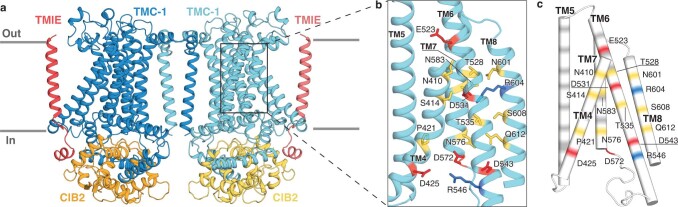
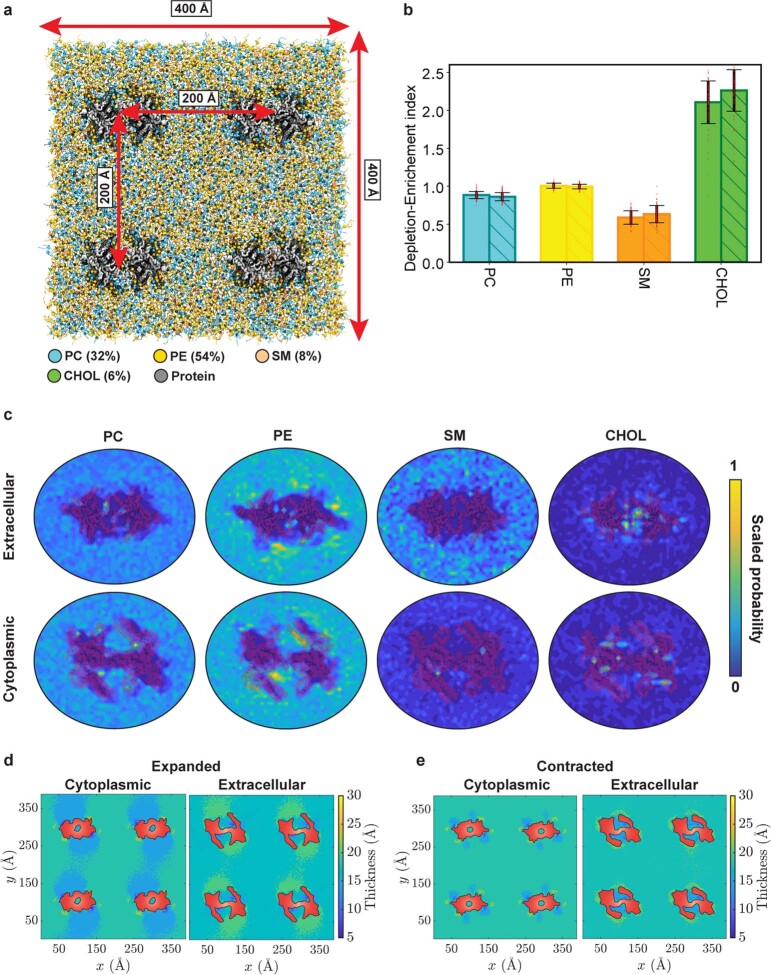
The initial step in the sensory transduction pathway underpinning hearing and balance in mammals involves the conversion of force into the gating of a mechanosensory transduction channel1. Despite the profound socioeconomic impacts of hearing disorders and the fundamental biological significance of understanding mechanosensory transduction, the composition, structure and mechanism of the mechanosensory transduction complex have remained poorly characterized. Here we report the single-particle cryo-electron microscopy structure of the native transmembrane channel-like protein 1 (TMC-1) mechanosensory transduction complex isolated from Caenorhabditis elegans. The two-fold symmetric complex is composed of two copies each of the pore-forming TMC-1 subunit, the calcium-binding protein CALM-1 and the transmembrane inner ear protein TMIE. CALM-1 makes extensive contacts with the cytoplasmic face of the TMC-1 subunits, whereas the single-pass TMIE subunits reside on the periphery of the complex, poised like the handles of an accordion. A subset of complexes additionally includes a single arrestin-like protein, arrestin domain protein (ARRD-6), bound to a CALM-1 subunit. Single-particle reconstructions and molecular dynamics simulations show how the mechanosensory transduction complex deforms the membrane bilayer and suggest crucial roles for lipid-protein interactions in the mechanism by which mechanical force is transduced to ion channel gating.


Conflict of interest statement

The authors declare no competing interests.

Figures

Fig. 1
Fig. 1. Architecture and subunit arrangement of the TMC-1 complex.
a, Schematic representation of protein constructs that co-purified with TMC-1. EF1–EF3, EF-hand domains; TM, transmembrane domain. b, Local resolution map of the native TMC-1 complex after 3D reconstruction. c, Overall architecture of the native TMC-1 complex, viewed parallel to the membrane. TMC-1 (dark blue and light blue), CALM-1 (orange and yellow) and TMIE (red and pink) are shown in a cartoon diagram. Lipid-like molecules, N-glycans and putative ions are coloured black, green, and dark red, respectively. d, Cytosolic view of the reconstructed map fit to the model. Subunit densities are coloured as in c and the detergent micelle is shown in grey. e, A top-down extracellular view of the TMC-1 complex shows the domain-swapped dimeric interface. α-helices are represented as cylinders.
Fig. 2
Fig. 2. TMIE resides on the periphery of the TMC-1 complex.
a, Schematic representation of TMC-1 (blue) and TMIE (red) transmembrane helices highlights the proximity of TMIE to the putative TMC-1 ion-conduction pathway. Palmitoylation of TMIE C44 and phospholipids (PL) is shown in black. b, Overview of the interaction interface between TMIE and TMC-1, viewed from the side. c, The interface between the TMIE ‘elbow’ and TMC-1. Interacting residues are shown as sticks. d, The interface between TMIE transmembrane helix and TMC-1, highlighting key residues and lipids. Palmitoylation is shown in red and phospholipid is shown in black. e, Multiple sequence alignment of TMIE orthologues. Elements of secondary structure are shown above the sequences and key residues are indicated with black arrows. Residues in black are not conserved, those in red are conservatively substituted, and those in bold red are conserved.
Fig. 3
Fig. 3. CALM-1 and ARRD-6 auxiliary subunits cap the cytoplasmic face of the TMC-1 complex.
a,b, The binding interface between CALM-1 and TMC-1 viewed parallel to the membrane (a) and perpendicular to the membrane (b). c, Binding interface between CALM-1 and TMC-1 H1–H3. The electrostatic surface of TMC-1 is shown, where blue represents positive regions and red represents negative regions. CALM-1 is shown in yellow. d, The interface between CALM-1 and TMC-1 H5 and H6. e, Salt bridges between the C terminus of CALM-1 and TMC-1. Putative hydrogen bonds are shown as dashed lines. f, Three-dimensional reconstruction of the TMC-1 complex with ARRD-6 viewed parallel to the membrane. TMC-1, CALM-1, TMIE, and ARRD-6 are shown in blue, yellow, red, and green, respectively. The red dashed rectangle indicates the putative insertion site of the ARRD-6 C-edge loop into the micelle. A schematic diagram of ARRD-6 is shown above the reconstruction, with arrestin N- (Arr-N) and C- (Arr-C) domains. g, The interface between the C-edge loop of ARRD-6 and the membrane. ARRD-6 residues that likely participate in membrane interactions are shown as sticks. h, The interface between ARRD-6 (green) and CALM-1 (yellow), highlighting residues that are important for the binding interaction.
Fig. 4
Fig. 4. The putative ion-conduction pore of TMC-1.
a, The location of the pore (gold mesh) is shown in the context of the TMC-1 complex. Putative calcium ions are shown as red spheres. b, An expanded view of the ion permeation pathway, highlighting pore-lining residues, shown as sticks, and putative ions (red). c, van der Waals radius of the pore plotted against the distance along the pore axis, calculated by MOLE 2.0. d, The electrostatic potential of pore-lining residues is depicted in different colours: grey, nonpolar; yellow, polar; red, acidic; and blue, basic. Acidic and basic residues are labelled. e, Multiple sequence alignment of selected residues from TMC-1 putative pore-forming helices.
Fig. 5
Fig. 5. Membrane integration and mechanism.
a, Molecular dynamics simulation of the membrane-embedded TMC-1 complex (E conformation) shows penetration of the H3 helix into the lipid bilayer. b, Key residues that define the amphipathic nature of the H3 helix are shown as sticks. c, Thickness patterns for extracellular and cytosolic membrane leaflets averaged over the last 500 ns of three simulated replicas for the E conformation. The pattern for the C conformation is shown in Extended Data Fig. 8. The cross-section of the protein is shown in blue and the location of the cross-section is indicated above the plots using a surface representation of the TMC-1 complex. d, Schematic illustrating mechanisms by which direct or indirect forces might be transduced to ion channel gating. Grey arrows (right) show how membrane tension could directly gate the TMC-1 complex by exerting force on TMIE. Indirect force as a result of changes in membrane thickness could affect the position of the membrane-embedded helix H3, modulating ion channel gating.
Extended Data Fig. 1
Extended Data Fig. 1. Dimeric TMC-1 complex from C. elegans copurifies with additional proteins.
a, Spectral confocal image of mVenus fluorescence in an adult tmc-1::mVenus worm showing mVenus fluorescence in the head neurons, cilia and body wall muscles. Shown is one representative image of five total images. b, Representative FSEC profile of the TMC-1 complex, detected via the mVenus tag. Inset shows a silver-stained, SDS-PAGE gel of the purified TMC-1 complex. Red asterisk indicates TMC-1. The experiments were repeated two times with similar results. Thyroglobulin (669 kDa) and apo ferritin (443 kDa) were used for protein molecular mass standards. c, The distribution of mVenus photobleaching steps for the TMC-1 complex is consistent with a binomial function (grey bars) an assembly with two fluorophores. A total of n = 600 spots were analysed from three photobleaching movies (200 spots per movie) at random locations in the imaging chamber. Each movie is represented by a blue dot. d, Images are shown for the SEC-purified mVenus-tagged TMC-1 complex captured with biotinylated anti-GFP nanobody. Scale bar = 5 µm. e, Representative trace showing the two-step photobleaching (red arrows) of the mVenus-tagged TMC-1 complex.
Extended Data Fig. 2
Extended Data Fig. 2. MS analysis of the TMC-1 complex.
a, Proteins detected by MS, via their associated peptide fragments, are listed with their gene name and molecular mass. The number of identified unique peptides from both the native TMC-1 complex and from wild-type worms (C. elegans N2), used as a control, are also indicated. b, Amino acid sequence and secondary structure of C. elegans TMC-1 are shown. The secondary structure based on the cryo-EM structure is indicated above the sequences as cylinders (α-helices), black lines (loop regions), or dashed lines (disordered residues). Red lines above the sequences indicate C. elegans peptides found by MS.  . Note that the TMC-1 segments, corresponding to the sequence of 13–33, 557–566, 567–587, 877–890, 897–904, 917–927, 972–996, 1041–1052, 1177–1190, 1192–1216, and 1261–1269 are also found by MS, but not indicated in b.
Extended Data Fig. 3
Extended Data Fig. 3. Cryo-EM processing workflow of E and C conformations.
Flow chart for cryo-EM data analysis of E and C conformation of the TMC-1 complex.
Extended Data Fig. 4
Extended Data Fig. 4. Cryo-EM processing workflow of TMC-1 complex with ARRD-6.
Flow chart for cryo-EM data analysis of the TMC-1 complex with ARRD-6.
Extended Data Fig. 5
Extended Data Fig. 5. Cryo-EM classes, statistics, angular distributions and selected sections of density maps.
a, A representative cryo-EM micrograph of the TMC-1 complex together with several 2D classes of each major 3D class. Each different colored circle (green, red, and blue) on the micrograph indicates particles that were classified to each conformation-Expanded, Contracted, and With ARRD-6, respectively. Scale bar = 200 Å. b, Angular distributions of final reconstructions. c, Electron density map of each model colored by local resolution values. d, Fourier shell correlations (FSC) curve for each model. e, Fragments of cryo-EM density map and atomic model of TMC-1 and each auxiliary subunit. The cryo-EM maps are shown as purple mesh.
Extended Data Fig. 6
Extended Data Fig. 6. Structural comparison of TMEM16, OSCA1.2, and the TMC-1 complex.
a, b, c. Structures of TMEM16A (5OYB), OSCA1.2 (6MGV), and the TMC-1 complex viewed from the same relative perspectives. The side views of the transmembrane regions and the top-down views are shown in the cartoon model. Putative ions are shown as red spheres.
Extended Data Fig. 7
Extended Data Fig. 7. The locations of key mutations mapped onto the TMC-1 complex.
a, The locations of cysteine mutations that perturb TMC-1 single channel conductance in mice are shown on the C. elegans TMC-1 complex. The C. elegans residue number is labeled and the corresponding mouse residue is indicated in parentheses. b, The structure of the TMC-1 complex and the locations of mutations associated with hearing loss or deafness. Cα positions of the residues in question are shown as yellow (TMC-1), purple (CALM-1), or blue (TMIE) spheres. c, A table of the residues shown in panel b. Mutations linked to hearing loss and deafness in humans are colored black and blue, respectively.
Extended Data Fig. 8
Extended Data Fig. 8. Residue composition of the putative ion conduction pathway of the human TMC-1 complex homology model.
a, Homology model of human TMC-1 complex: TMC-1 (dark blue and light blue), CIB2 (orange and yellow), and TMIE (red and pink). b, An expanded view of the putative ion conduction pathway, highlighting pore-lining residues. Polar (yellow), acidic (red), and basic (blue) residues are shown as sticks. c, Electrostatic potential of pore-lining residues are depicted in different colors: grey = nonpolar, yellow = polar, red = acidic, blue = basic. Acidic, basic, and polar residues are labeled.
Extended Data Fig. 9
Extended Data Fig. 9. Expanded (E) and Contracted (C) conformations of the TMC-1 complex.
a, A TMC-1 protomer in the E conformation (blue) and the C conformation (green), superposed based on backbone alpha-carbon atoms, highlighting conformational changes in TMC-1, as well as CALM-1 and TMIE. The axis of rotation is shown as a red bar and arrows indicate the direction of rotation from the C to the E state. b, Membrane thickness in the C conformation calculated from the last 500 ns of the atomistic MD trajectories, averaged over all the three simulation replicas. Heatmaps corresponding to the thickness of extracellular and cytoplasmic leaflets are shown in left and right panels, respectively.
Extended Data Fig. 10
Extended Data Fig. 10. Coarse-grained MD simulations of TMC-1 complex in a membrane bilayer.
a, Four TMC-1 complexes (gray) in the E conformation embedded in a lipid bilayer composed of PC, PE, SM, and cholesterol (CHOL) shown in cyan, yellow, orange, and green, respectively, with a molar ratio of 32:54:8:6. b, Enrichment-depletion indexes of each lipid component in the proximity of the protein obtained from the simulations of the E (solid bars) and C (striped bars) conformations. PC and PE densities in the bulk and in proximity of the protein are similar, whereas SM is depleted and CHOL is enriched in the vicinity of the protein relative to their bulk concentrations. Data points are shown as red dots. Mean and error bars are calculated from 1000 data points in each bar plot and error bars are standard deviations of the data. c, Heatmaps representing distributions of different lipid species around the protein in the E conformation. Each distribution is calculated from the last 5 μs of the trajectory and averaged over all four protein copies. d and e, Thickness patterns calculated for the extracellular and cytoplasmic leaflets averaged over the last 5 𝜇s of the CG trajectories of the E and C conformations, respectively. The cross-section of the protein is shown in red. The color scale represents the thickness of each leaflet, with blue and yellow corresponding to thinning and thickening, respectively. E and C conformations generate different membrane deformation patterns.

Similar articles

Cited by

References

    1. Musiek, F. E. & Baran, J. A. The Auditory System: Anatomy, Physiology, and Clinical Correlates, 2nd edn (Plural Publishing, 2020).
    1. Zheng W, Holt JR. The mechanosensory transduction machinery in inner ear hair cells. Annu. Rev. Biophys. 2021;50:31–51. doi: 10.1146/annurev-biophys-062420-081842. - DOI - PMC - PubMed
    1. Kazmierczak P, et al. Cadherin 23 and protocadherin 15 interact to form tip-link filaments in sensory hair cells. Nature. 2007;449:87–91. doi: 10.1038/nature06091. - DOI - PubMed
    1. Sakaguchi H, Tokita J, Muller U, Kachar B. Tip links in hair cells: molecular composition and role in hearing loss. Curr. Opin. Otolaryngol. Head Neck Surg. 2009;17:388–393. doi: 10.1097/MOO.0b013e3283303472. - DOI - PMC - PubMed
    1. Kurima K, et al. Dominant and recessive deafness caused by mutations of a novel gene, TMC1, required for cochlear hair-cell function. Nat. Genet. 2002;30:277–284. doi: 10.1038/ng842. - DOI - PubMed

Publication types

MeSH terms