. 2022 Oct;610(7933):783-790.
doi: 10.1038/s41586-022-05312-w. Epub 2022 Oct 12.

Activation of γ-globin expression by hypoxia-inducible factor 1α

Affiliations

Activation of γ-globin expression by hypoxia-inducible factor 1α

Ruopeng Feng et al. Nature. 2022 Oct.

Abstract

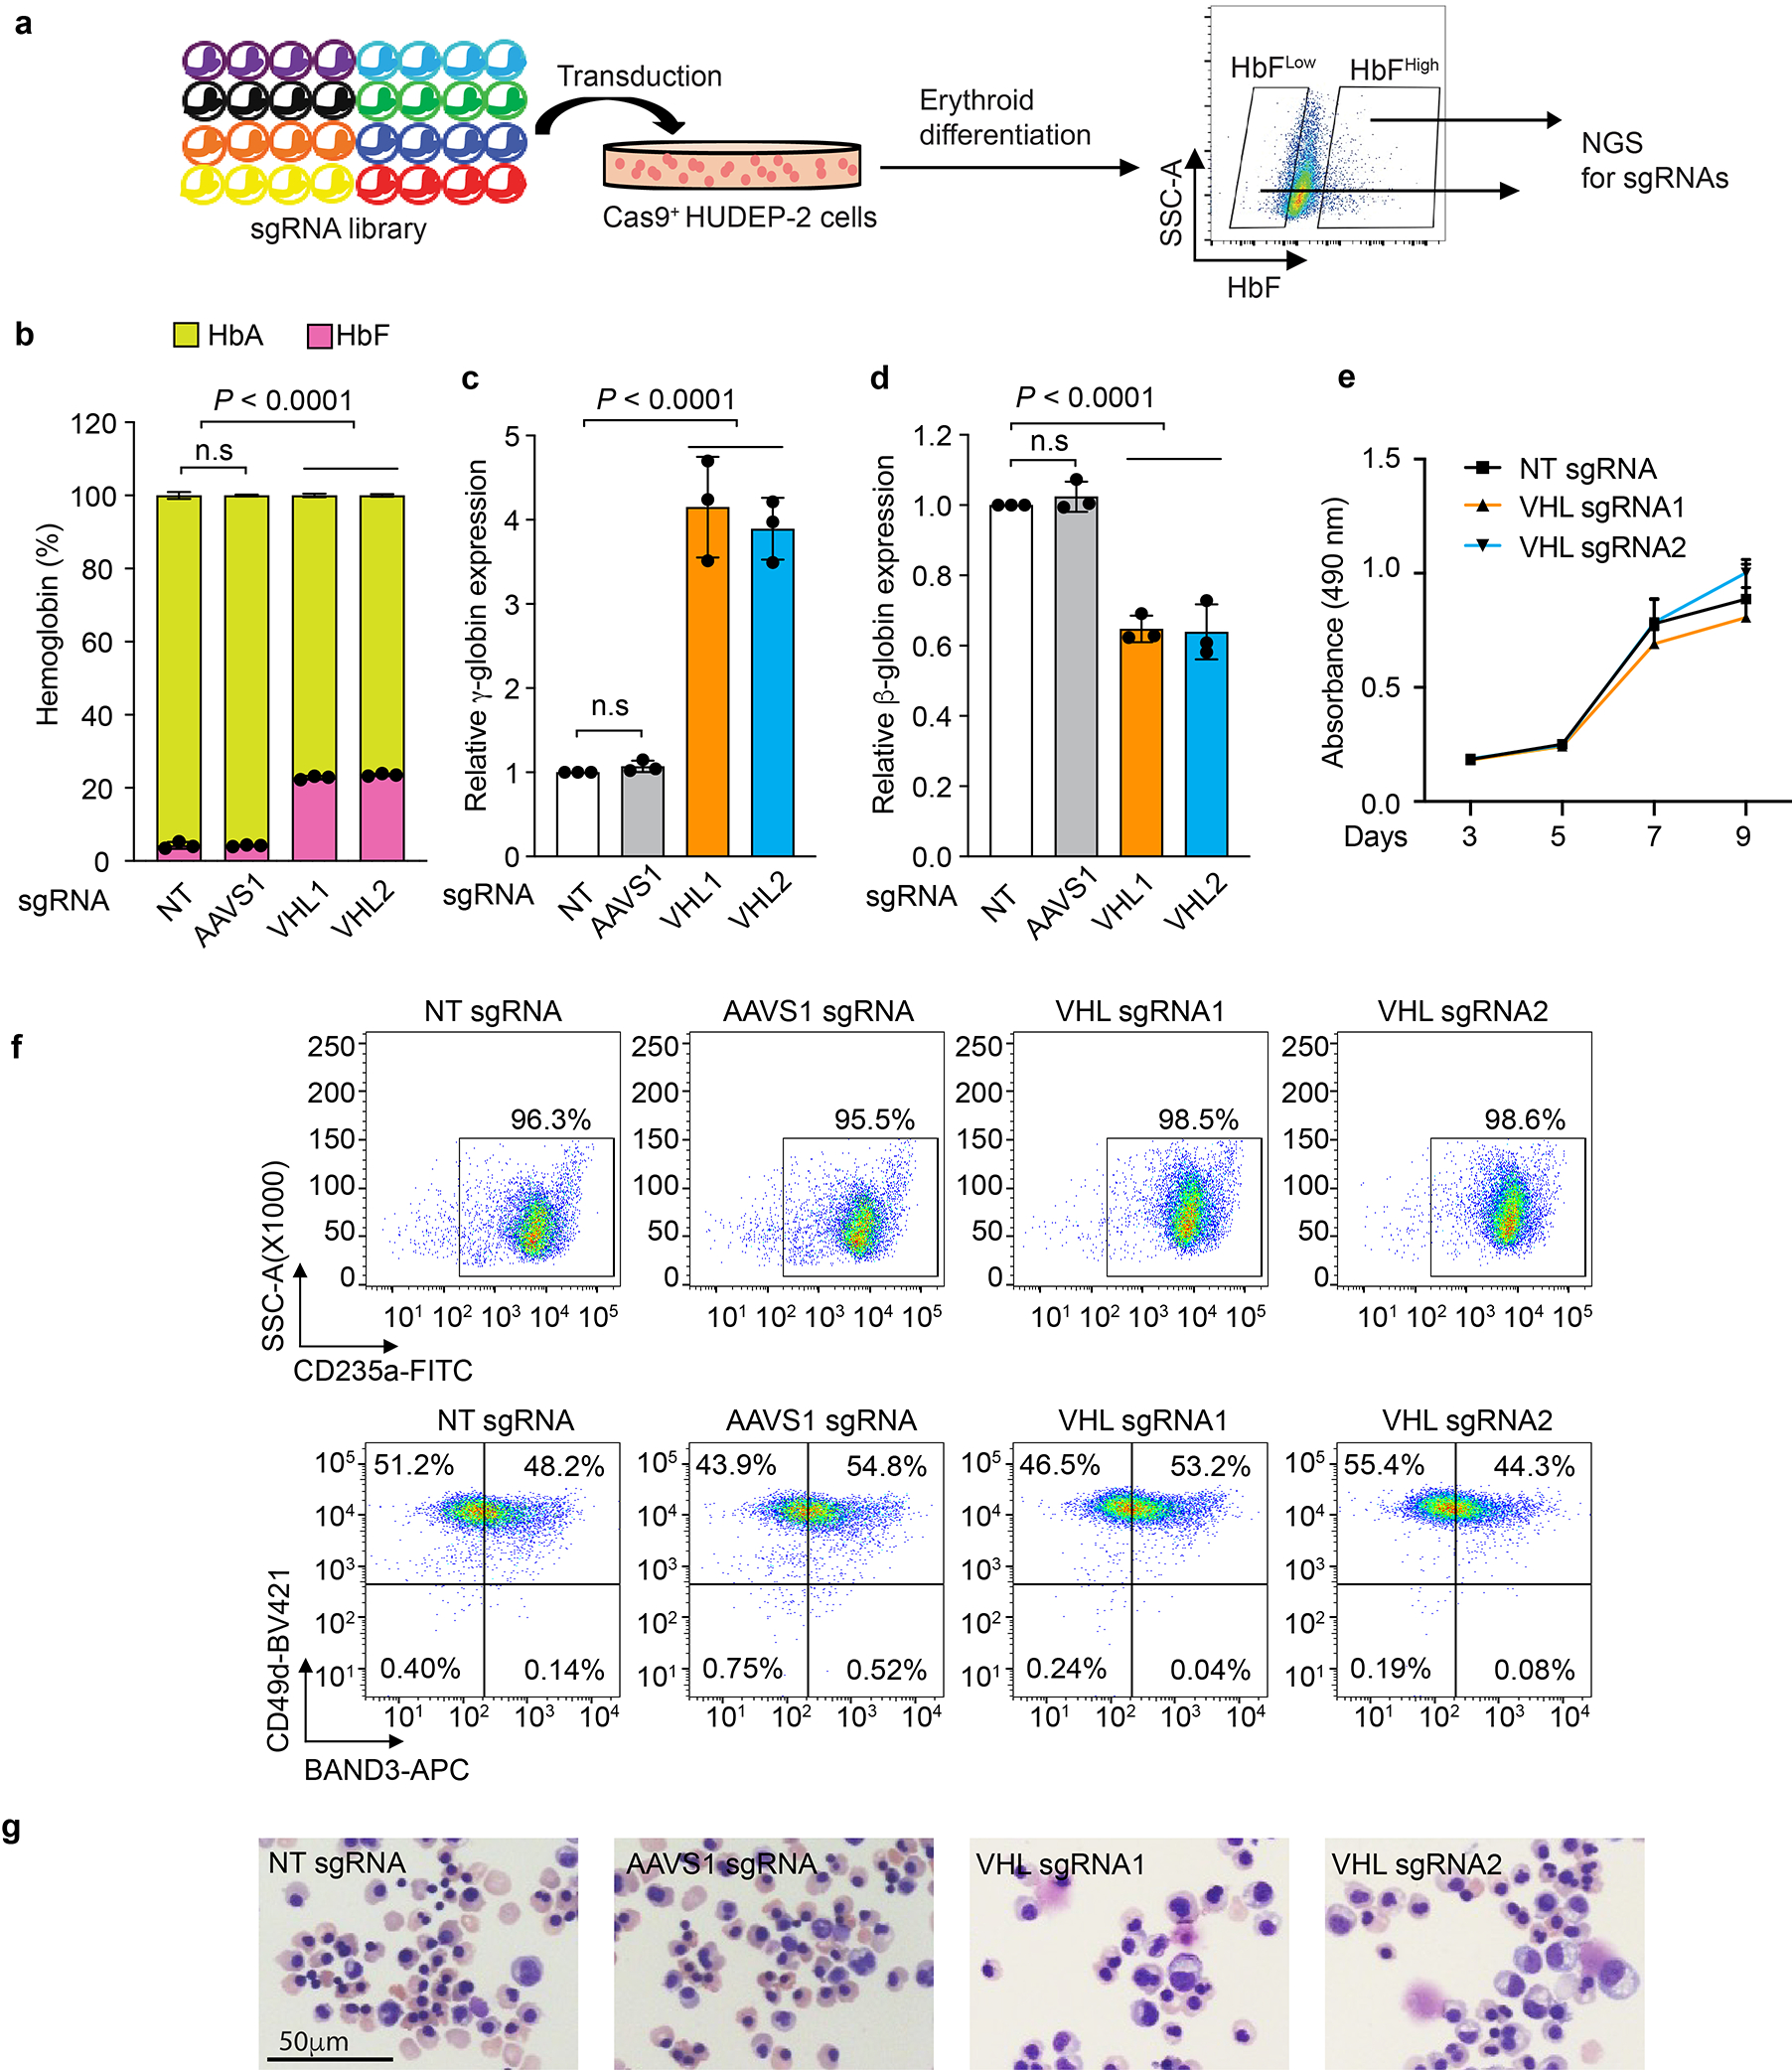
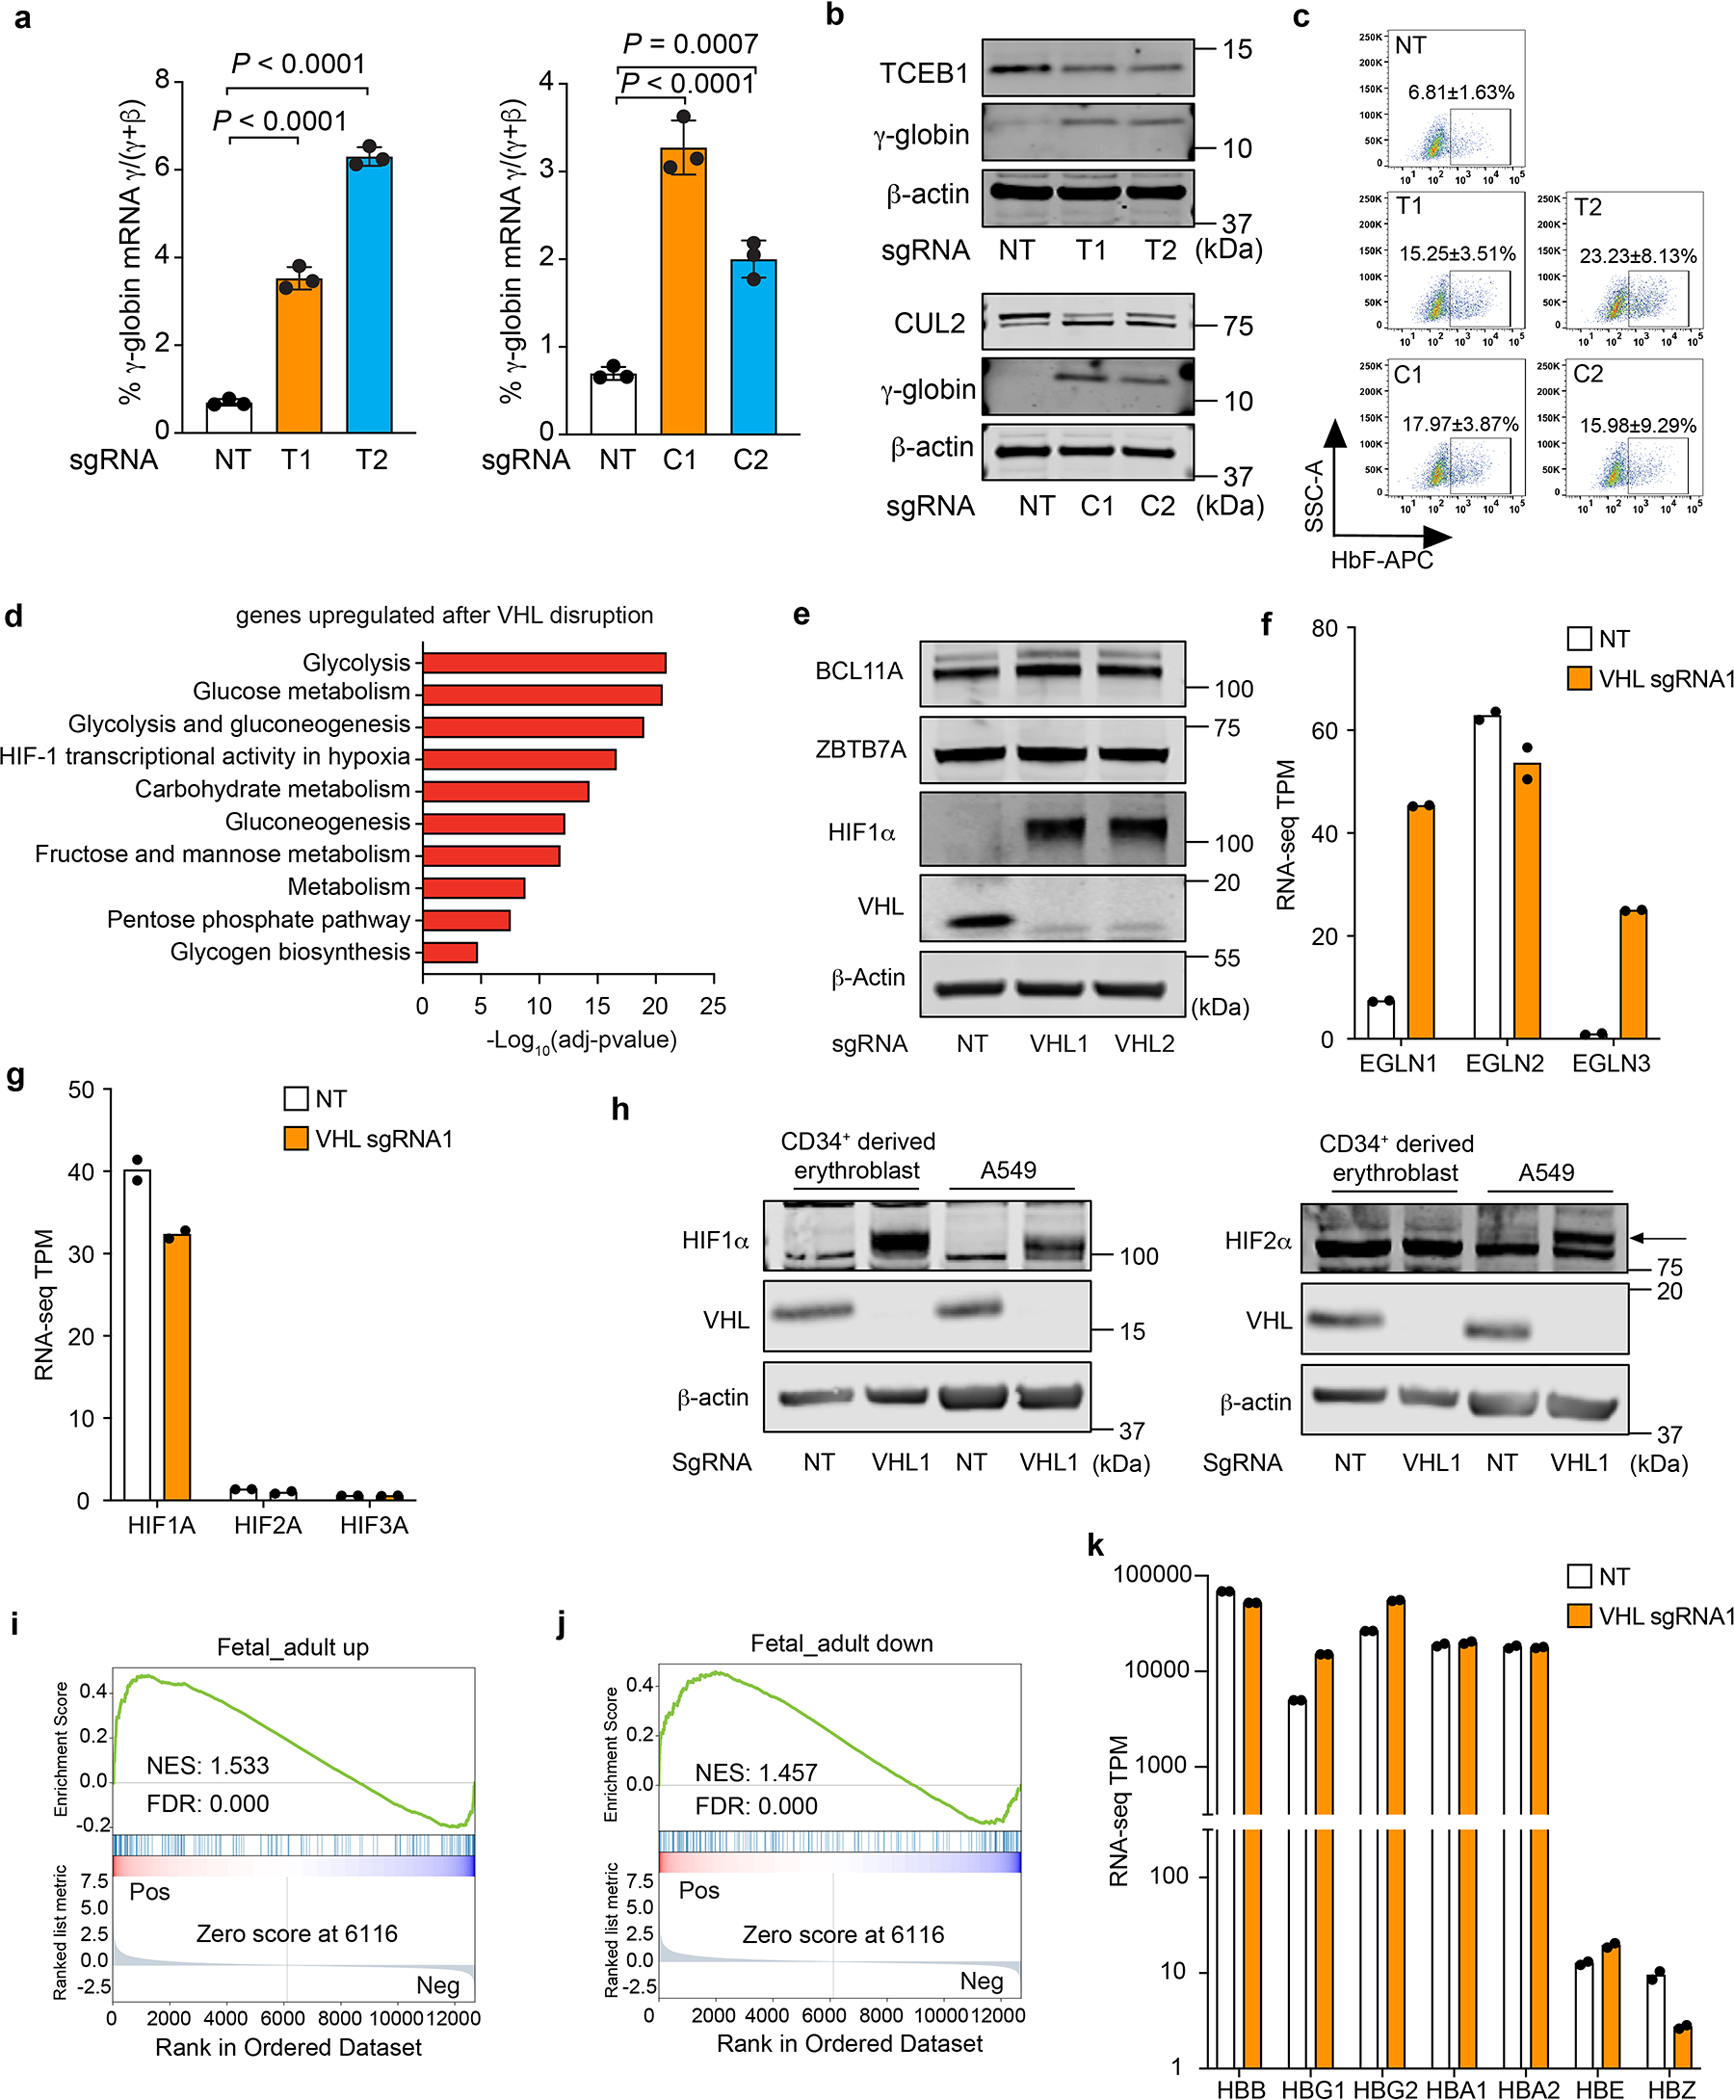
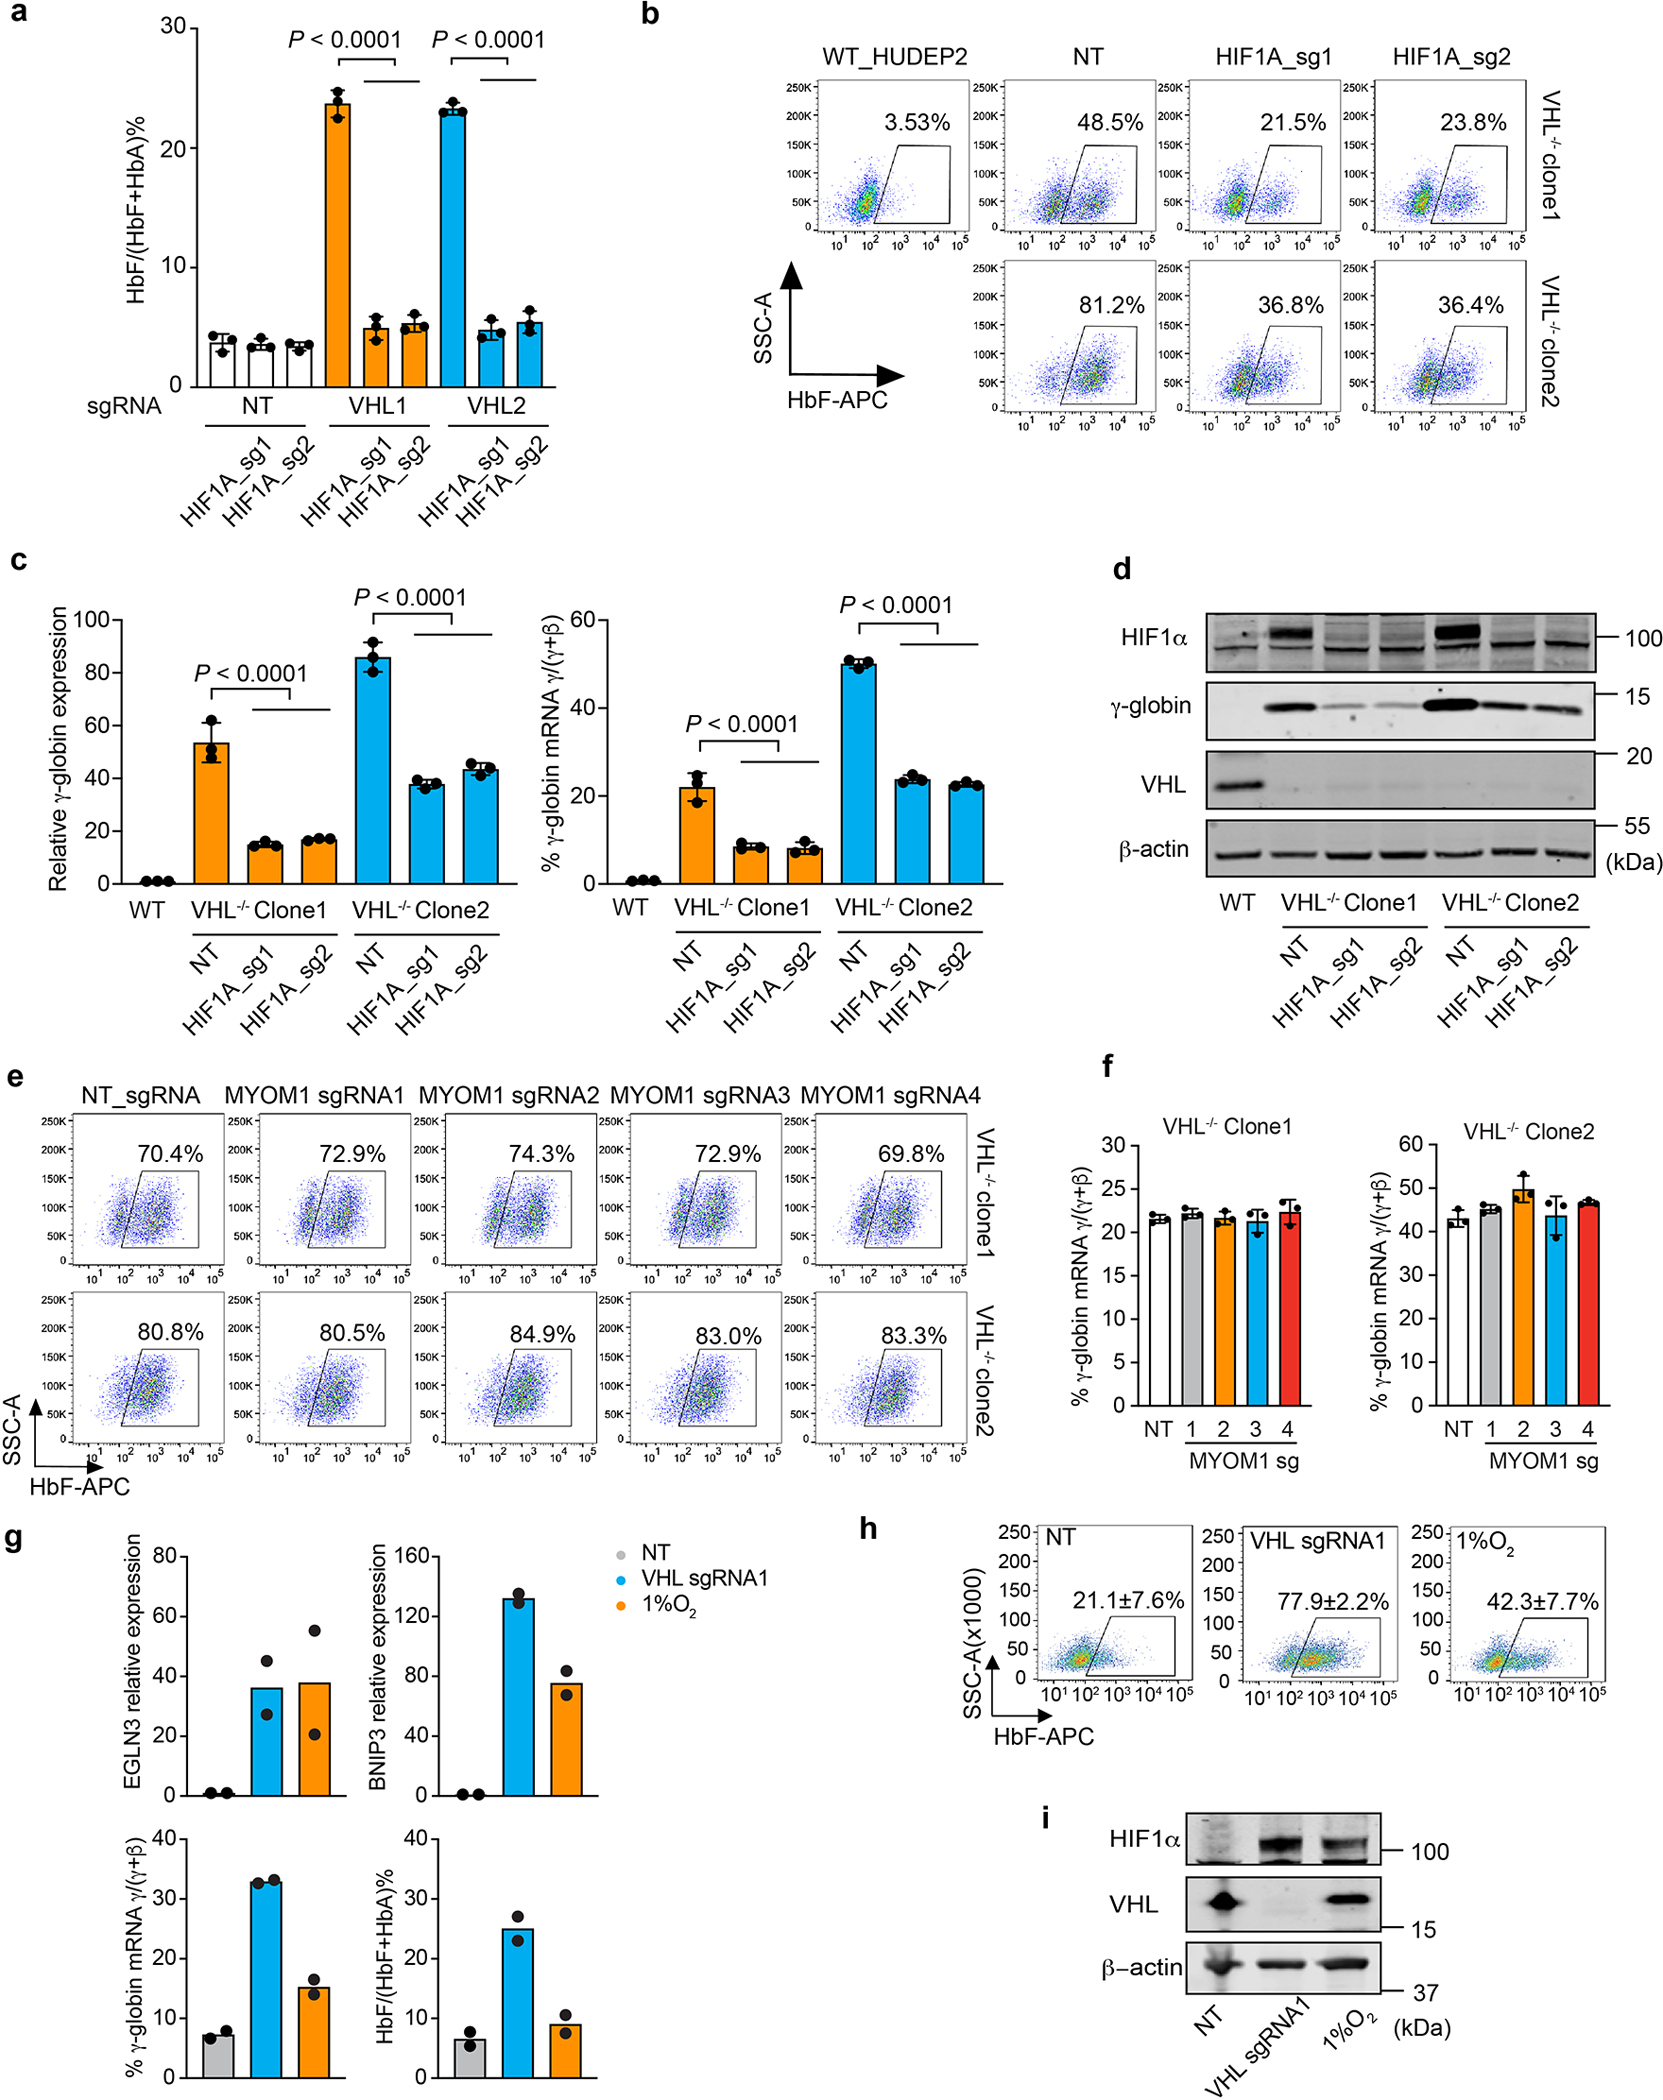
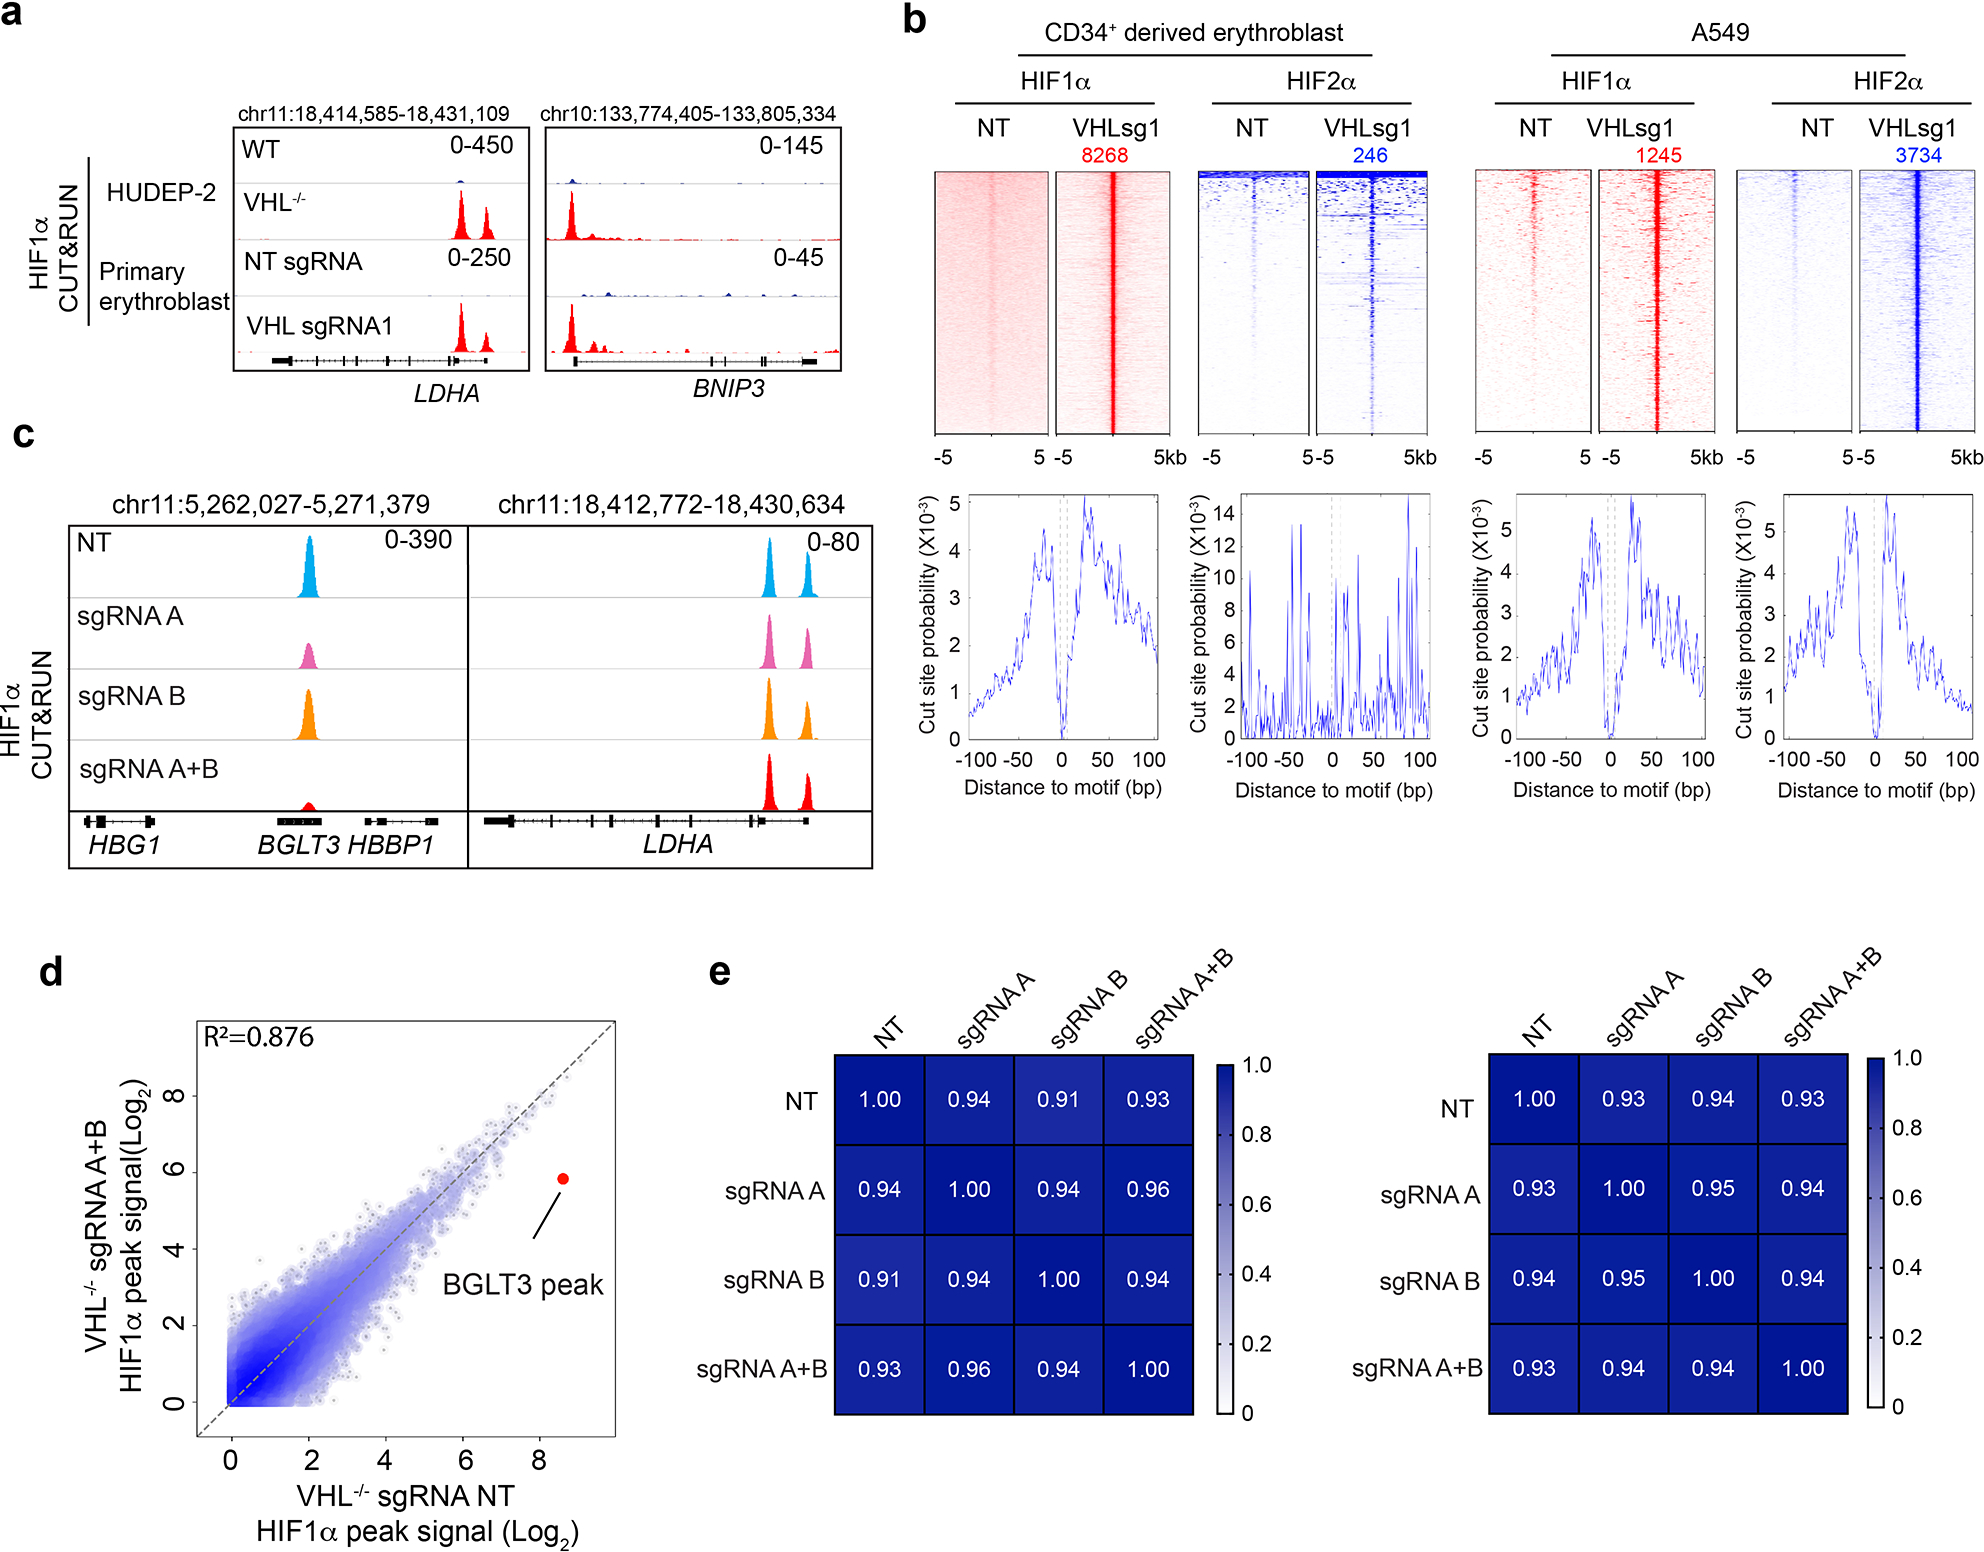
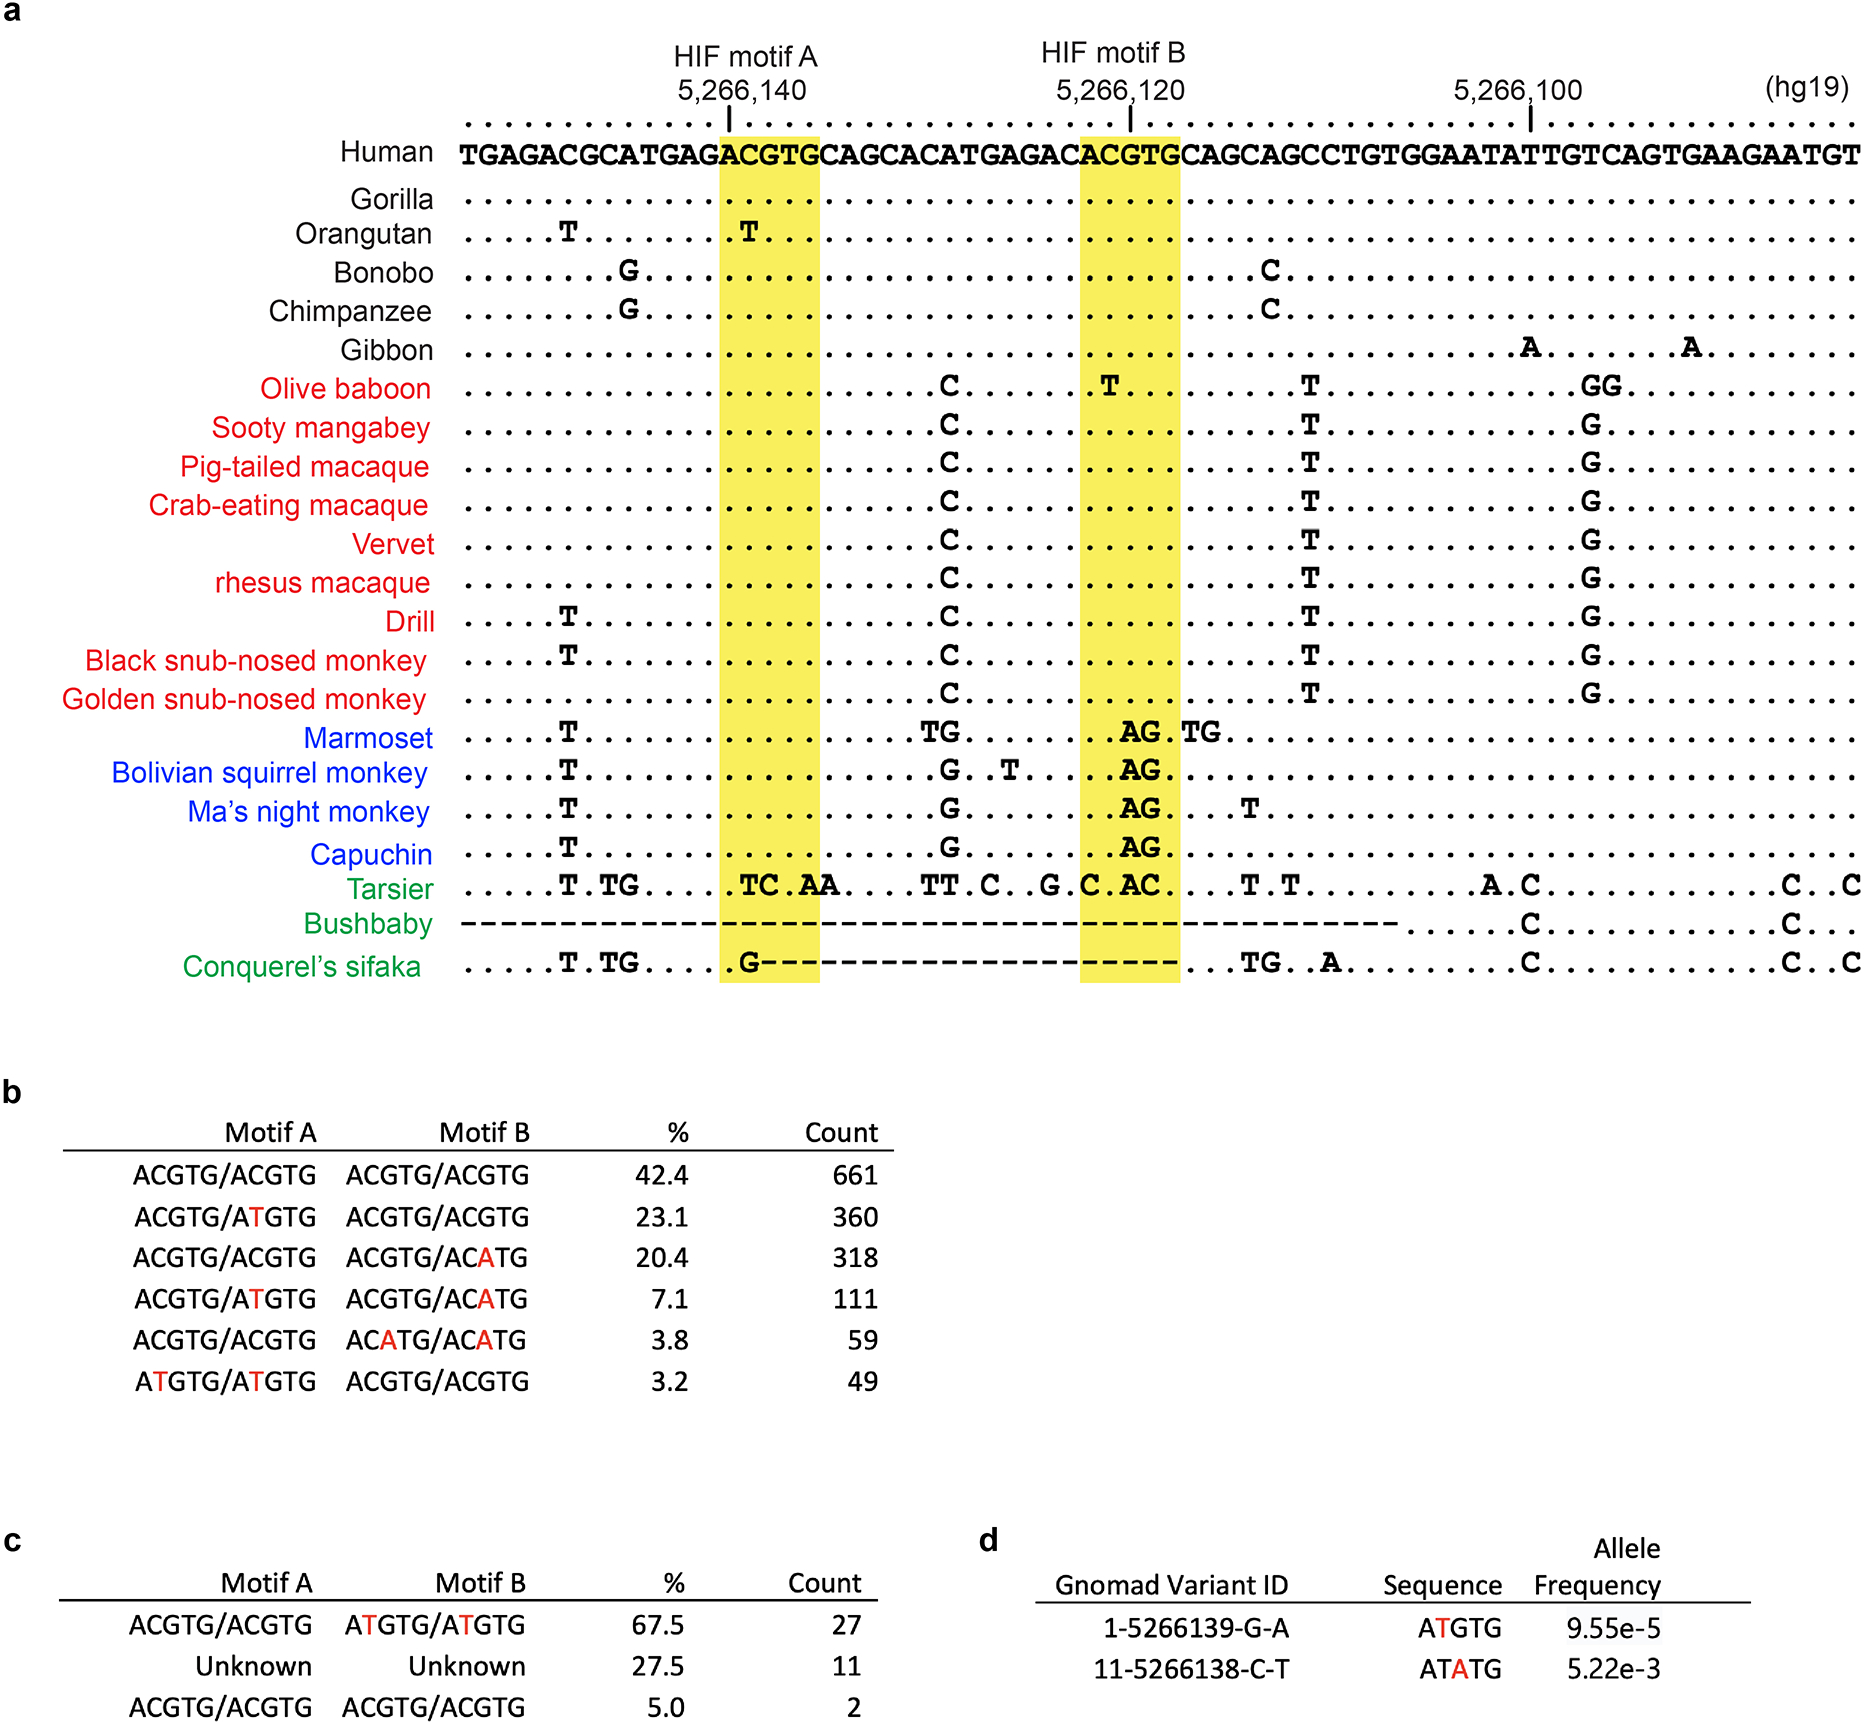
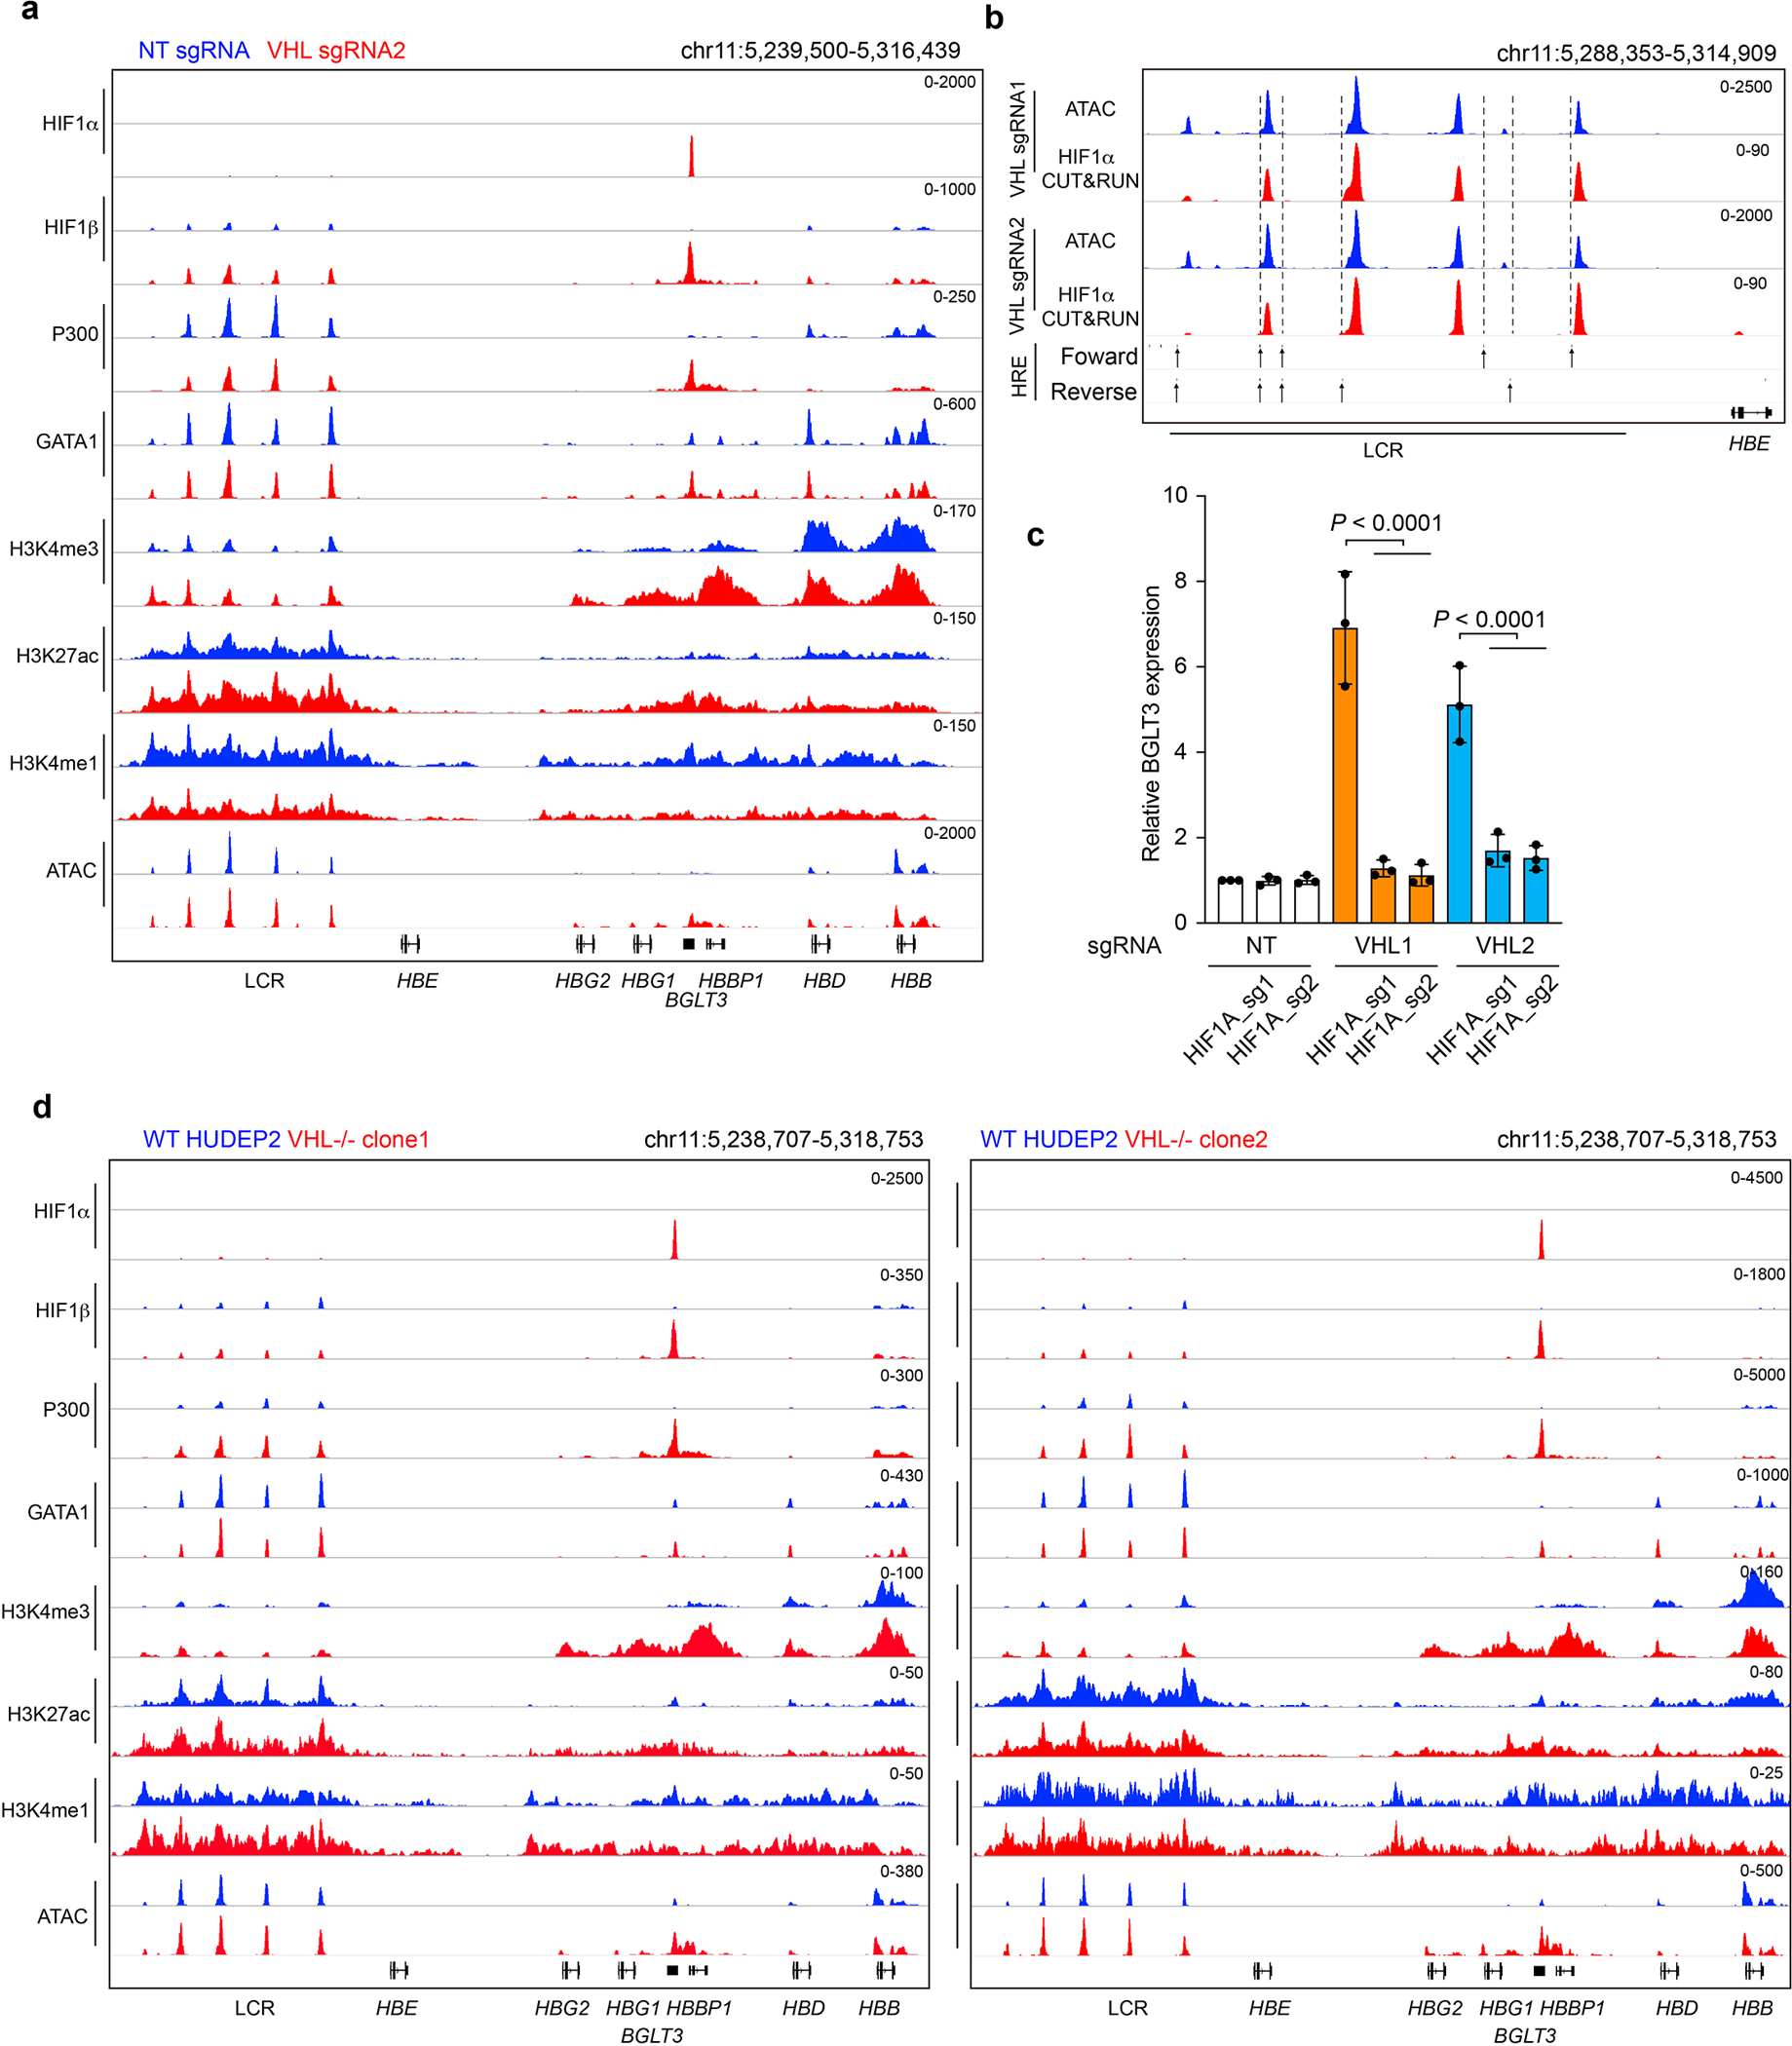
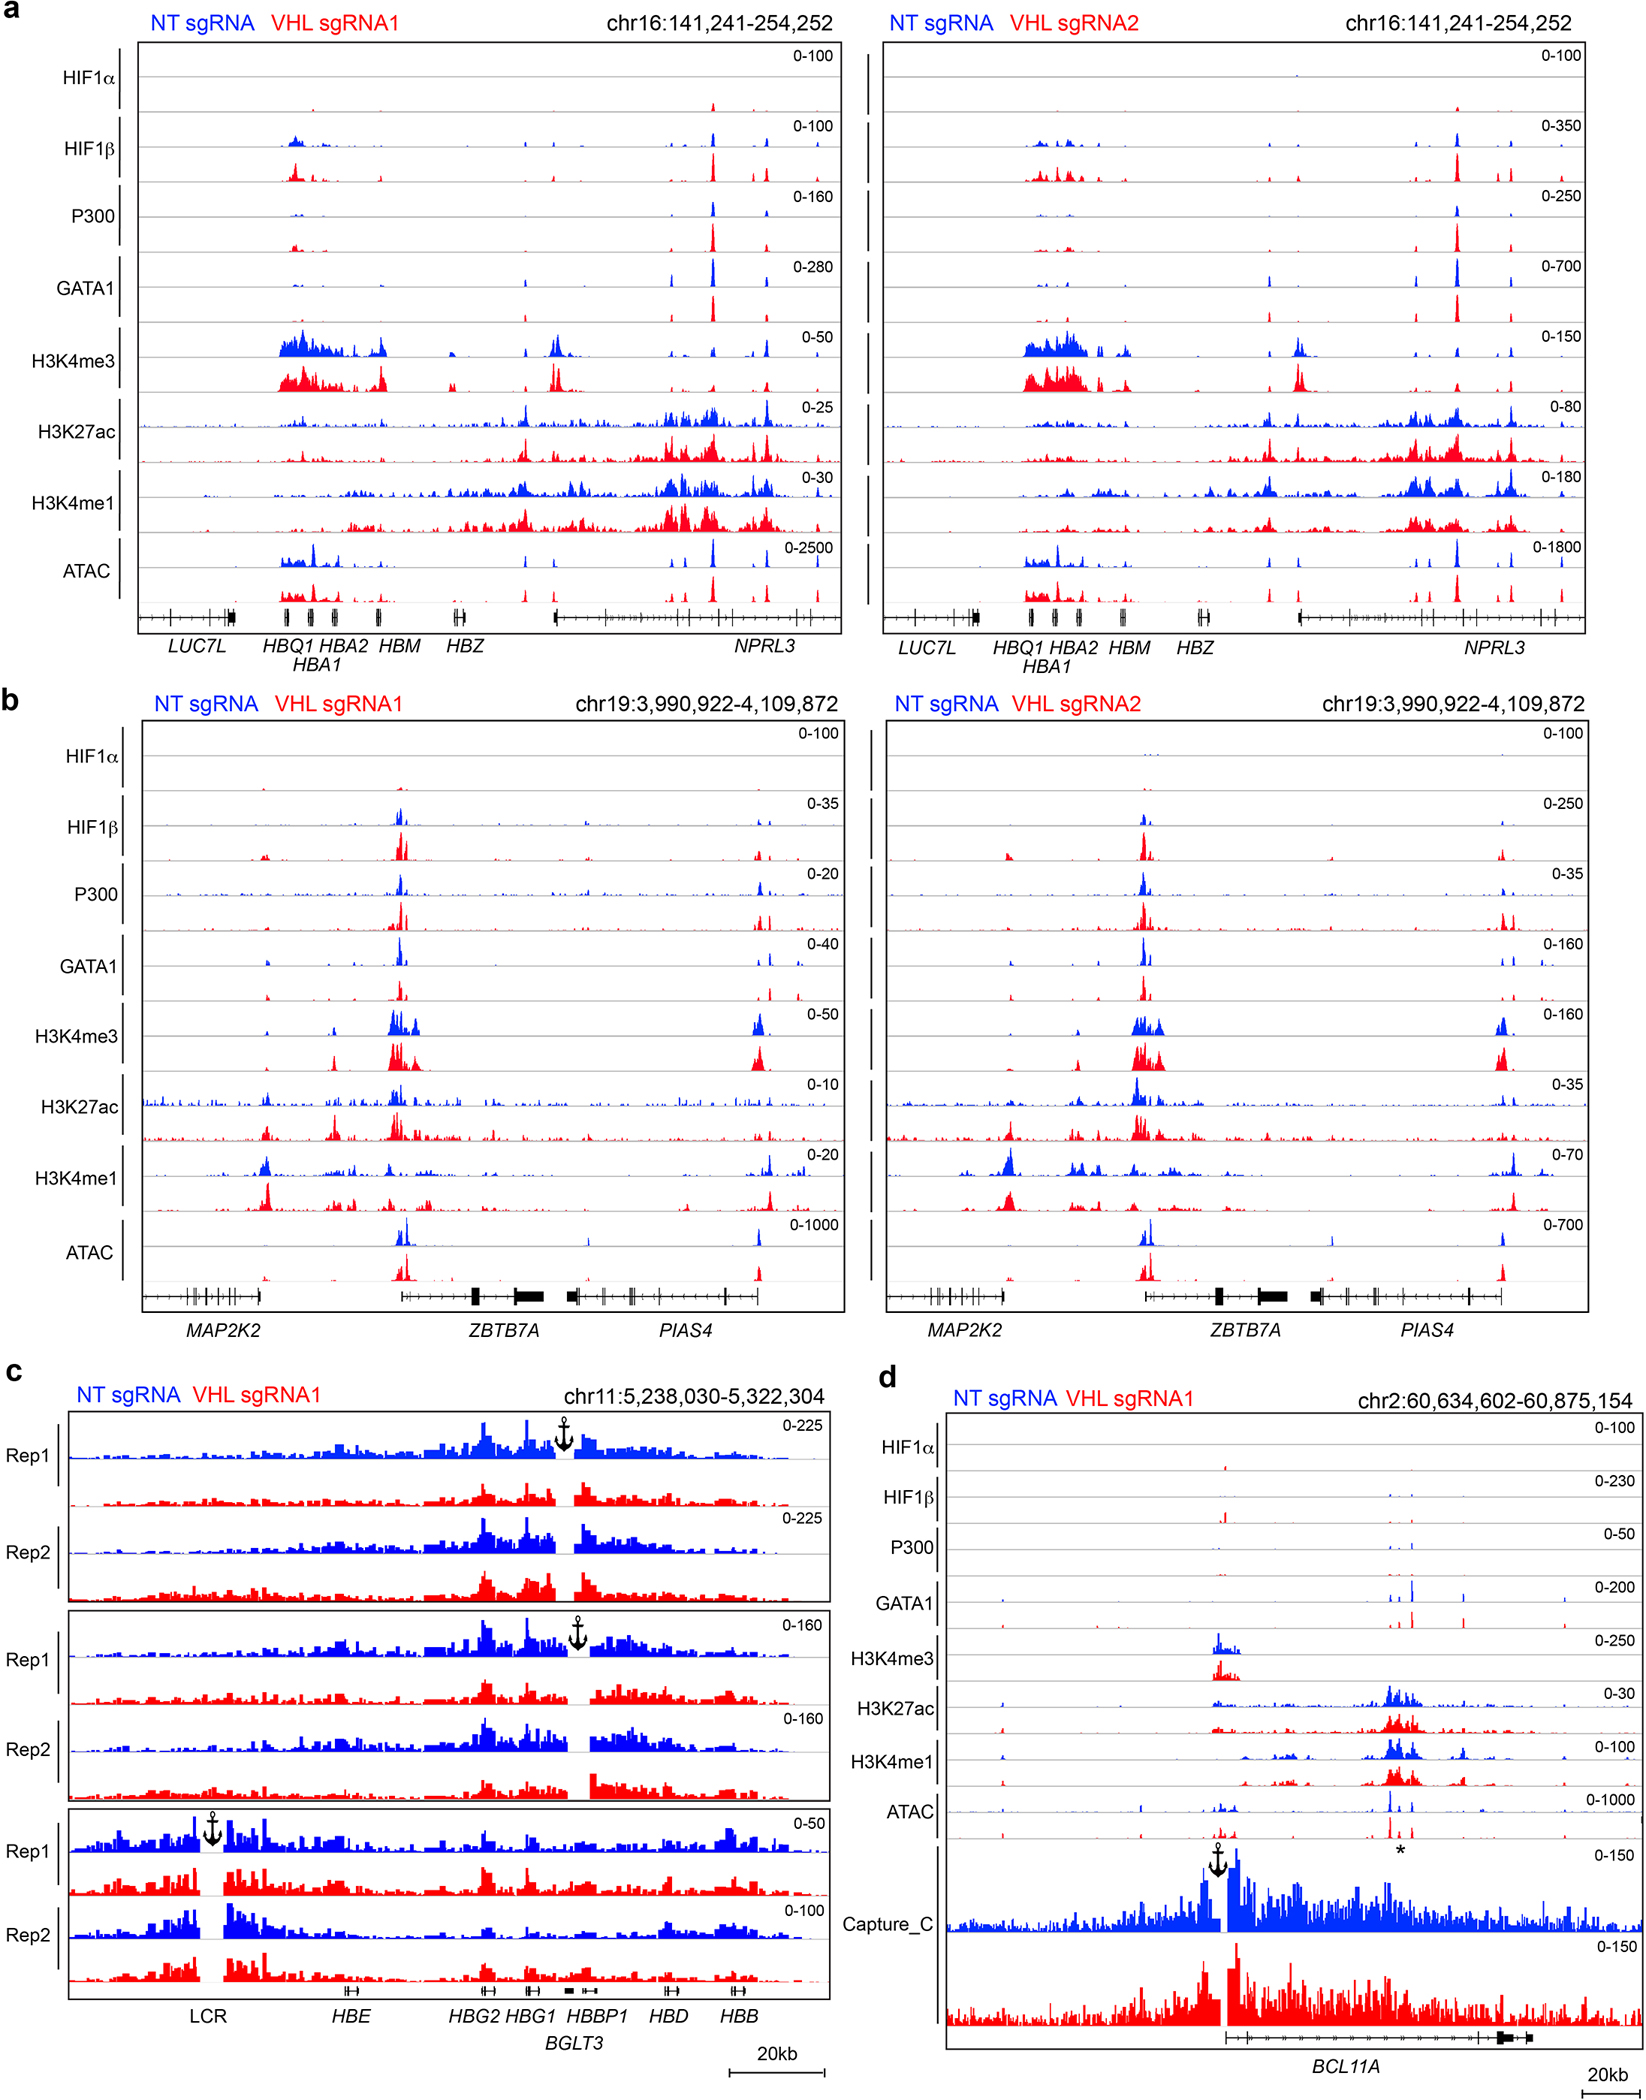
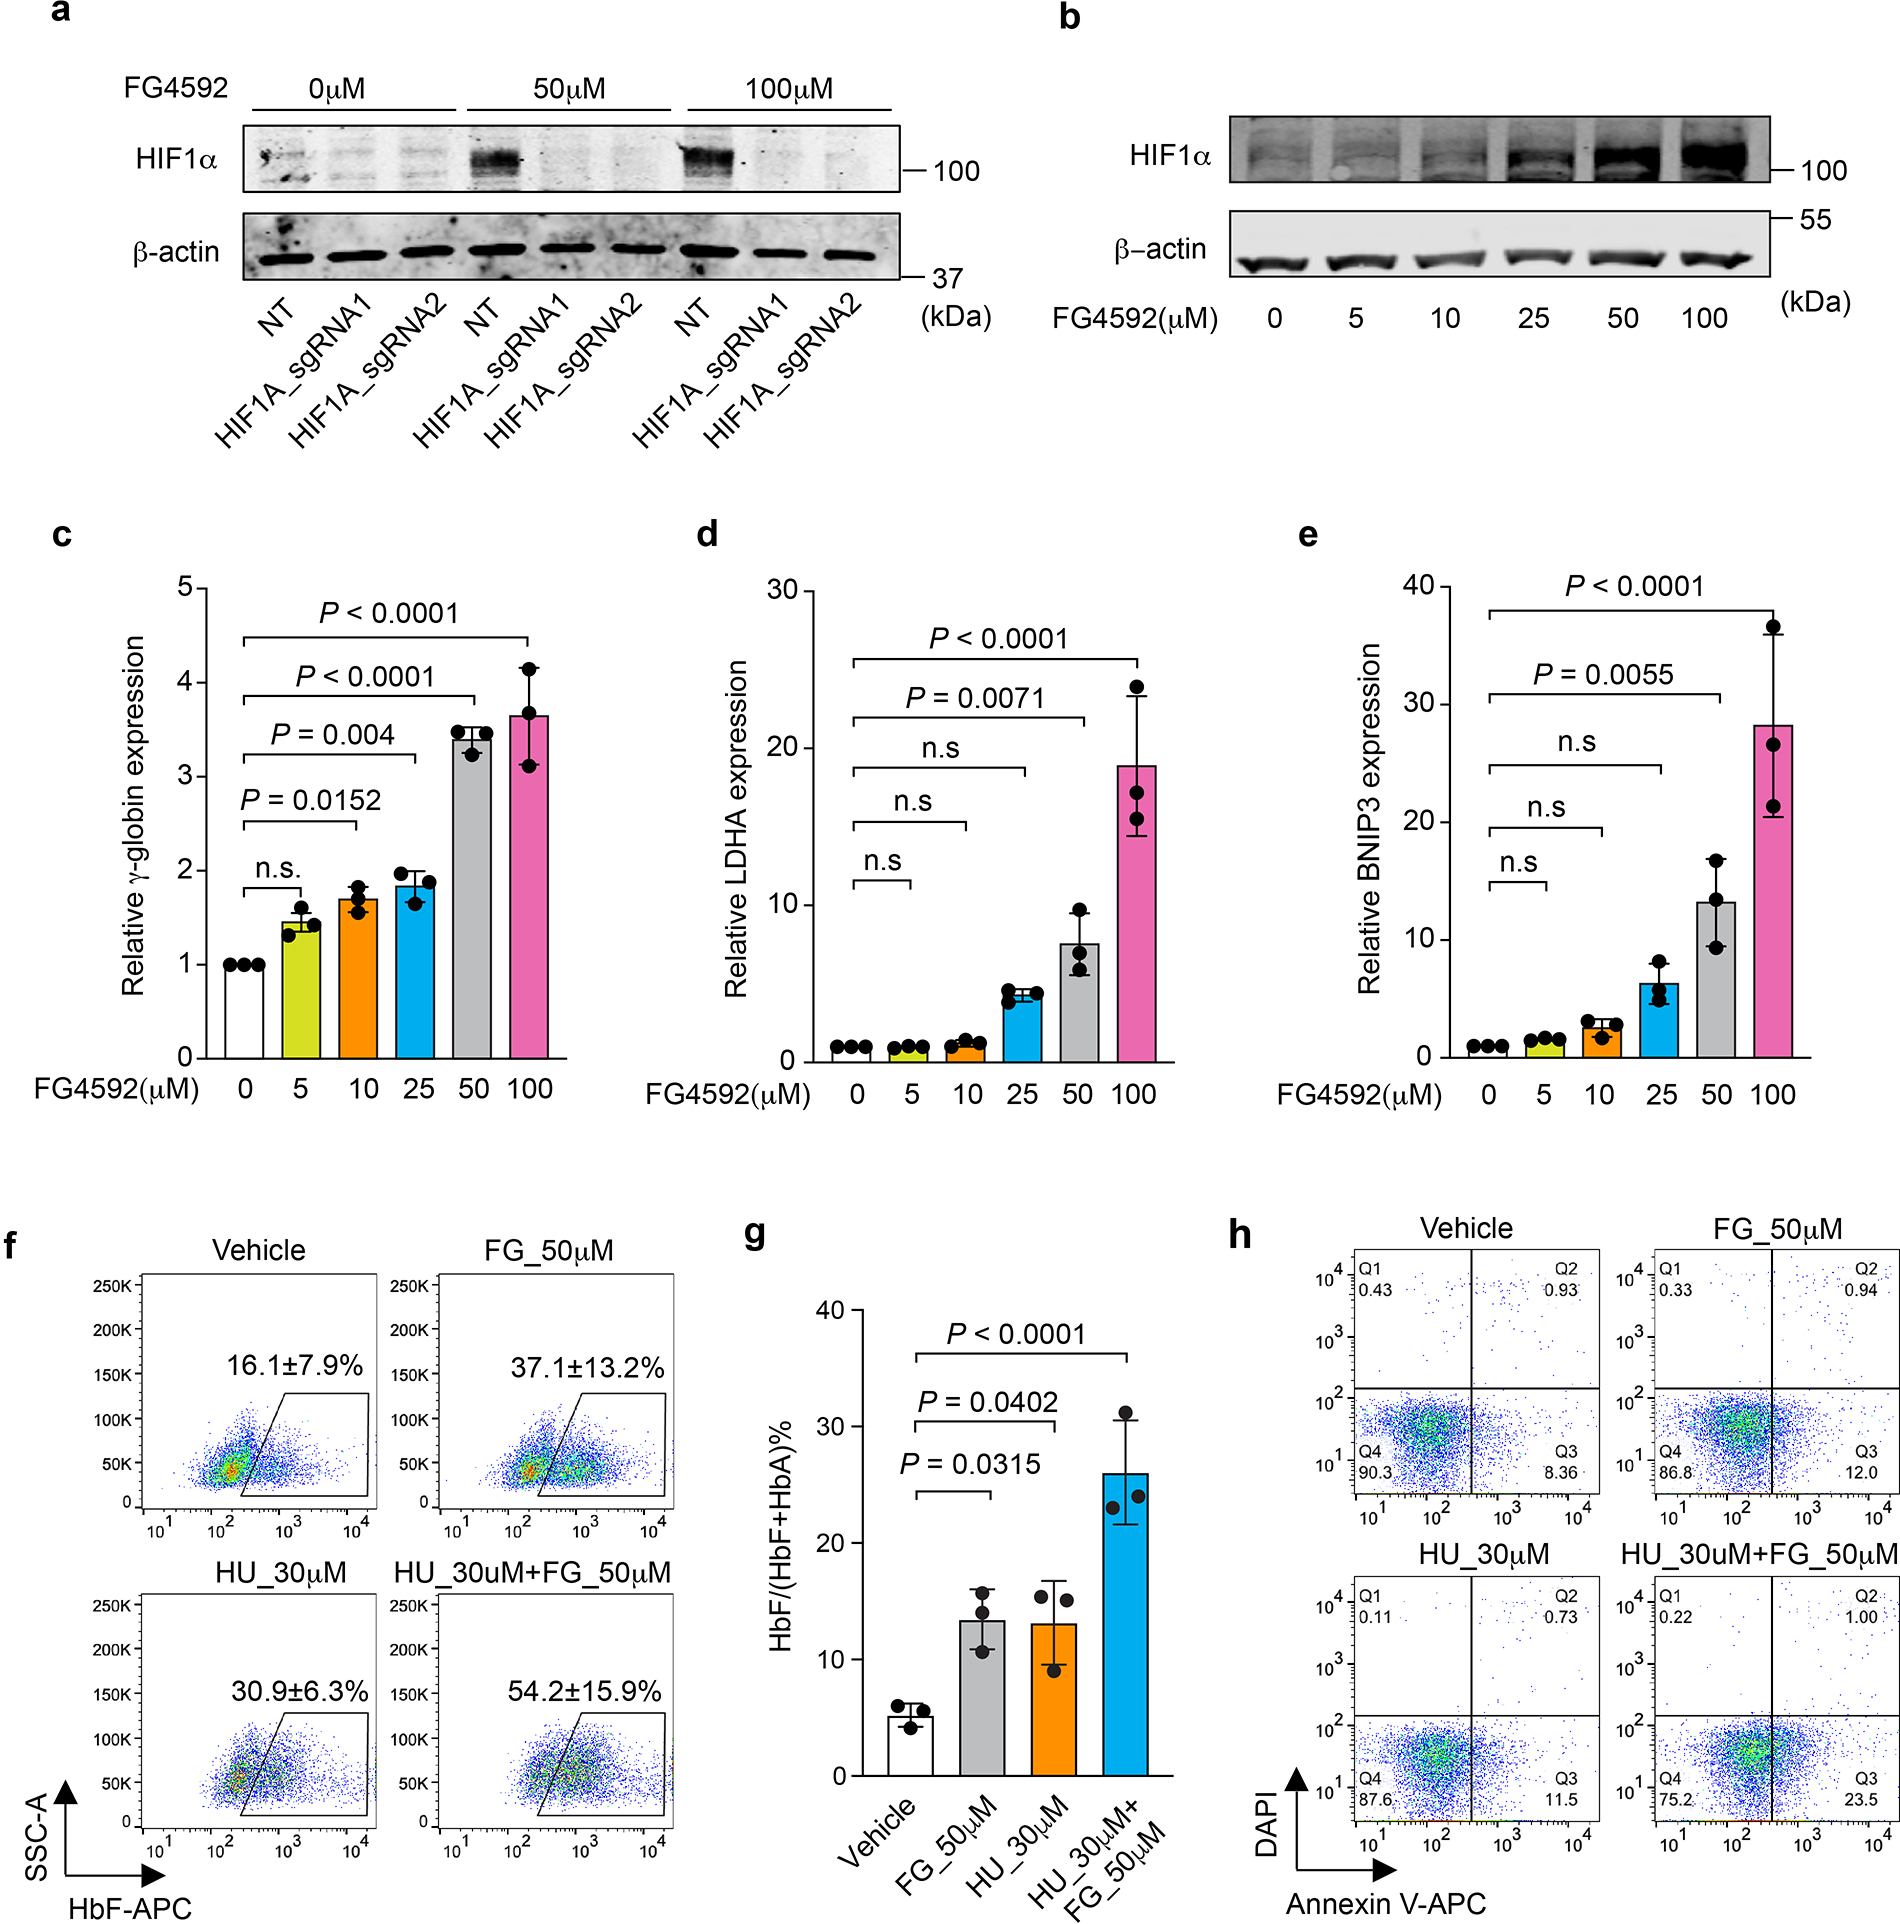
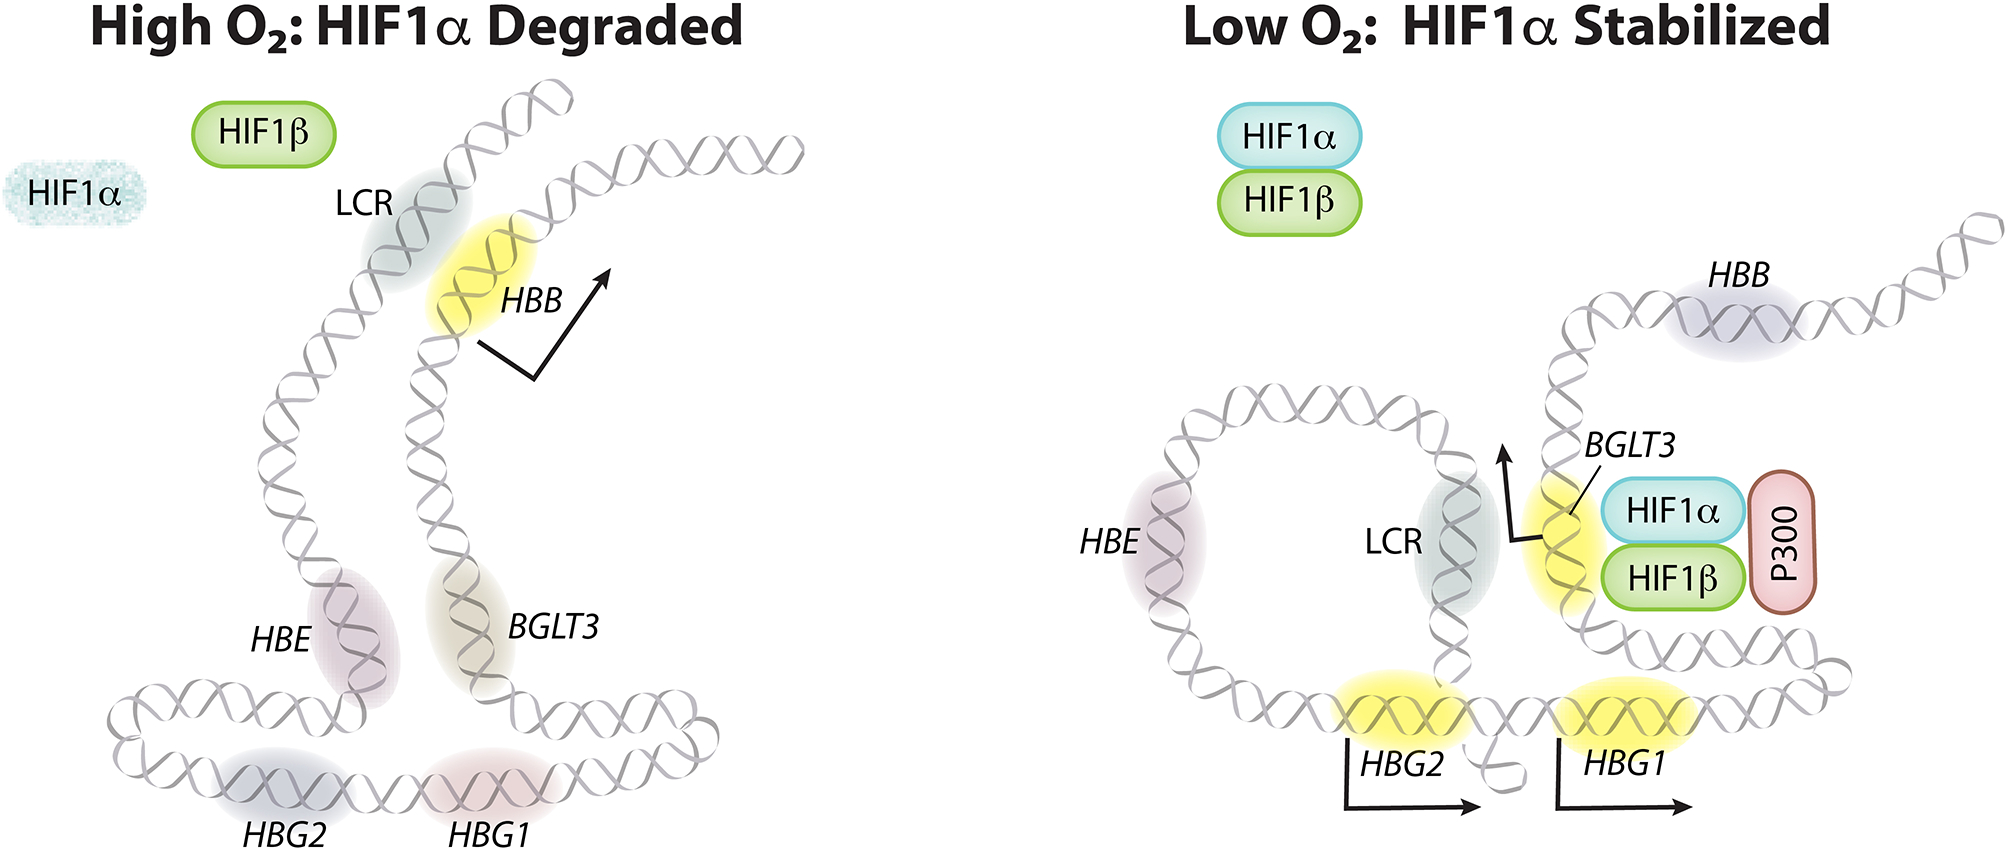
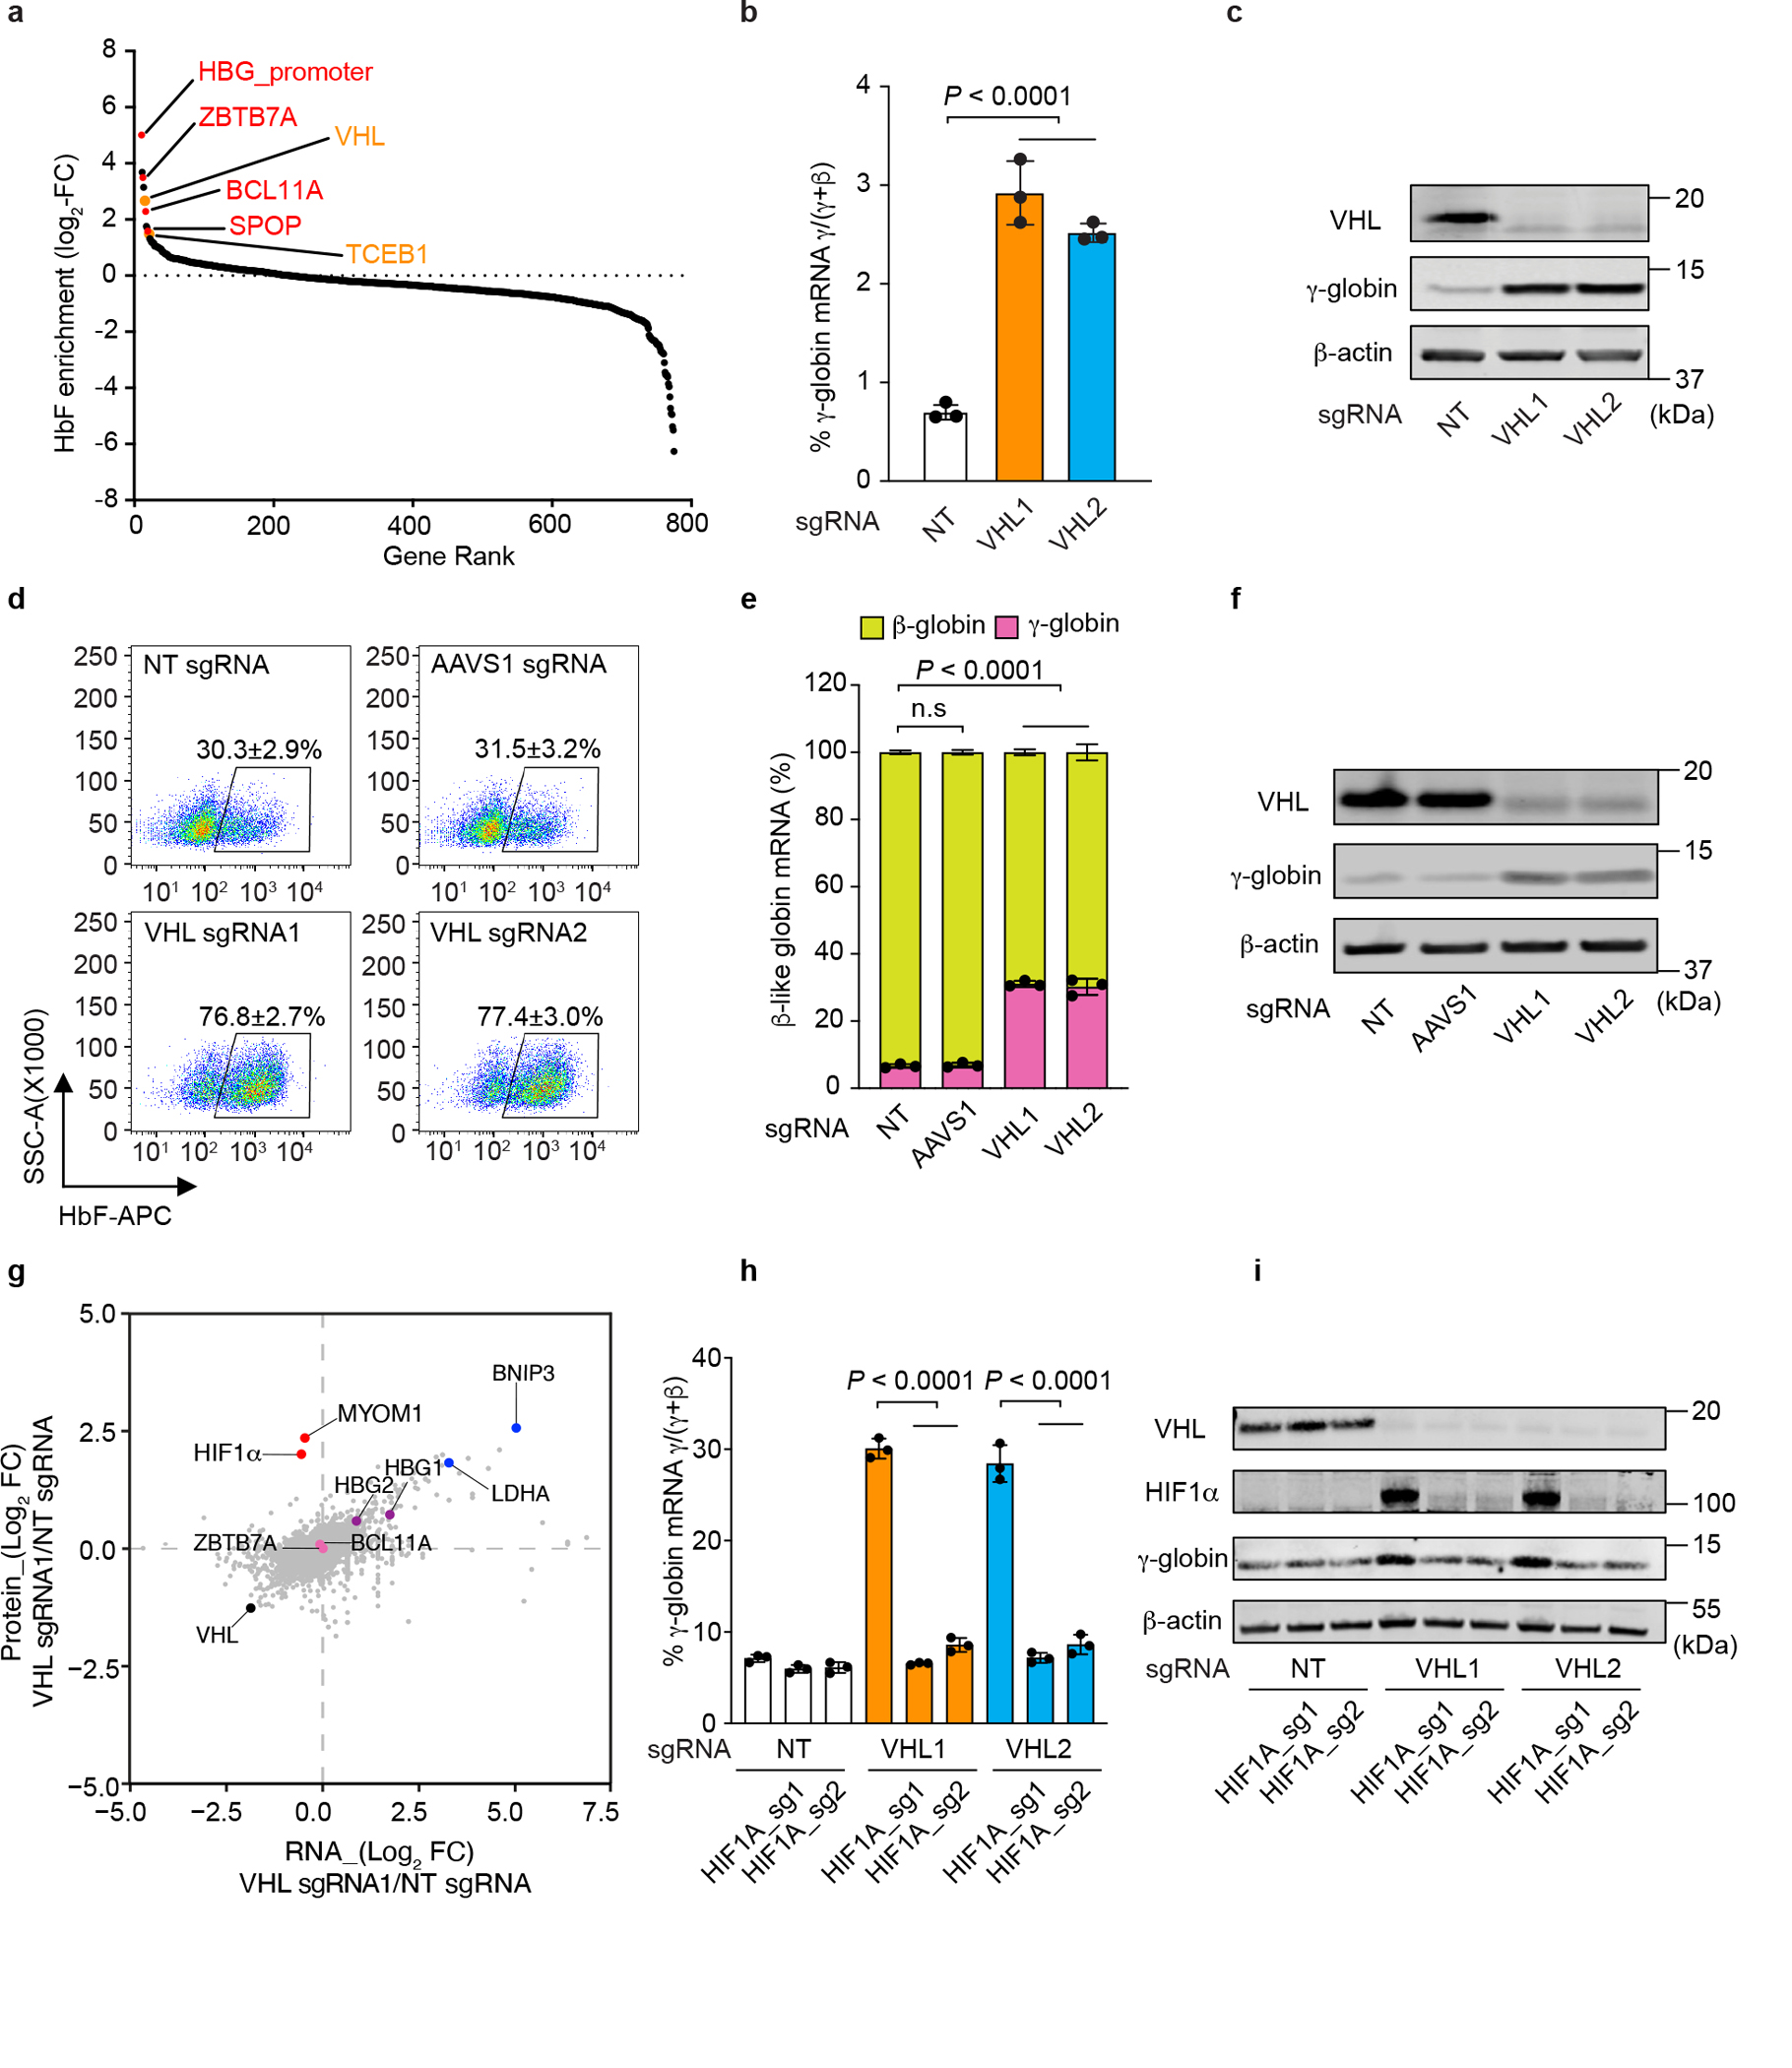
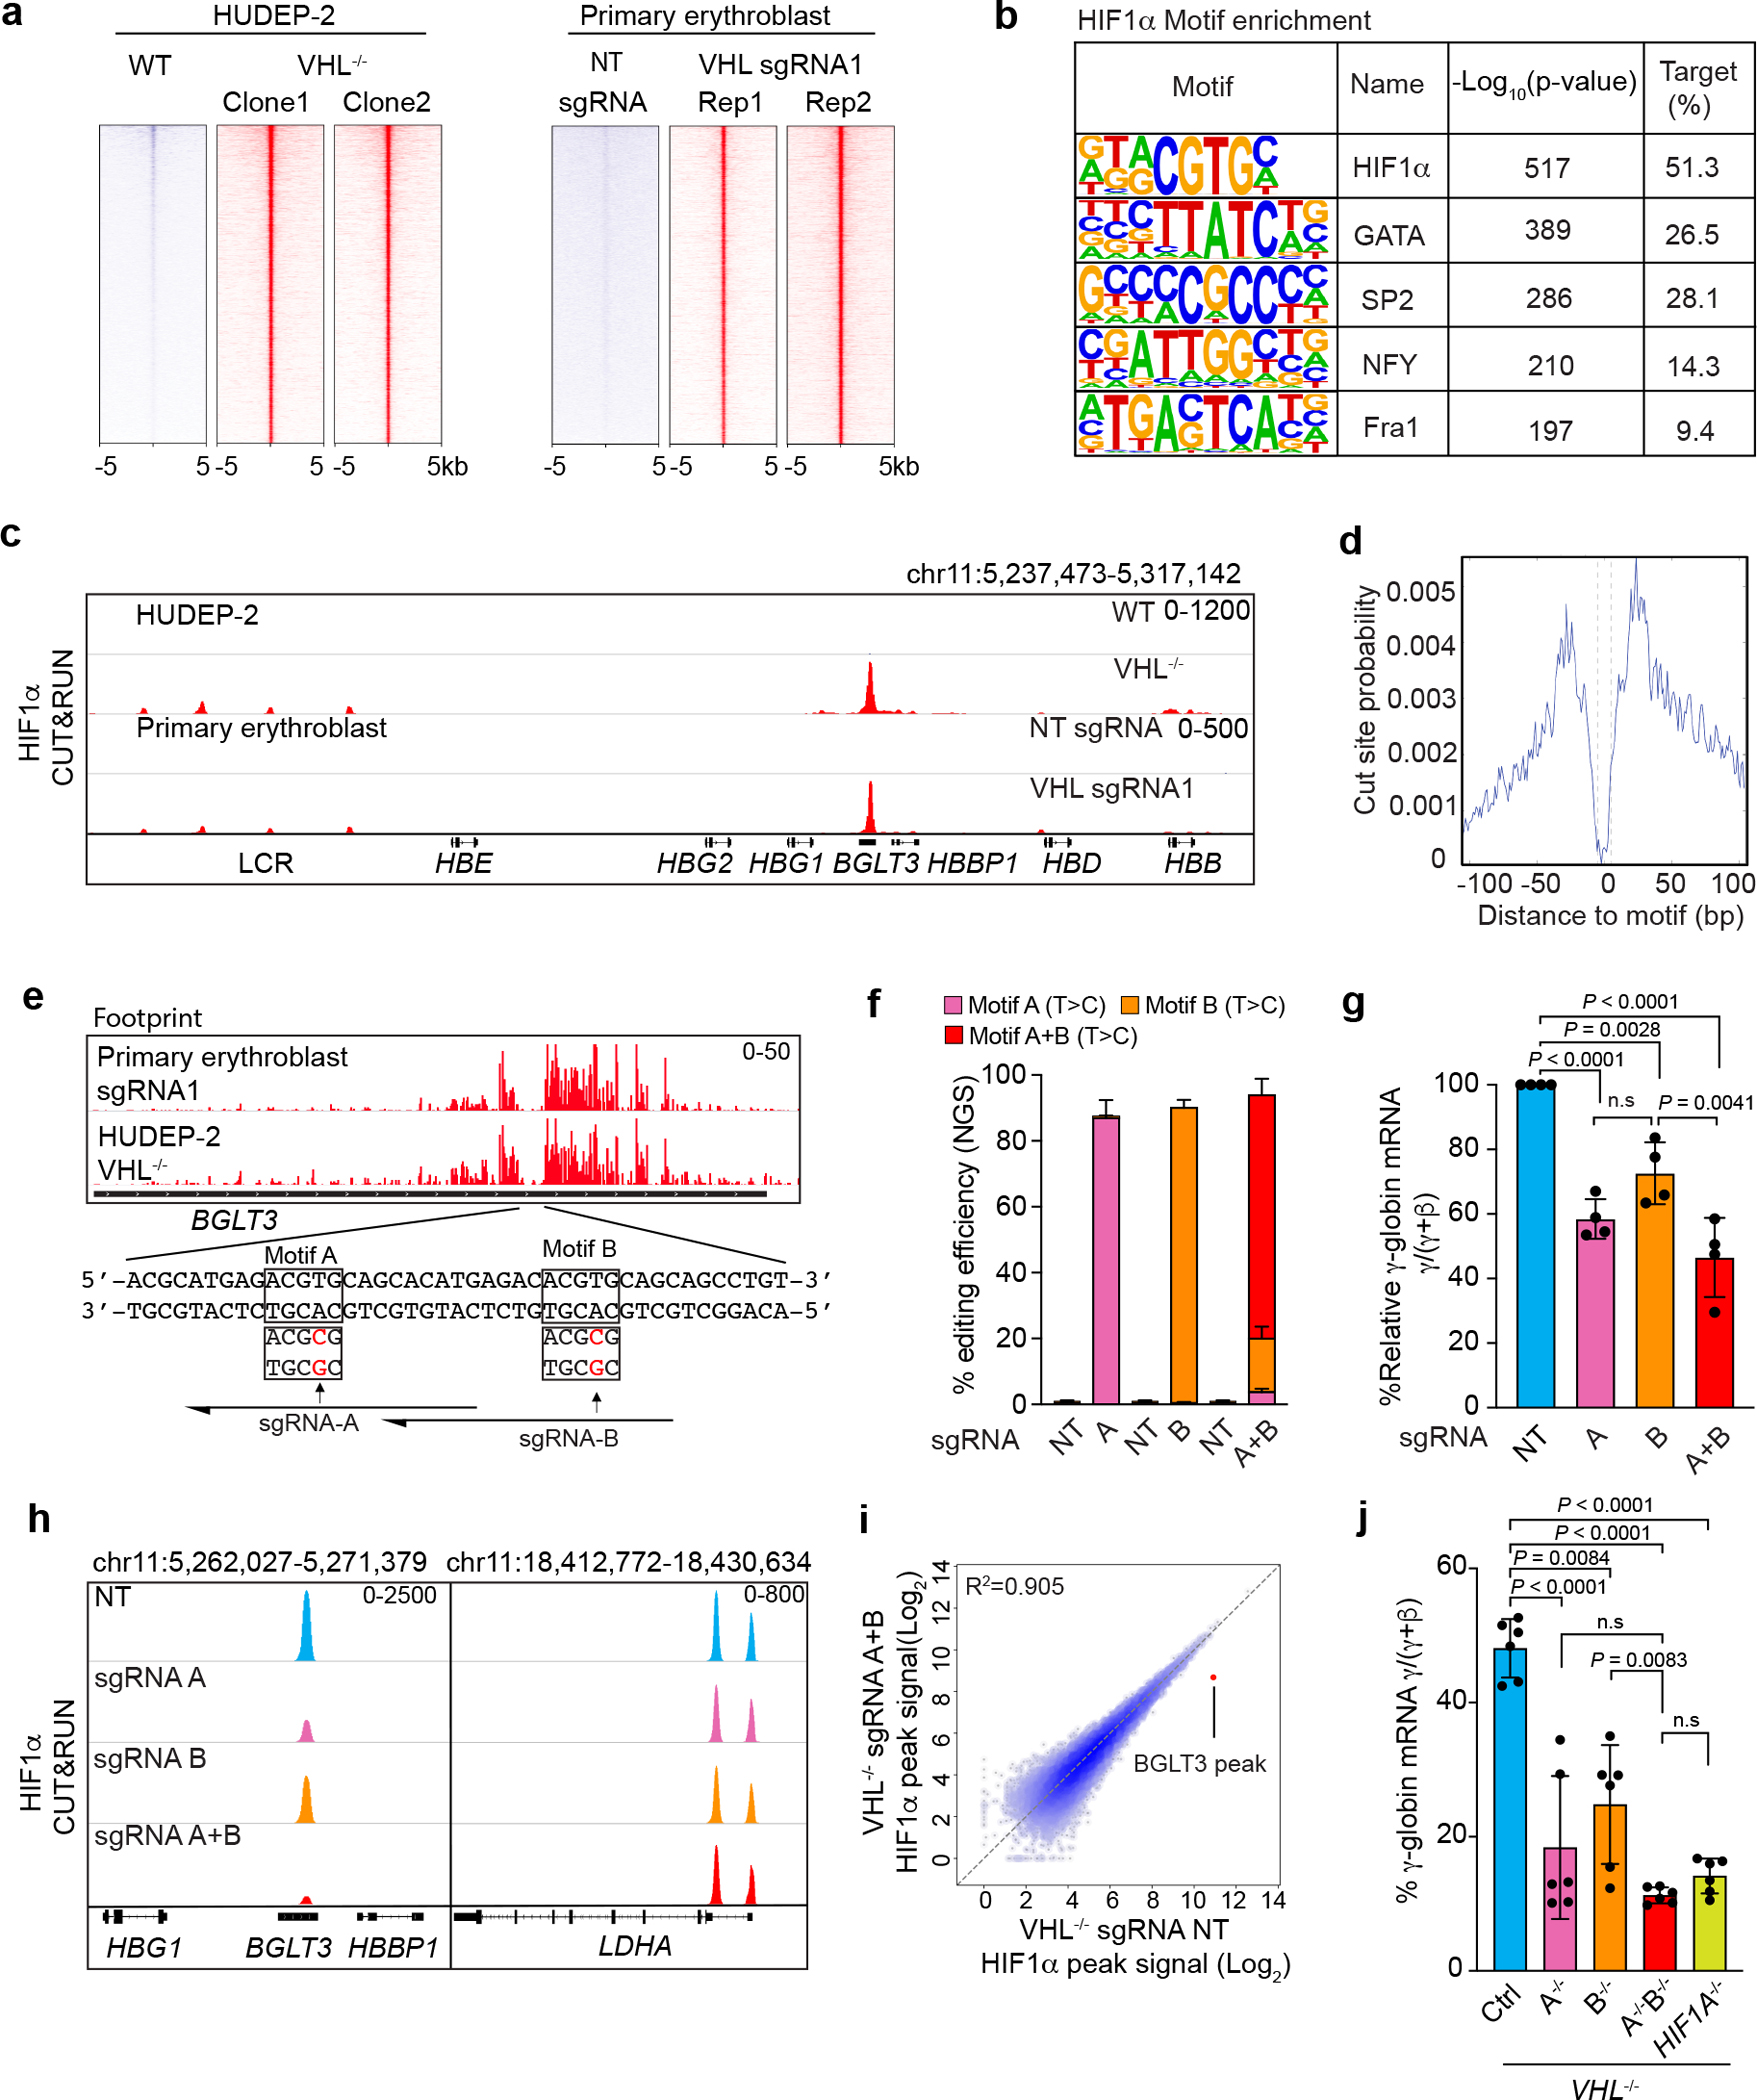
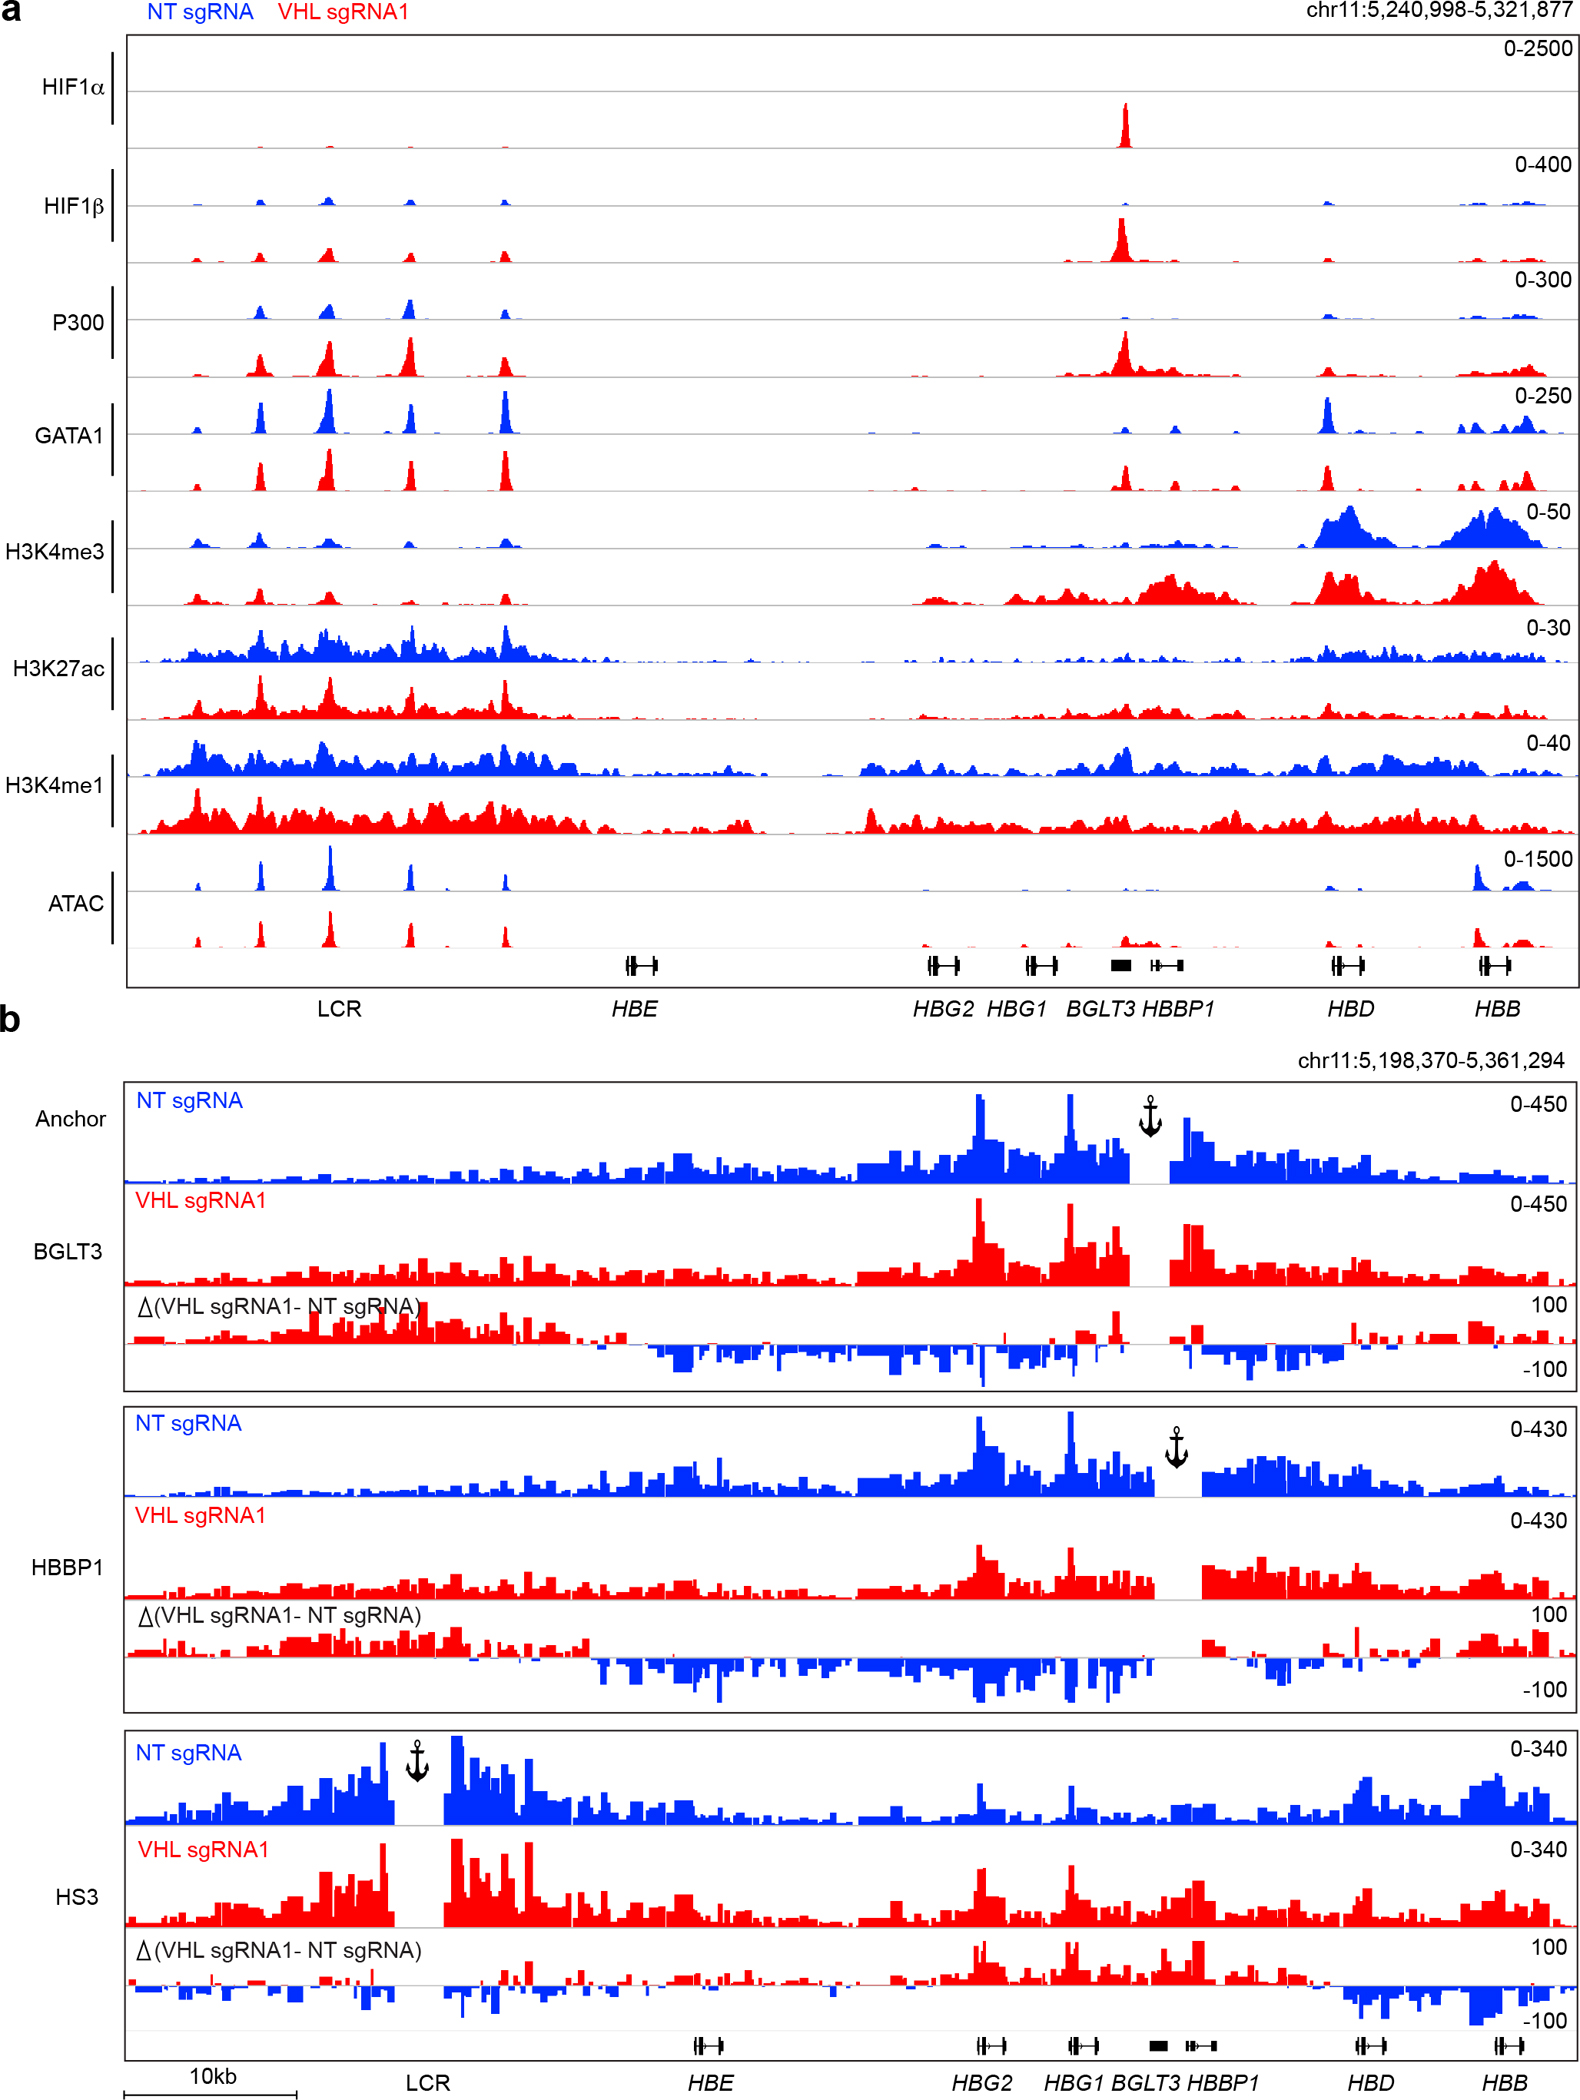
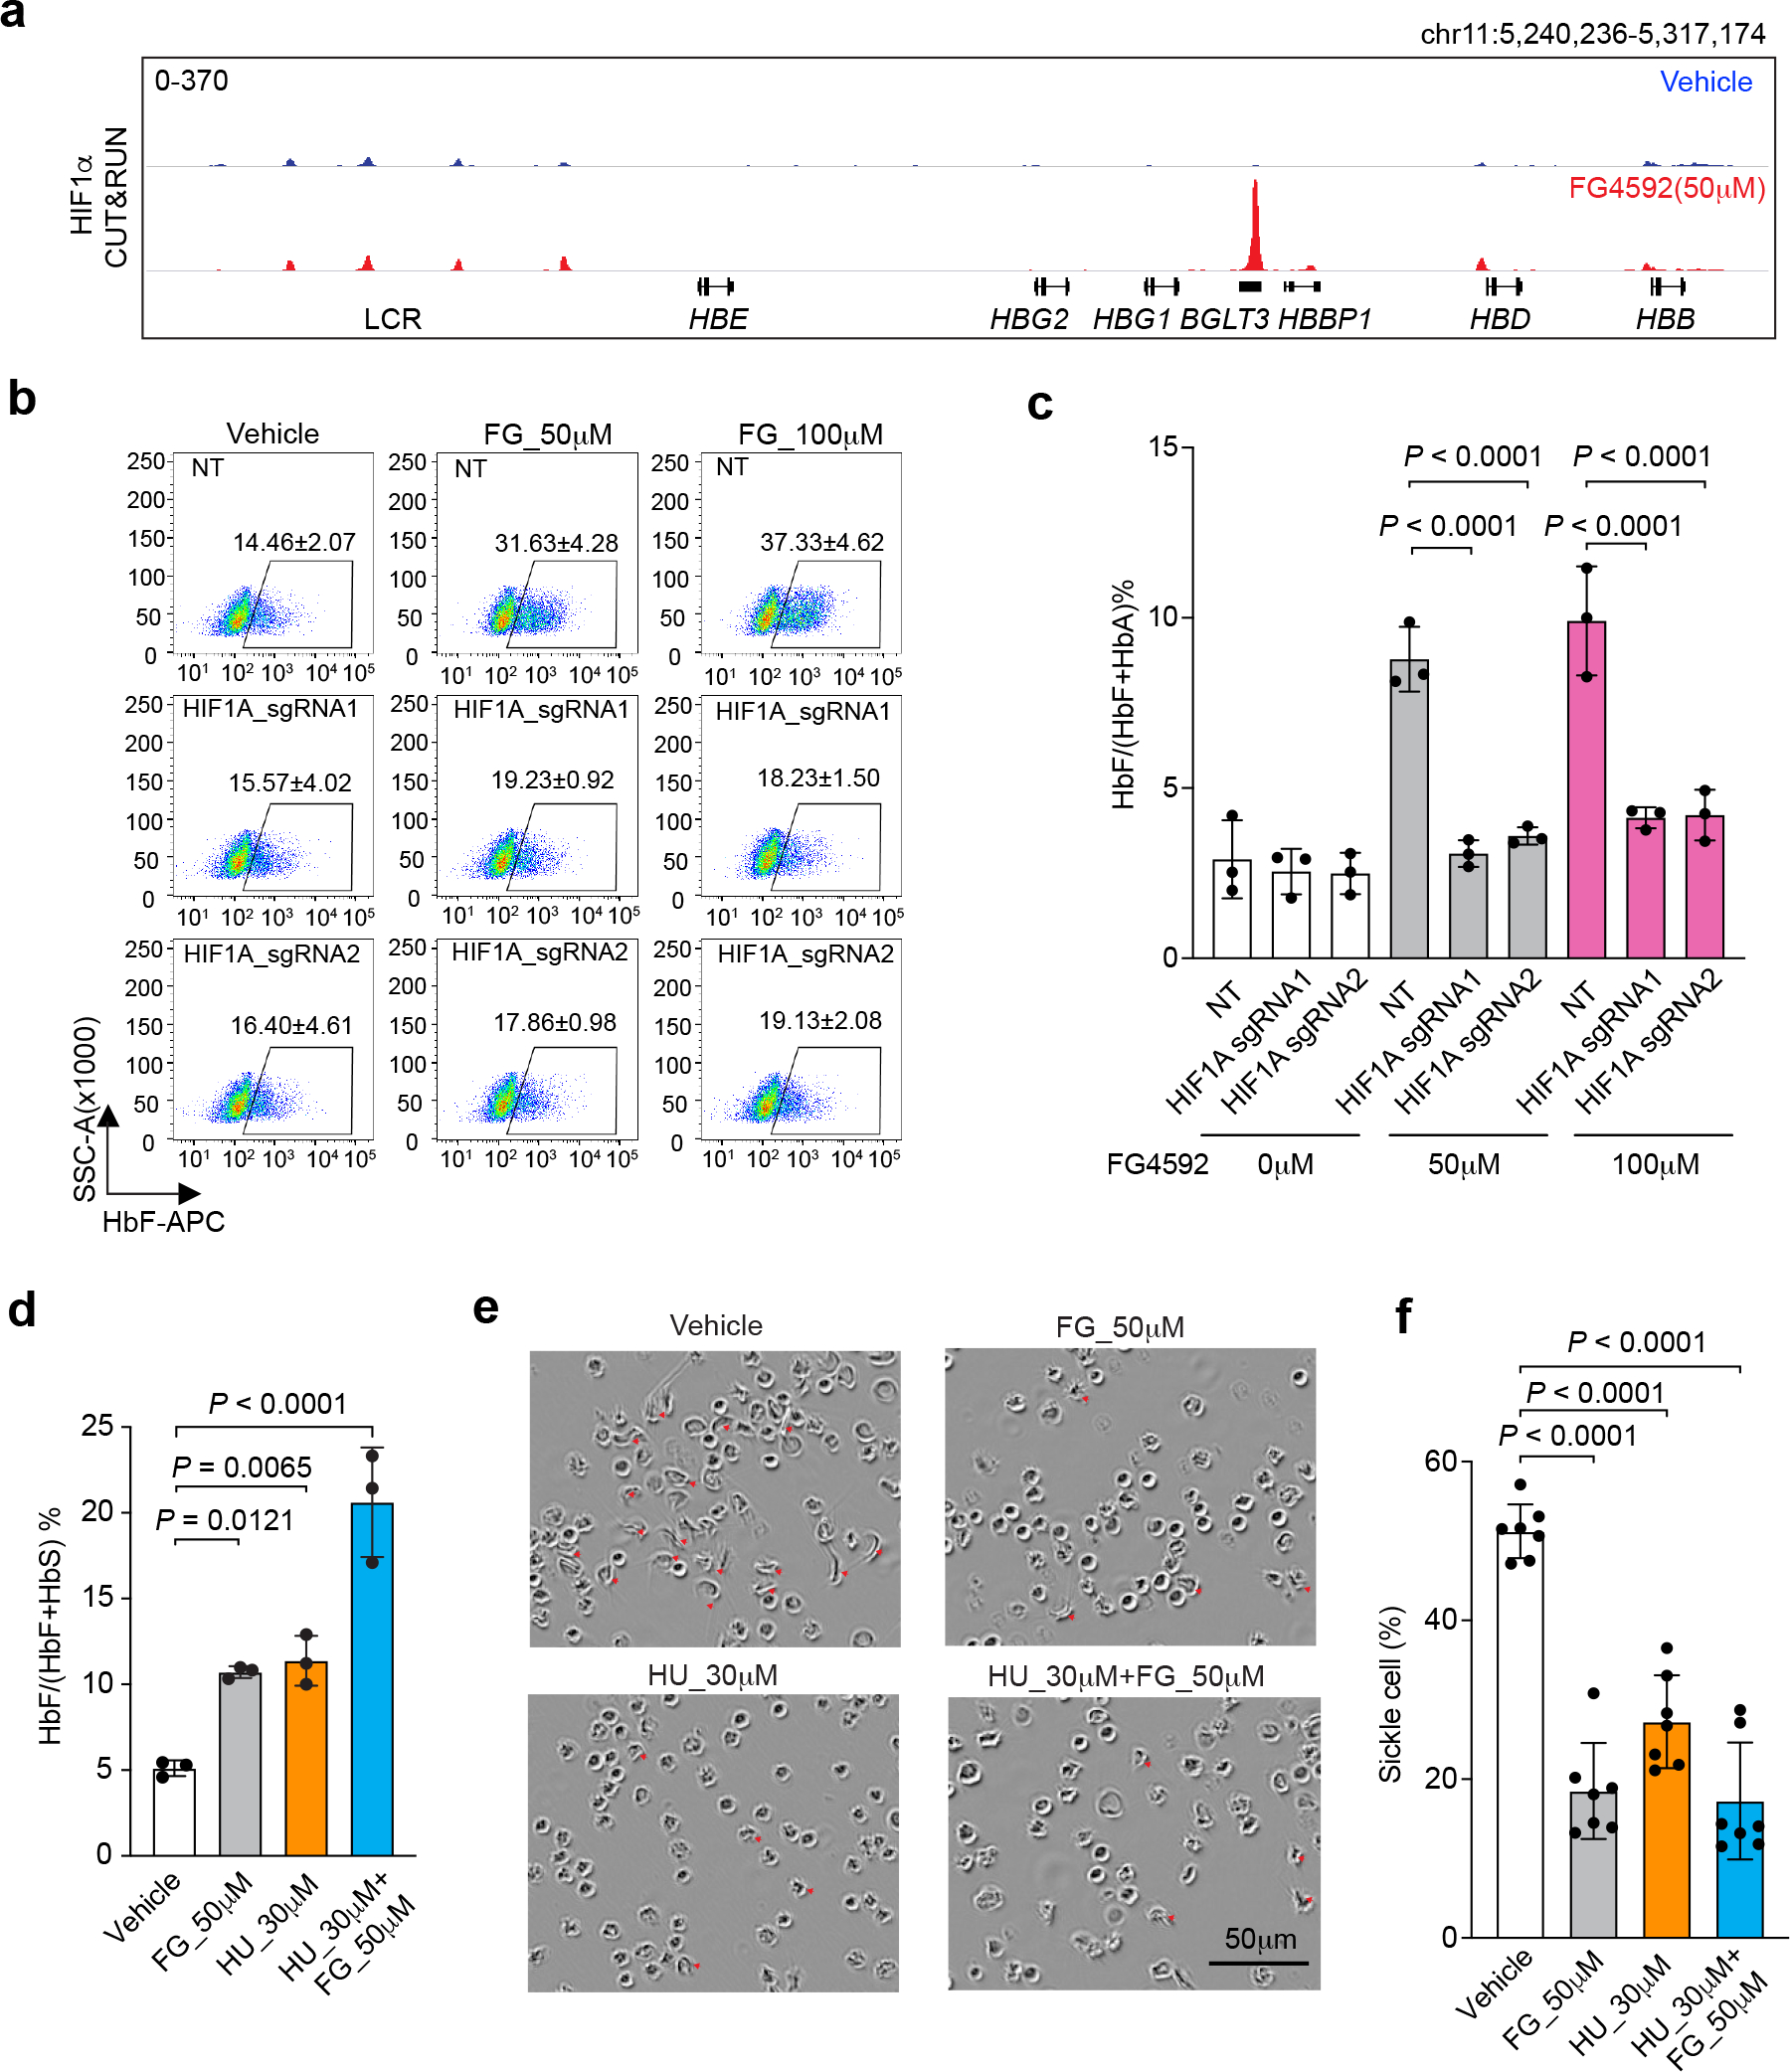
Around birth, globin expression in human red blood cells (RBCs) shifts from γ-globin to β-globin, which results in fetal haemoglobin (HbF, α2γ2) being gradually replaced by adult haemoglobin (HbA, α2β2)1. This process has motivated the development of innovative approaches to treat sickle cell disease and β-thalassaemia by increasing HbF levels in postnatal RBCs2. Here we provide therapeutically relevant insights into globin gene switching obtained through a CRISPR-Cas9 screen for ubiquitin-proteasome components that regulate HbF expression. In RBC precursors, depletion of the von Hippel-Lindau (VHL) E3 ubiquitin ligase stabilized its ubiquitination target, hypoxia-inducible factor 1α (HIF1α)3,4, to induce γ-globin gene transcription. Mechanistically, HIF1α-HIF1β heterodimers bound cognate DNA elements in BGLT3, a long noncoding RNA gene located 2.7 kb downstream of the tandem γ-globin genes HBG1 and HBG2. This was followed by the recruitment of transcriptional activators, chromatin opening and increased long-range interactions between the γ-globin genes and their upstream enhancer. Similar induction of HbF occurred with hypoxia or with inhibition of prolyl hydroxylase domain enzymes that target HIF1α for ubiquitination by the VHL E3 ubiquitin ligase. Our findings link globin gene regulation with canonical hypoxia adaptation, provide a mechanism for HbF induction during stress erythropoiesis and suggest a new therapeutic approach for β-haemoglobinopathies.


Conflict of interest statement

Competing interests

M.J.W. serves on the advisory boards for Cellarity Inc., Novartis, Graphite Bio, Dyne Therapeutics, and Forma Therapeutics, and owns equity in Cellarity, Inc.

Figures

Extended Data Figure 1.
Extended Data Figure 1.. Disruption of the VHL gene induces fetal hemoglobin (HbF)
(linked to main Figure 1). a, Experimental workflow for a CRISPR/Cas9 sgRNA screen to identify regulators of HbF expression. b–g, Normal adult donor CD34+ hematopoietic stem and progenitor cells (HSPCs) were transfected with ribonucleoprotein (RNP) consisting of Cas9 + VHL, AAVS1, or nontargeting (NT) single-guide RNAs (sgRNAs), after which erythroid differentiation was induced (see also main Figure 1d–f). b, The %HbF (α2γ2) and %HbA (α2β2) relative to total hemoglobin, determined by high-performance liquid chromatography (HPLC) at day 15 of erythroid differentiation. c, Results of real-time quantitative PCR (RT-qPCR) analysis, showing relative levels of γ-globin normalized to α-globin mRNA. d, RT-qPCR analysis showing relative levels of β-globin expression normalized to α-globin mRNA. e, Cell expansion as determined by CellTiter 96® Aqueous One, a colorimetric method for estimating the relative numbers of viable cells. f, Representative results of flow cytometry analysis for erythroid maturation markers CD235a, CD49d, and Band3 at day 15 of erythroid differentiation. g, Wright–Giemsa–stained erythroblasts at day 15. Representative pictures are shown here, experiments were repeated independently 3 times with similar results. The bar charts and graphs in panels bd show the mean ± s.d., n = 3 biological independent experiments. Multiplicity-adjusted P-values by ordinary one-way ANOVA with Dunnett’s MCT against NT.
Extended Data Figure 2.
Extended Data Figure 2.. Disruption of TCEB1 or CUL2 induces γ-globin and HbF expression
(linked to main Figure 1). Cas9-expressing HUDEP-2 cells were transduced with lentiviral vectors encoding sgRNAs targeting the genes encoding elongin B (TCEB1, T) or cullin 2 (CUL2, C), after which erythroid differentiation was induced for 5 days. a, The %γ-globin mRNA. The bar charts show the mean ± s.d. from 3 independent experiments. Multiplicity-adjusted P-values by ordinary one-way ANOVA with Dunnett’s MCT against NT. b, Western blot analysis. c, Representative flow cytometry plots showing %F-cells. The mean ± s.d. from 3 independent experiments are shown. d, Gene ontology (GO) analysis of mRNAs that were induced in erythroblasts derived from VHL-disrupted versus control CD34+ HSPCs (false-discovery rated–adjusted P-value < 0.05, log2 fold-change > 1). e, Western blot analysis of day 10 erythroblasts generated from CD34+ HSPCs treated with Cas9 + VHL or NT sgRNAs. f, Relative expression of prolyl hydroxylase domain (PHD) enzyme-encoding mRNAs shown as transcripts per kilobase million (TPM) in day 10 erythroblasts described in panel e. g, Relative expression (in TPM) of GATA1, BCL11A, HIF1A, and HIF2A mRNAs in day 10 erythroblasts described in panel e. h, Western blot analysis of VHL, HIF1a, and HIF2a proteins in day 10 erythroblasts described in panel e and in A549 adenocarcinoma cells treated with Cas9 + VHL or NT sgRNAs. The arrow indicates the HIF2α signal. i, j, Gene set enrichment analysis (GSEA) of mRNAs that are altered in erythroblasts generated from VHL-disrupted (sgRNA1) vs. control (NT sgRNA) CD34+ cells. Fetal-enriched and adult-enriched erythroid gene sets were derived from the work of Huang et al. NES, normalized enrichment score. k, Relative expression (in TPM) of globin mRNAs in day 10 erythroblasts described in panel e. Bar charts show average data value from two biological replicates, dots represent individual values in f, g, k.
Extended Data Figure 3.
Extended Data Figure 3.. The VHL E3 ubiquitin ligase complex suppresses γ-globin expression by targeting HIF1α for degradation
(linked to main Figure 1). a, CD34+ HSPCs were co-transfected with RNPs targeting VHL and HIF1A. %HbF measured by HPLC at day 15. (Data are presented as mean ± s.d., n=3 independent experiments with different donor CD34+ cells). Multiplicity-adjusted P-values by one-way ANOVA with Dunnett’s MCT against control. b–d, VHL−/− HUDEP-2 clones 1 and 2 were electroporated with HIF1A sgRNA1 or sgRNA2, grown in maintenance medium, and analyzed after 5 days. b, Representative flow-cytometry plots showing %F-cells. Experiments were repeated independently 3 times with similar results. c, γ-Globin mRNA levels (left) and %γ-globin mRNA relative to γ-globin + β-globin mRNA (right). Data are presented as mean ± s.d., n=3 independent experiments. Multiplicity-adjusted P-values by one-way ANOVA with Dunnett’s MCT against NT. d, Western blot analysis of the indicated proteins. e, Cas9-expressing VHL−/− HUDEP-2 cell clones 1 and 2 were transduced with lentiviral vectors encoding MYOM1 or NT sgRNAs, grown in maintenance medium for 7 days, then analyzed for F-cells. Indel frequencies for sgRNAs ranged from 62% to 94% (Supplementary Table 4b). MYOM1 protein was not detected in Western blots of control HUDEP-2 cells (not shown). Representative flow-cytometry plots for F-cells are shown. Experiments were repeated independently 3 times with similar results. f, %γ-globin mRNA in the cells in e. Bar charts show the mean ± s.d. from three biological replicates. g–i, CD34+ HSPCs were electroporated with RNP containing VHL sgRNA1 or NT sgRNA, then erythroid differentiation was induced. In parallel, the same untreated CD34+ HSPCs were induced to undergo erythroid differentiation in 1% O2. g, At day 13, mRNAs encoded by HIF target genes EGLN3 and BNIP3 were measured by RT-qPCR and normalized to AHSP (ERAF) mRNA. Globin mRNAs and hemoglobin proteins were measured by RT-PCR and IE-HPLC, respectively. Bar charts show average data value from two biological replicates, dots represent individual values. h, %F-cells in day 15 erythroblasts in g. mean ± s.d. are shown for two biological replicates using CD34+ cells from different donors. i, Western blot analysis of day 10 erythroblasts.
Extended Data Figure 4.
Extended Data Figure 4.. HIF1α binds the BGLT3 gene in the β-like globin gene cluster
(linked to main Figure 2). a, HIF1α CUT&RUN analysis of VHL−/− HUDEP-2 cells (clone 1) and primary erythroblasts generated from VHL-depleted CD34+ cells. The tracks show HIF1α occupancy at its known target genes LDHA and BNIP3. b, The top panels show heatmaps of high-confidence genome-wide CUT&RUN peaks for HIF1α and HIF2α occupancy in primary erythroblasts generated by in vitro differentiation of CD34+ HSPCs that were transfected with RNPs consisting of Cas9 + VHL sgRNA1 or NT sgRNA and in A549 adenocarcinoma cells transfected with the same RNPs. The lower panels show genome-wide targeted-motif footprint analysis of CUT&RUN peaks indicating the cut probability of each base surrounding or within HIF-binding hypoxia response elements (HRE; ACGTG). c, CUT&RUN analysis of HIF1α occupancy at BGLT3 (left panels) or LDHA (right panels) in VHL−/− HUDEP-2 cells (clone 2) with adenine base editor–induced mutations in BGLT3 HRE motifs A and/or B. d, Genome-wide CUT&RUN analysis of HIF1α in bulk VHL−/− HUDEP-2 cells (clone 2) edited with NT sgRNA (x-axis) or sgRNAs targeting BGLT3 motifs A and B (y-axis). Each dot represents an individual high-confidence HIF1α peak. The BGLT3 HIF1α occupancy peak is indicated by the red dot. e, Heat maps showing Pearson correlation coefficients of genome-wide, normalized HIF1α CUT&RUN peak patterns in VHL−/− HUDEP-2 cell clones 1 (left) and 2 (right) ± mutations in BGLT3 HIF-binding motifs A and/or B, as described in main Figure 2h and I, and in panels c and d of this figure.
Extended Data Figure 5.
Extended Data Figure 5.. Sequence alignment of BGLT3 HIF-binding HRE motifs in the β-like globin gene cluster of humans and non-human primates (linked to main Figure 2).
a, A sequence from the human BGLT3 gene containing two HIF-binding motifs was used as a BLASTN query against primate genome assemblies from ENSEMBL (https://www.ensembl.org). Identities are shown as dots and gaps as dashes; mismatched bases are indicated. The yellow highlighted columns indicate HIF-binding HRE motifs A and B. Species are color coded as follows: apes in black; Old World monkeys in red; New World monkeys in blue; and non-simian primates in green. b, Rhesus macaque genotype combinations determined from the rhesus macaque mGap database (https://mgap.ohsu.edu/). A total of 1158 animals with complete base calls were included. c, Baboon genotype counts (n = 40) determined from the Baboon Genome Project (https://www.hgsc.bcm.edu/non-human-primates/baboon-genome-project). d, Rare variants in human BGLT3 HRE motif A identified in the gnomAD database (https://gnomad.broadinstitute.org/).
Extended Data Figure 6.
Extended Data Figure 6.. HIF1-induced transcription factor recruitment and epigenetic changes at BGLT3
(linked to main Figure 3). a, Normal adult donor CD34+ cells were transfected with RNPs containing Cas9 + VHL-targeting sgRNA2 or NT sgRNA, maintained in culture with erythroid cytokines, and analyzed after 11 days. The Genome Browser screenshot shows transcription factor occupancy and histone modifications determined by CUT&RUN analysis and open chromatin regions identified by ATAC-seq. b, Zoom-in on ATAC-seq and CUT&RUN analyses of the LCR in VHL-disrupted erythroblasts generated from CD34+ cells. Data show the average signals from two biological replicate experiments performed using VHL sgRNA1 (main Figure 3a) or sgRNA2 (panel a of this figure). Note that the scale of the low-magnitude HIF1α peaks are expanded relative to that in panel a. Arrows and dashed lines indicate the positions of forward and reverse HRE motifs in the region. c, CD34+ HSPCs were co-transfected with RNPs targeting VHL and HIF1A, after which erythroid differentiation was induced. The bar chart shows BGLT3 mRNA expression normalized to α-globin mRNA as determined by RT-qPCR analysis at 13 days. Data are presented as mean ± s.d., n=3 independent experiments with different donor CD34+ cells. Multiplicity-adjusted P-values by ordinary one-way ANOVA with Šídák’s MCT between selected groups. d, CUT&RUN and ATAC-seq analysis of WT HUDEP-2 cells and VHL−/− clones 1 and 2.
Extended Data Figure 7.
Extended Data Figure 7.. Capture C and CUT&RUN analysis of VHL-disrupted erythroblasts
(linked to main Figure 3). Normal adult donor CD34+ cells were transfected with RNP containing Cas9 + VHL sgRNAs or NT sgRNA, after which erythroid differentiation was induced. a, CUT&RUN and ATAC-seq analysis of the extended α-like globin locus in day 11 erythroblasts. Biological replicate experiments were performed using VHL sgRNAs 1 and 2. A weak VHL-independent HIF1β signal with no underlying HRE motif is present in NPRL3, which harbors a multicomponent α-globin enhancer. Most likely, this signal represents nonspecific micrococcal nuclease digestion associated with open chromatin. b, Analysis of the ZBTB7A locus, as described for panel a. The low-magnitude VHL-independent HIF1β signal with no underlying HRE motif in the promoter region most likely represents nonspecific micrococcal nuclease digestion associated with open chromatin. c, Capture-C analysis to identify chromatin looping, performed at day 11 of erythroid differentiation. Tracks show data from two biological replicate experiments using CD34+ HSPCs from different donors. Anchors are indicated at the BGLT3, HBBP1, and HS3 regions. Main Figure 3b shows combined data from these experiments. d, CUT&RUN analysis and Capture C analysis of the BCL11A locus with an anchor at the promoter. The intron 2 erythroid-specific enhancer is indicated with an asterisk.
Extended Data Figure 8.
Extended Data Figure 8.. The proline hydroxylase inhibitor (PHI) FG4592 induces γ-globin and HbF in primary erythroblasts (linked to main Figure 4).
Normal adult donor CD34+ HSPCs were transfected with Cas9 RNP targeting HIF1A with two different sgRNAs or nontargeting (NT) sgRNA, after which erythroid differentiation was induced. FG4592 was added on culture day 5. a, Results of Western blot analysis performed on culture day 10, showing the effects of drug and HIF1A RNP on HIF1α protein expression. b, Results of Western blot analysis performed on day 10 showing HIF1α induction with increasing doses of FG4592. c–e, Relative expression of the HIF1α targets γ-globin, LDHA, and BNIP3 as measured by RT-qPCR and normalized to AHSP mRNA at different doses of FG4592. (Data are presented as mean ± s.d., n=3 independent experiments with different donor CD34+ cells). Multiplicity adjusted P-values by ordinary one-way ANOVA with Dunnett’s MCT against 0 μM. f, CD34+ cells from healthy adult donors were induced to undergo erythroid differentiation. FG4592 and/or hydroxyurea (HU) were added at culture day 5. The %F-cells was determined at day 15. The mean ± s.d. from three biological replicate experiments using CD34+ cells from different normal donors are shown. g, %HbF in cells described for panel f, determined at day 15 of differentiation. Data are presented as mean ± s.d., n=3 independent experiments with different donor CD34+ cells). Multiplicity adjusted P-values were determined by ordinary one-way ANOVA with Dunnett’s MCT against vehicle. h, Peripheral blood mononuclear cells from a donor with SCD were induced to undergo erythroid differentiation, and the indicated drugs were added at day 5. Annexin V staining for apoptosis was performed on day 15. Representative results are shown here, experiments were repeated independently 3 times with similar results.
Extended Data Figure 9.
Extended Data Figure 9.. Model of the activation of γ-globin transcription by HIF1α in adult-type erythroid cells.
At high oxygen levels, HIF1α is hydroxylated by proline hydroxylase domain (PHD) enzymes and targeted for degradation by the VHL E3 ubiquitin ligase complex (not shown). The transcriptionally silent BGLT3, HBE, and γ-globin (HBG1 and HBG2) genes interact via chromatin looping, whereas the upstream LCR enhancer interacts with the active adult β-globin gene (HBB) to drive its transcription. At low oxygen levels, PHD enzymes are inactive and HIF1α accumulates and heterodimerizes with HIF1β. The HIF heterodimers bind two tandem HRE elements in BGLT3, leading to the recruitment of the transcriptional activators P300 and GATA1 (not shown), the acquisition of local enhancer functions, and the induction of the BGLT3 long noncoding RNA transcript (not shown). Activated BGLT3 unlocks the interaction with HBE, redirects the LCR to the γ-globin genes, and activates their transcription. The solid arrows indicate mRNA transcription. Yellow indicates transcriptionally active genes.
Fig. 1.
Fig. 1.. VHL regulates γ-globin expression.
a, The results of a CRISPR/Cas9 screen showing sgRNAs that are enriched in HUDEP-2 cells expressing high levels of HbF (see Methods for details). The y-axis shows log2 fold-change (FC) in sgRNAs. Dots represent average for four sgRNAs targeting the same gene. BCL11A, ZBTB7A, SPOP or a BCL11A repressor binding element in the γ-globin promoter (HBG_promoter) (red) and VHL, TCEB1(orange) are highlighted. b, Cas9-expressing HUDEP-2 cells were transduced with vectors encoding sgRNAs targeting VHL or with non-targeting (NT) sgRNA. The chart shows %γ-globin mRNA measured by RT-qPCR on day 5 (d5) of erythroid maturation (mean ± s.d., n = 3 independent experiments). c, Western blot of cells in b. d, CD34+ HSPCs were transfected with ribonucleoproteins (RNPs) consisting of Cas9 + VHL sgRNAs or control sgRNAs (NT or AAVS1) and induced to undergo erythroid differentiation. Flow-cytometry plots show %HbF-immunostaining “F-cells” at d15 (mean ± s.d., n = 3). e, %γ- and β-globin mRNAs in d13 erythroblasts (mean ± s.d., n = 3). f, Western blot of d13 erythroblasts from d. g, Erythroblasts generated from CD34+ HSPCs transfected with NT or VHL-targeting RNP were analyzed by quantitative proteomics and RNA-seq. Graph shows log2 FCs in protein (y-axis) and mRNA (x-axis). Dots represent single genes. Pink dots: BCL11A or ZBTB7A; red dots: potential VHL substrates with log2 FCs in protein ≥ 2 and minimal change in corresponding mRNAs. BNIP3 and LDHA are HIF targets. h, CD34+ HSPCs were co-transfected with RNPs targeting VHL and HIF1A, followed by induced erythroid differentiation. Graph shows %γ-globin RNA at d13 (mean ± s.d., n = 3). i, Western blot of cells in h. Multiplicity-adjusted P-values by one-way ANOVA with Dunnett’s multiple comparison test (MCT) against NT for b, e; and by Šídák’s MCT for h. n=3 independent experiments with different donor CD34+ cells for d, e, h.
Fig. 2.
Fig. 2.. HIF1α binds to the BGLT3 locus.
a, Heatmaps showing high-confidence CUT&RUN peaks for HIF1α occupancy in VHL−/− HUDEP-2 cells and primary erythroblasts generated by differentiation of CD34+ HSPCs transfected with Cas9 + VHL sgRNA RNP. b, DNA-motif enrichment analysis within HIF1α CUT&RUN peaks. Homer motif P-value (unadjusted) is based on a hypergeometricic distribution. c, HIF1α CUT&RUN analysis of the β-like globin gene cluster, showing BGLT3 occupancy. d, Genome-wide targeted-motif footprint analysis of HIF1α CUT&RUN data, showing cut probabilities of bases at HIF-binding hypoxia-response elements (HRE). e, CUT&RUN footprint analysis of HIF1α peaks at BGLT3. Consensus HRE motifs are boxed. f–i, VHL−/− HUDEP-2 cells (clones 1–4) were transduced with lentiviral vectors encoding ABE8-NG and sgRNAs targeting HRE motifs A or/and B, or nontargeting (NT) sgRNA and analyzed after 7 days. f, Editing efficiencies determined by NGS (mean ± s.d., n = 4 individual clones). g, Effects of BGLT3 HRE motif disruption on γ-globin expression (relative %γ-globin mRNA, normalized to NT sgRNA for each of four VHL−/− clones) (mean ± s.d., n = 4 individual clones). h, CUT&RUN analysis of HIF1α occupancy at BGLT3 (left) or the HIF target LDHA (right) in bulk base-edited cells derived from VHL−/− HUDEP-2 (clone 1). i, Genome-wide CUT&RUN analysis of HIF1α in bulk VHL−/− HUDEP-2 cells (clone 1) edited with NT sgRNA (x-axis) or sgRNAs targeting BGLT3 motifs A and B (y-axis). Dots represent high-confidence HIF1α peaks; red dot indicates the BGLT3 HIF1α occupancy peak. j, VHL−/− HUDEP-2 cells (clone 2) were treated with ABE8NG to disrupt HRE motifs A and/or B; or with Cas9 to disrupt HIF1A. Six clones of each indicated genotype were analyzed for %γ-globin mRNA (mean ± s.d.). Multiplicity-adjusted P-values between genotypes by one-way ANOVA with Tukey’s MCT in g, j.
Fig. 3.
Fig. 3.. HIF1α-induced transcription factor binding and epigenetic changes at the β-like globin gene cluster in primary erythroblasts.
Normal adult donor CD34+ cells were transfected with RNP containing Cas9 + VHL-targeting sgRNA1 or nontargeting (NT) sgRNA, maintained in culture with erythroid cytokines, and analyzed after 11 days. a, Genome Browser screenshot showing transcription factor occupancy and histone modifications determined by CUT&RUN analysis and open chromatin regions identified by ATAC-seq. b, Capture-C analysis to identify chromatin looping, performed at day 11 of erythroid differentiation. Data are shown as combined reads from two biological replicate experiments using CD34+ HSPCs from different donors (see also Extended Data Fig. 7b). Anchors are indicated at the BGLT3, HBBP1, and Locus Control Region (LCR) HS3 regions.
Fig. 4.
Fig. 4.. The proline hydroxylase inhibitor FG4592 induces γ-globin and HbF in primary erythroblasts.
a–d, Normal adult donor CD34+ HSPCs were edited with RNP consisting of Cas9 + HIF1A sgRNA or nontargeting (NT) sgRNA, after which erythroid differentiation was induced. FG4592 and/or hydroxyurea (HU) were added on culture day 5, and cells were analyzed at day 15. a, HIF1α occupancy at BGLT3, determined by CUT&RUN analysis of erythroblasts after treatment with FG4592 (50 μM) or vehicle. b, Representative flow-cytometry data showing F-cells. The mean ± s.d. from three biological replicate experiments using CD34+ cells from different healthy donors are shown. c, %HbF expression on day 15 (mean ± s.d., n = 3 independent experiments using different donor CD34+ cells). Multiplicity-adjusted P-values obtained by ordinary one-way ANOVA with Šídák’s MCT between selected groups are shown. d–f, Erythroid differentiation was induced in peripheral blood mononuclear cells (PBMCs) from donors with sickle cell disease. Drugs were added on day 5. d, %HbF determined at day 15 (mean ± s.d., n = 3 independent experiments using different SCD donor PBMCs). e, On day 19 of differentiation, reticulocytes were isolated by flow cytometry then incubated in 2% O2 for 12 h. Representative images show sickled red blood cells. f, Quantification of sickled cells in e (mean ± s.d., n = 7 cells field counts examined over 4 independent experiments). Multiplicity-adjusted P-values were determined by ordinary one-way ANOVA with Dunnett’s MCT against vehicle in d, f.

Comment in

Similar articles

Cited by

References

Main Text References

    1. Vinjamur DS, Bauer DE & Orkin SH Recent progress in understanding and manipulating haemoglobin switching for the haemoglobinopathies. Br J Haematol 180, 630–643 (2018). - PubMed
    1. Doerfler PA, et al. Genetic therapies for the first molecular disease. J Clin Invest 131, e146394 (2021). - PMC - PubMed
    1. Kaelin WG Jr. & Ratcliffe PJ Oxygen sensing by metazoans: the central role of the HIF hydroxylase pathway. Mol Cell 30, 393–402 (2008). - PubMed
    1. Semenza GL Hypoxia-inducible factor 1 (HIF-1) pathway. Sci STKE 2007, cm8 (2007). - PubMed
    1. Kato GJ, et al. Sickle cell disease. Nat Rev Dis Primers 4, 18010 (2018). - PubMed

References for Methods

    1. Sanjana NE, Shalem O & Zhang F Improved vectors and genome-wide libraries for CRISPR screening. Nat Methods 11, 783–784 (2014). - PMC - PubMed
    1. Li W, et al. MAGeCK enables robust identification of essential genes from genome-scale CRISPR/Cas9 knockout screens. Genome Biol 15, 554 (2014). - PMC - PubMed
    1. Connelly JP & Pruett-Miller SM CRIS.py: A Versatile and High-throughput Analysis Program for CRISPR-based Genome Editing. Sci Rep 9, 4194 (2019). - PMC - PubMed
    1. Brinkman EK, Chen T, Amendola M & van Steensel B Easy quantitative assessment of genome editing by sequence trace decomposition. Nucleic Acids Res 42, e168 (2014). - PMC - PubMed
    1. Wu Y, et al. Highly efficient therapeutic gene editing of human hematopoietic stem cells. Nat Med 25, 776–783 (2019). - PMC - PubMed

Publication types