

A saturated map of common genetic variants associated with human height
- PMID: 36224396
- PMCID: PMC9605867
- DOI: 10.1038/s41586-022-05275-y
A saturated map of common genetic variants associated with human height
Abstract
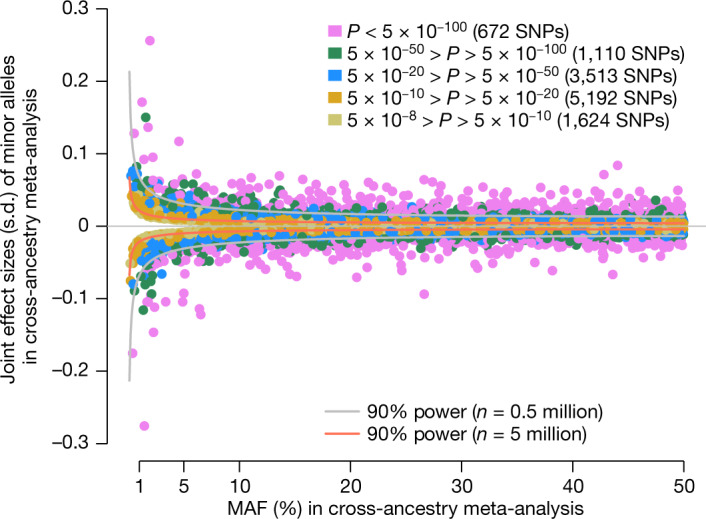
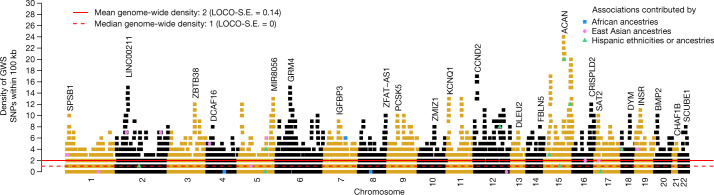
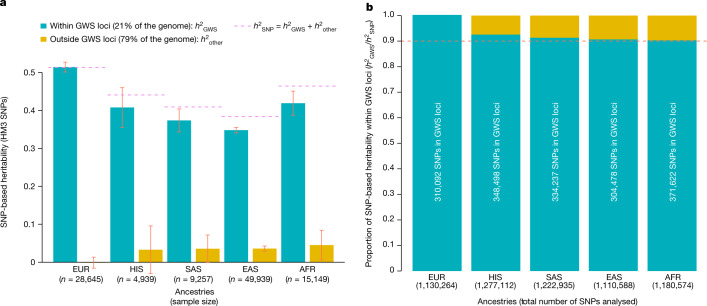
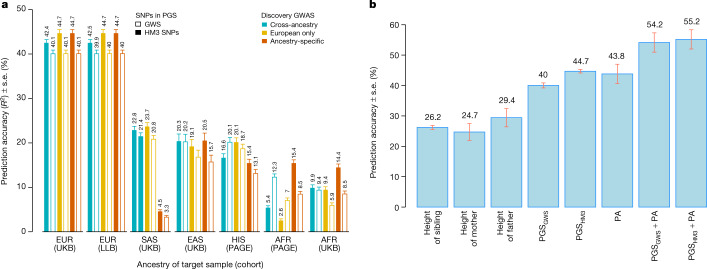
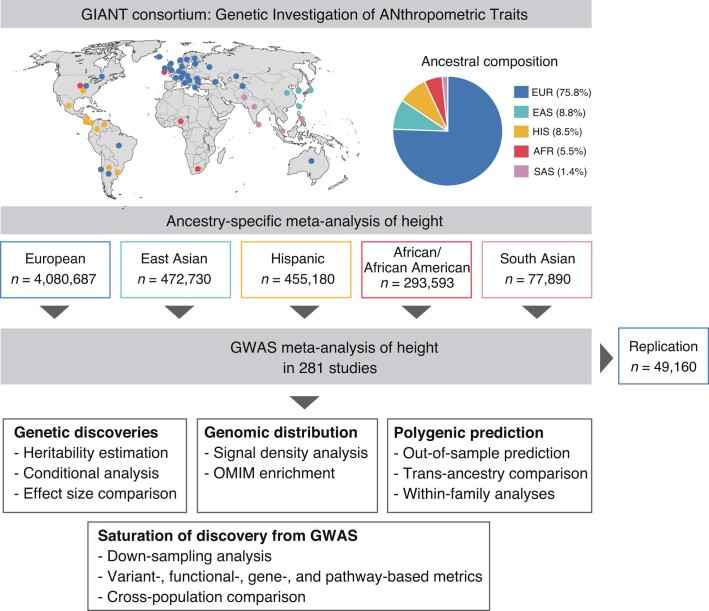
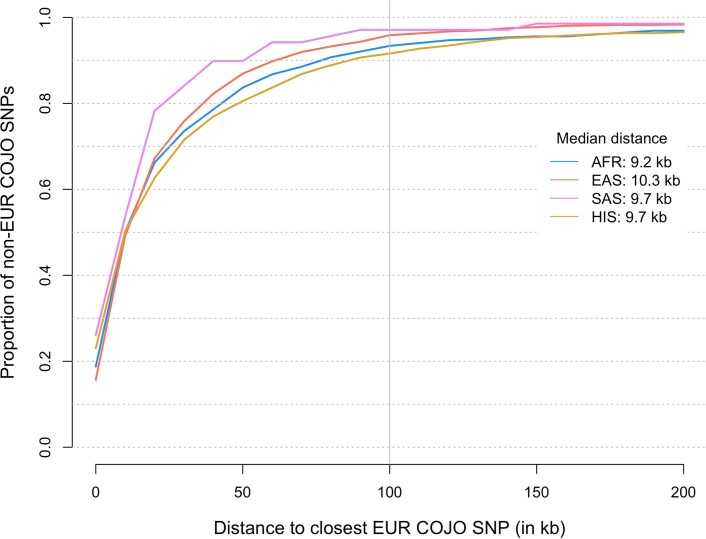
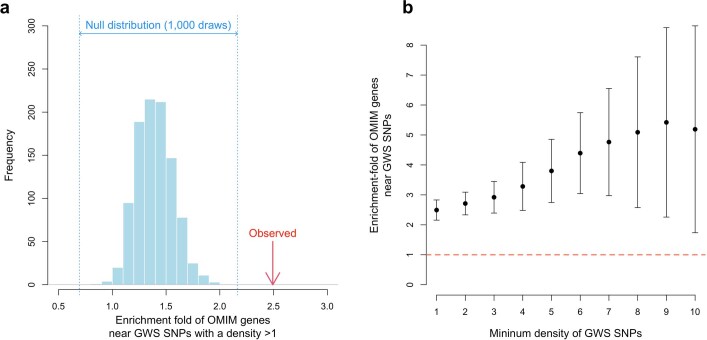
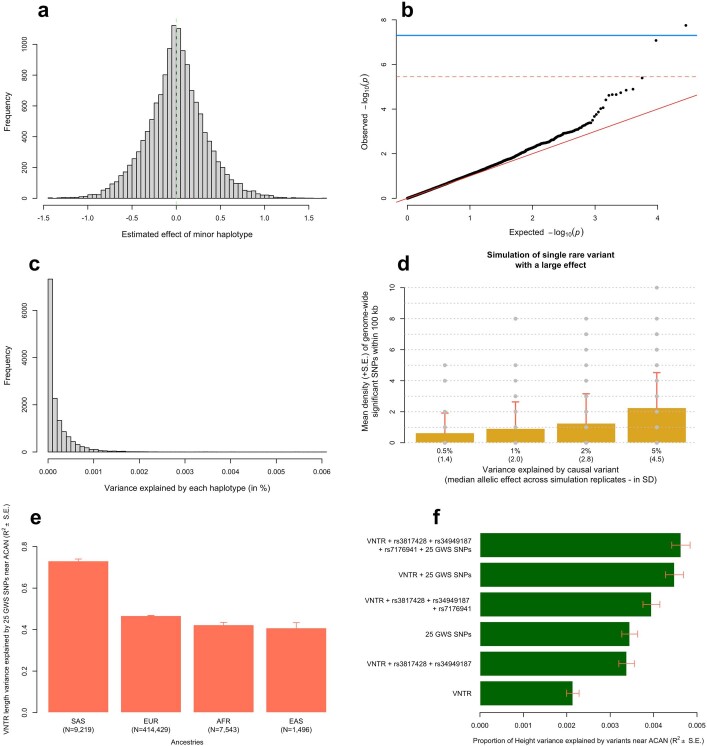
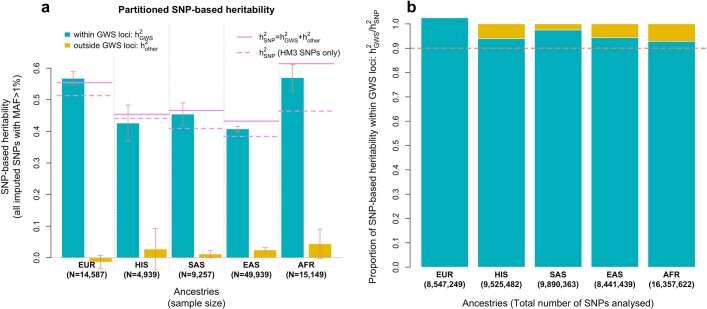
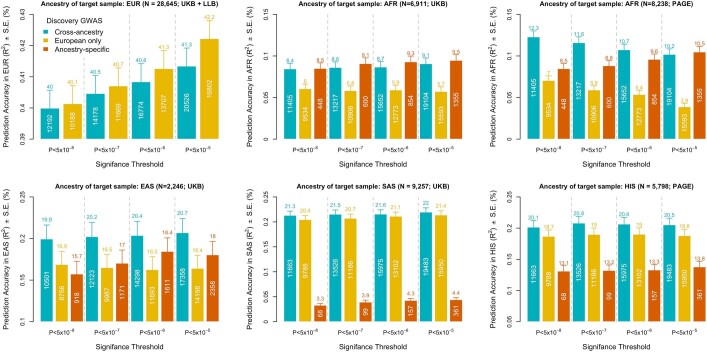
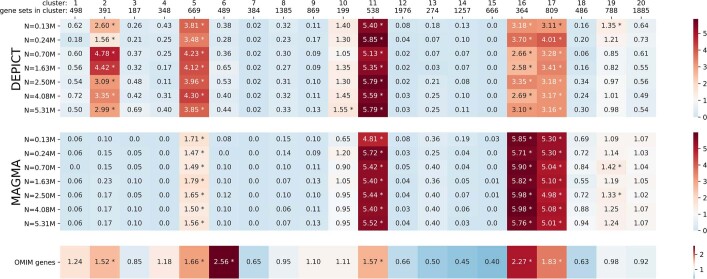
Common single-nucleotide polymorphisms (SNPs) are predicted to collectively explain 40-50% of phenotypic variation in human height, but identifying the specific variants and associated regions requires huge sample sizes1. Here, using data from a genome-wide association study of 5.4 million individuals of diverse ancestries, we show that 12,111 independent SNPs that are significantly associated with height account for nearly all of the common SNP-based heritability. These SNPs are clustered within 7,209 non-overlapping genomic segments with a mean size of around 90 kb, covering about 21% of the genome. The density of independent associations varies across the genome and the regions of increased density are enriched for biologically relevant genes. In out-of-sample estimation and prediction, the 12,111 SNPs (or all SNPs in the HapMap 3 panel2) account for 40% (45%) of phenotypic variance in populations of European ancestry but only around 10-20% (14-24%) in populations of other ancestries. Effect sizes, associated regions and gene prioritization are similar across ancestries, indicating that reduced prediction accuracy is likely to be explained by linkage disequilibrium and differences in allele frequency within associated regions. Finally, we show that the relevant biological pathways are detectable with smaller sample sizes than are needed to implicate causal genes and variants. Overall, this study provides a comprehensive map of specific genomic regions that contain the vast majority of common height-associated variants. Although this map is saturated for populations of European ancestry, further research is needed to achieve equivalent saturation in other ancestries.
© 2022. The Author(s).
Conflict of interest statement
Y. Jiang is employed by and holds stock or stock options in 23andMe. T.S.A. is a shareholder in Zealand Pharma A/S and Novo Nordisk A/S. G.C.-P. is an employee of 23andMe. M.E.K. is employed by SYNLAB Holding Deutschland GmbH. H.L.L. receives support from a consulting contract between Data Tecnica International and the National Institute on Aging (NIA), National Institutes of Health (NIH). As of January 2020, A. Mahajan is an employee of Genentech, and a holder of Roche stock. I.N. is an employee and stock owner of Gilead Sciences; this work was conducted before employment by Gilead Sciences. J. Shi is employed by and holds stock or stock options in 23andMe. C. Sidore is an employee of Regeneron. V. Steinthorsdottir is employed by deCODE Genetics/Amgen. Since completing the work contributed to this paper, D.J.T. has left the University of Cambridge and is now employed by Genomics PLC. G.T. is employed by deCODE Genetics/Amgen. S.W.v.d.L. has received Roche funding for unrelated work. H.B. has consultant arrangements with Chiesi Pharmaceuticals and Boehringer Ingelheim. M. J. Caulfield is Chief Scientist for Genomics England, a UK Government company. M. J. Cutler has served on the advisory board or consulted for Biosense Webster, Janssen Scientific Affairs and Johnson & Johnson. S.M.D. receives research support from RenalytixAI and personal consulting fees from Calico Labs, outside the scope of the current research. P.T.E. receives sponsored research support from Bayer AG and IBM Health, and he has served on advisory boards or consulted for Bayer AG, Quest Diagnostics, MyoKardia and Novartis. P. Kirchhof has received support from several drug and device companies active in atrial fibrillation, and has received honoraria from several such companies in the past, but not in the last three years. P. Kirchhof is listed as inventor on two patents held by University of Birmingham (Atrial Fibrillation Therapy WO 2015140571, Markers for Atrial Fibrillation WO 2016012783). G.D.K. has given talks, attended conferences and participated in trials sponsored by Amgen, MSD, Lilly, Vianex and Sanofi, and has also accepted travel support to conferences from Amgen, Sanofi, MSD and Elpen. S. A. Lubitz previously received sponsored research support from Bristol Myers Squibb, Pfizer, Bayer AG, Boehringer Ingelheim, Fitbit and IBM, and has consulted for Bristol Myers Squibb, Pfizer, Bayer AG and Blackstone Life Sciences. S. A. Lubitz is a current employee of Novartis Institute of Biomedical Research. W.M. reports grants and personal fees from AMGEN, BASF, Sanofi, Siemens Diagnostics, Aegerion Pharmaceuticals, Astrazeneca, Danone Research, Numares, Pfizer and Hoffmann LaRoche; personal fees from MSD and Alexion; and grants from Abbott Diagnostics, all outside the submitted work. W.M. is employed with Synlab Holding Deutschland. M.A.N. receives support from a consulting contract between Data Tecnica International and the National Institute on Aging (NIA), National Institutes of Health (NIH). S.N. is a scientific advisor to Circle software, ADAS software, CardioSolv and ImriCor and receives grant support from Biosense Webster, ADAS software and ImriCor. H. Schunkert has received honoraria for consulting from AstraZeneca, MSD, Merck, Daiichi, Servier, Amgen and Takeda Pharma. He has further received honoraria for lectures and/or chairs from AstraZeneca, BayerVital, BRAHMS, Daiichi, Medtronic, Novartis, Sanofi and Servier. P.S. has received research awards from Pfizer. The members of the 23andMe Research Team are employed by and hold stock or stock options in 23andMe. The views expressed in this article are those of the author(s) and not necessarily those of the NHS, the NIHR or the Department of Health. M. I. McCarthy has served on advisory panels for Pfizer, Novo Nordisk and Zoe Global, and has received honoraria from Merck, Pfizer, Novo Nordisk and Eli Lilly and research funding from Abbvie, AstraZeneca, Boehringer Ingelheim, Eli Lilly, Janssen, Merck, Novo Nordisk, Pfizer, Roche, Sanofi Aventis, Servier and Takeda. As of June 2019, M. I. McCarthy is an employee of Genentech, and a holder of Roche stock. C.J.O. is a current employee of Novartis Institute of Biomedical Research. U.T. is employed by deCODE Genetics (Amgen). K.S. is employed by deCODE Genetics (Amgen). A. Auton is employed by and holds stock or stock options in 23andMe. G.R.A. is an employee of Regeneron Pharmaceuticals and owns stock and stock options for Regeneron Pharmaceuticals. C.J.W.'s spouse is employed by Regeneron. A.E.L. is currently employed by and holds stock in Regeneron Pharmaceuticals. J.N.H. holds equity in Camp4 Therapeutics. The remaining authors declare no competing interests.
Figures
Comment in
-
Missing heritability found for height.Nature. 2022 Oct;610(7933):631-632. doi: 10.1038/d41586-022-03029-4. Nature. 2022. PMID: 36224358 No abstract available.
References
Publication types
MeSH terms
Grants and funding
- R01 DK093757/DK/NIDDK NIH HHS/United States
- MC_UU_00007/10/MRC_/Medical Research Council/United Kingdom
- U10 HL054472/HL/NHLBI NIH HHS/United States
- U01 HL054472/HL/NHLBI NIH HHS/United States
- S10 OD017985/OD/NIH HHS/United States
- P30 AG072975/AG/NIA NIH HHS/United States
- R01 DA005147/DA/NIDA NIH HHS/United States
- RC4 AG039029/AG/NIA NIH HHS/United States
- DA037904/DA/NIDA NIH HHS/United States
- MC_U137686851/MRC_/Medical Research Council/United Kingdom
- R01 DA036216/DA/NIDA NIH HHS/United States
- N02-HL-64278/HL/NHLBI NIH HHS/United States
- RC2 MH089951/MH/NIMH NIH HHS/United States
- HL113338/HL/NHLBI NIH HHS/United States
- S10RR025141/RR/NCRR NIH HHS/United States
- G1001799/MRC_/Medical Research Council/United Kingdom
- U01 HL054471/HL/NHLBI NIH HHS/United States
- U54MD007593/MD/NIMHD NIH HHS/United States
- U01HL080295/HL/NHLBI NIH HHS/United States
- 29017/CRUK_/Cancer Research UK/United Kingdom
- G0601463/MRC_/Medical Research Council/United Kingdom
- U01 AG046152/AG/NIA NIH HHS/United States
- R01 HL053353/HL/NHLBI NIH HHS/United States
- R01-DK-089256/DK/NIDDK NIH HHS/United States
- R37-HL045508/HL/NHLBI NIH HHS/United States
- 1U01HG011719/HG/NHGRI NIH HHS/United States
- U01 AG023712/AG/NIA NIH HHS/United States
- R01 HL103612/HL/NHLBI NIH HHS/United States
- 75N92020D00002/HL/NHLBI NIH HHS/United States
- R01-HL086718/HL/NHLBI NIH HHS/United States
- KL2TR002490/TR/NCATS NIH HHS/United States
- HHSN268201100001I/HL/NHLBI NIH HHS/United States
- P01 HL060030/HL/NHLBI NIH HHS/United States
- N01 HC085080/HL/NHLBI NIH HHS/United States
- 75N92021D00002/HL/NHLBI NIH HHS/United States
- HHSN268201500003C/HL/NHLBI NIH HHS/United States
- U01 HG008676/HG/NHGRI NIH HHS/United States
- U01 HL054496/HL/NHLBI NIH HHS/United States
- UL1 TR000445/TR/NCATS NIH HHS/United States
- R37 AA009367/AA/NIAAA NIH HHS/United States
- CH/1996001/9454/BHF_/British Heart Foundation/United Kingdom
- R01 HL139731/HL/NHLBI NIH HHS/United States
- R01 NS045012/NS/NINDS NIH HHS/United States
- U01AG023744/AG/NIA NIH HHS/United States
- N01 HC095161/HL/NHLBI NIH HHS/United States
- N01-HC65233/HL/NHLBI NIH HHS/United States
- R01DK072193/DK/NIDDK NIH HHS/United States
- U01 HG004438/HG/NHGRI NIH HHS/United States
- R01 HG003054/HG/NHGRI NIH HHS/United States
- R01-NS114045/NS/NINDS NIH HHS/United States
- HHSN268201800012I/HB/NHLBI NIH HHS/United States
- R01 AA007535/AA/NIAAA NIH HHS/United States
- R01-CA082664/CA/NCI NIH HHS/United States
- P30 ES010126/ES/NIEHS NIH HHS/United States
- HHSN268201800012C/HL/NHLBI NIH HHS/United States
- R01HL157635/HL/NHLBI NIH HHS/United States
- MR/R024227/1/MRC_/Medical Research Council/United Kingdom
- P60 AR049465/AR/NIAMS NIH HHS/United States
- 75N92020D00005/HL/NHLBI NIH HHS/United States
- R01 HL067974/HL/NHLBI NIH HHS/United States
- R01 HL104135/HL/NHLBI NIH HHS/United States
- UM1 CA164973/CA/NCI NIH HHS/United States
- N01-HC-95159/HL/NHLBI NIH HHS/United States
- N01 HC095168/HL/NHLBI NIH HHS/United States
- U01 AG023744/AG/NIA NIH HHS/United States
- R01 HD58886/HD/NICHD NIH HHS/United States
- UL1TR001881/TR/NCATS NIH HHS/United States
- R01 MH081802/MH/NIMH NIH HHS/United States
- RF1 AG015819/AG/NIA NIH HHS/United States
- R01 CA80205/CA/NCI NIH HHS/United States
- U01AG46152/AG/NIA NIH HHS/United States
- U01 HG004446/HG/NHGRI NIH HHS/United States
- R01HL086718/HL/NHLBI NIH HHS/United States
- DA042755/DA/NIDA NIH HHS/United States
- I01 BX004821/BX/BLRD VA/United States
- DK056350/DK/NIDDK NIH HHS/United States
- R01 NR013520/NR/NINR NIH HHS/United States
- U19AG063893/AG/NIA NIH HHS/United States
- R01 HL046380/HL/NHLBI NIH HHS/United States
- R01DK124097/DK/NIDDK NIH HHS/United States
- R01-NS105150/NS/NINDS NIH HHS/United States
- R01 AA014041/AA/NIAAA NIH HHS/United States
- U01AG023755/AG/NIA NIH HHS/United States
- R01 HL120393/HL/NHLBI NIH HHS/United States
- 1R01HL139731/HL/NHLBI NIH HHS/United States
- K24 HL105780/HL/NHLBI NIH HHS/United States
- U10 HL054509/HL/NHLBI NIH HHS/United States
- N01-HC-95166/HL/NHLBI NIH HHS/United States
- Z01 HG000024/ImNIH/Intramural NIH HHS/United States
- 75N92021D00005/WH/WHI NIH HHS/United States
- U10 CA037429/CA/NCI NIH HHS/United States
- CA141298/CA/NCI NIH HHS/United States
- N01-HC65237/HL/NHLBI NIH HHS/United States
- U01AG023746/AG/NIA NIH HHS/United States
- R01 HL111249/HL/NHLBI NIH HHS/United States
- KL2-RR024990/RR/NCRR NIH HHS/United States
- R35-HL135818/HL/NHLBI NIH HHS/United States
- R01 AA009367/AA/NIAAA NIH HHS/United States
- U01 DP006266/DP/NCCDPHP CDC HHS/United States
- U01 AG009740/AG/NIA NIH HHS/United States
- 212946/Z/18/Z/WT_/Wellcome Trust/United Kingdom
- U01 HL054527/HL/NHLBI NIH HHS/United States
- HHSN268201800004I/HL/NHLBI NIH HHS/United States
- P01 CA087969/CA/NCI NIH HHS/United States
- U01 HL080295/HL/NHLBI NIH HHS/United States
- N01 HG065403/HG/NHGRI NIH HHS/United States
- UL1 RR025005/RR/NCRR NIH HHS/United States
- R01-HL053353/HL/NHLBI NIH HHS/United States
- U01-HL054512/HL/NHLBI NIH HHS/United States
- RC2 MH089995/MH/NIMH NIH HHS/United States
- N02 HL064278/HL/NHLBI NIH HHS/United States
- P60 AR030701/AR/NIAMS NIH HHS/United States
- P30 CA015704/CA/NCI NIH HHS/United States
- N01 HC085082/HL/NHLBI NIH HHS/United States
- ES010126/ES/NIEHS NIH HHS/United States
- R01 HD030880/HD/NICHD NIH HHS/United States
- HHSN268201100004I/HL/NHLBI NIH HHS/United States
- N01 HC065233/HL/NHLBI NIH HHS/United States
- P30AG10161/AG/NIA NIH HHS/United States
- U01 DK105556/DK/NIDDK NIH HHS/United States
- P50GM115305/GM/NIGMS NIH HHS/United States
- HHSN268201500001C/HL/NHLBI NIH HHS/United States
- R01 CA067262/CA/NCI NIH HHS/United States
- R01 HL091357/HL/NHLBI NIH HHS/United States
- UL1 TR001079/TR/NCATS NIH HHS/United States
- R01HL120393/HL/NHLBI NIH HHS/United States
- 5-P60-AR30701/AR/NIAMS NIH HHS/United States
- N01 HC095169/HL/NHLBI NIH HHS/United States
- UL1 TR001878/TR/NCATS NIH HHS/United States
- HHSN268201800014I/HB/NHLBI NIH HHS/United States
- N01-HD-1-3330/HD/NICHD NIH HHS/United States
- R01 HL092577/HL/NHLBI NIH HHS/United States
- MC_QA137853/MRC_/Medical Research Council/United Kingdom
- DP2 ES030554 /ES/NIEHS NIH HHS/United States
- R-35-HL135824/HL/NHLBI NIH HHS/United States
- U19HL065962/HL/NHLBI NIH HHS/United States
- R01 HL043851/HL/NHLBI NIH HHS/United States
- R01DK104371/DK/NIDDK NIH HHS/United States
- U01 HL130114/HL/NHLBI NIH HHS/United States
- R01 HL087660/HL/NHLBI NIH HHS/United States
- R01HL108427/HL/NHLBI NIH HHS/United States
- AG000513/AG/NIA NIH HHS/United States
- R01-HL067974/HL/NHLBI NIH HHS/United States
- U01 HG007416/HG/NHGRI NIH HHS/United States
- R01CA148677/CA/NCI NIH HHS/United States
- N01 HC065236/HL/NHLBI NIH HHS/United States
- R01D0042157-01A1/NH/NIH HHS/United States
- U01 HG008657/HG/NHGRI NIH HHS/United States
- N01-AG-1-2100/AG/NIA NIH HHS/United States
- 29186/CRUK_/Cancer Research UK/United Kingdom
- UM1 CA176726/CA/NCI NIH HHS/United States
- U01 HG 004446/HG/NHGRI NIH HHS/United States
- N01-HD-1-3332/HD/NICHD NIH HHS/United States
- R01 MD009164/MD/NIMHD NIH HHS/United States
- P01 CA055075/CA/NCI NIH HHS/United States
- N01 HC065235/HL/NHLBI NIH HHS/United States
- R01 HD30880/HD/NICHD NIH HHS/United States
- HHSN268200800007C/HL/NHLBI NIH HHS/United States
- U01HG008680/HG/NHGRI NIH HHS/United States
- UL1-TR-001420/TR/NCATS NIH HHS/United States
- N01 HC085086/HL/NHLBI NIH HHS/United States
- R01 HL085251/HL/NHLBI NIH HHS/United States
- AA009367/AA/NIAAA NIH HHS/United States
- N01 HC085083/HL/NHLBI NIH HHS/United States
- DK063491/DK/NIDDK NIH HHS/United States
- R01 AG030146/AG/NIA NIH HHS/United States
- G0700931/MRC_/Medical Research Council/United Kingdom
- U01HL54527/HL/NHLBI NIH HHS/United States
- U19 HL065962/HL/NHLBI NIH HHS/United States
- R01CA15847/CA/NCI NIH HHS/United States
- 1K08HG010155/HG/NHGRI NIH HHS/United States
- U01HG004798/HG/NHGRI NIH HHS/United States
- U01 HL054509/HL/NHLBI NIH HHS/United States
- 75N92020D00001/HL/NHLBI NIH HHS/United States
- U01 CA176726/CA/NCI NIH HHS/United States
- U01AG023749/AG/NIA NIH HHS/United States
- RO1 MH58799-03/MH/NIMH NIH HHS/United States
- U01HG008664/HG/NHGRI NIH HHS/United States
- U01 HG011719/HG/NHGRI NIH HHS/United States
- CA098758/CA/NCI NIH HHS/United States
- UM1CA167552/CA/NCI NIH HHS/United States
- U01 CA188392/CA/NCI NIH HHS/United States
- U01HG008673/HG/NHGRI NIH HHS/United States
- 212945/Z/18/Z/WT_/Wellcome Trust/United Kingdom
- R01 DK118427/DK/NIDDK NIH HHS/United States
- R01 HL113338/HL/NHLBI NIH HHS/United States
- HHSN268201100046C/HL/NHLBI NIH HHS/United States
- R01HL24799/HL/NHLBI NIH HHS/United States
- N01-HC-95160/HL/NHLBI NIH HHS/United States
- U01HG004438/HG/NHGRI NIH HHS/United States
- Z01CP010119/CA/NCI NIH HHS/United States
- R01NS032830/NS/NINDS NIH HHS/United States
- R01 HL153805/HL/NHLBI NIH HHS/United States
- R01 DK072193/DK/NIDDK NIH HHS/United States
- P30AG72975/AG/NIA NIH HHS/United States
- R01AG056477/AG/NIA NIH HHS/United States
- R01 HL142302/HL/NHLBI NIH HHS/United States
- R01-AG028050/AG/NIA NIH HHS/United States
- AA-09203/AA/NIAAA NIH HHS/United States
- R01 HL074166/HL/NHLBI NIH HHS/United States
- S10 RR025141/RR/NCRR NIH HHS/United States
- UL1RR024975/RR/NCRR NIH HHS/United States
- R01 DK110113/DK/NIDDK NIH HHS/United States
- R37 HL045508/HL/NHLBI NIH HHS/United States
- R01 CA144034/CA/NCI NIH HHS/United States
- R01AG30146/AG/NIA NIH HHS/United States
- R01 HL086694/HL/NHLBI NIH HHS/United States
- R35 HL135824/HL/NHLBI NIH HHS/United States
- R01-NR012459/NR/NINR NIH HHS/United States
- R01 DK104371/DK/NIDDK NIH HHS/United States
- R01 AA013326/AA/NIAAA NIH HHS/United States
- K02AA018755/AA/NIAAA NIH HHS/United States
- HL54496/HL/NHLBI NIH HHS/United States
- R01HD074711/HD/NICHD NIH HHS/United States
- N01-HC-95167/HL/NHLBI NIH HHS/United States
- HHSN268201100003C/WH/WHI NIH HHS/United States
- 1U19 CA148537/CA/NCI NIH HHS/United States
- R01 AG065357/AG/NIA NIH HHS/United States
- EY014684-03S1/EY/NEI NIH HHS/United States
- N01 HC095167/HL/NHLBI NIH HHS/United States
- R01 DK107786/DK/NIDDK NIH HHS/United States
- R56 DA012854/DA/NIDA NIH HHS/United States
- R01 HL087652/HL/NHLBI NIH HHS/United States
- R01HL111249/HL/NHLBI NIH HHS/United States
- AA13320/AA/NIAAA NIH HHS/United States
- HL54495/HL/NHLBI NIH HHS/United States
- U01 HG007376/HG/NHGRI NIH HHS/United States
- MC_UU_00011/1/MRC_/Medical Research Council/United Kingdom
- R01 AG017917/AG/NIA NIH HHS/United States
- N01-AG-6-2103/AG/NIA NIH HHS/United States
- R01-CA080122/CA/NCI NIH HHS/United States
- MC_UU_12026/2/MRC_/Medical Research Council/United Kingdom
- R01 HL088457/HL/NHLBI NIH HHS/United States
- R01-DK062370/DK/NIDDK NIH HHS/United States
- R01-HL-60030/HL/NHLBI NIH HHS/United States
- T32 HG002295/HG/NHGRI NIH HHS/United States
- U01HG008657/HG/NHGRI NIH HHS/United States
- U01 HG004402/HG/NHGRI NIH HHS/United States
- R01 DK075787/DK/NIDDK NIH HHS/United States
- RR020649/RR/NCRR NIH HHS/United States
- N01-HD-1-3331/HD/NICHD NIH HHS/United States
- R01 AA009203/AA/NIAAA NIH HHS/United States
- R01 CA49449/CA/NCI NIH HHS/United States
- R01 AG034454/AG/NIA NIH HHS/United States
- U01HG004402/HG/NHGRI NIH HHS/United States
- R01DK075787/DK/NIDDK NIH HHS/United States
- HL 046389/HL/NHLBI NIH HHS/United States
- R01 EY022310/EY/NEI NIH HHS/United States
- HL54473/HL/NHLBI NIH HHS/United States
- U01HL54498/HL/NHLBI NIH HHS/United States
- MC_UU_00019/1/MRC_/Medical Research Council/United Kingdom
- N01-HC65234/HL/NHLBI NIH HHS/United States
- R01 NS100178/NS/NINDS NIH HHS/United States
- U01HG006378/HG/NHGRI NIH HHS/United States
- R35HL135818/HL/NHLBI NIH HHS/United States
- 1U19 CA148112/CA/NCI NIH HHS/United States
- U24 MH068457-06/MH/NIMH NIH HHS/United States
- U01HG007376/HG/NHGRI NIH HHS/United States
- 5K08HL135275/HL/NHLBI NIH HHS/United States
- R01 TW005596/TW/FIC NIH HHS/United States
- R01 NR012459/NR/NINR NIH HHS/United States
- 75N92020D00003/HL/NHLBI NIH HHS/United States
- N02-HL-6-4278/HL/NHLBI NIH HHS/United States
- MC_PC_20026/MRC_/Medical Research Council/United Kingdom
- R01 DK092127-04/DK/NIDDK NIH HHS/United States
- HHSN268201800014C/HL/NHLBI NIH HHS/United States
- N01 HC095159/HL/NHLBI NIH HHS/United States
- U01 HL054464/HL/NHLBI NIH HHS/United States
- 1RO1HL092577/HL/NHLBI NIH HHS/United States
- P20 RR020649/RR/NCRR NIH HHS/United States
- G0601966/MRC_/Medical Research Council/United Kingdom
- N01-HC65235/HL/NHLBI NIH HHS/United States
- MC_UU_12015/1/MRC_/Medical Research Council/United Kingdom
- R01 CA056678/CA/NCI NIH HHS/United States
- R01 HL119443/HL/NHLBI NIH HHS/United States
- U01AG61256/AG/NIA NIH HHS/United States
- U01HG007416/HG/NHGRI NIH HHS/United States
- R01 DK087914/DK/NIDDK NIH HHS/United States
- 75N92021D00001/HL/NHLBI NIH HHS/United States
- U01 DK105535/DK/NIDDK NIH HHS/United States
- N01-HG-65403/HG/NHGRI NIH HHS/United States
- NR013520/NR/NINR NIH HHS/United States
- K25 HL150334/HL/NHLBI NIH HHS/United States
- R01 DK062370/DK/NIDDK NIH HHS/United States
- R01 HL105756/HL/NHLBI NIH HHS/United States
- R01DK110113/DK/NIDDK NIH HHS/United States
- HHSN268201200008C/HL/NHLBI NIH HHS/United States
- U19 CA055075/CA/NCI NIH HHS/United States
- UM1CA182910/CA/NCI NIH HHS/United States
- UL1TR001878/TR/NCATS NIH HHS/United States
- HL129982/HL/NHLBI NIH HHS/United States
- R01 AA013321/AA/NIAAA NIH HHS/United States
- N01-HC-95163/HL/NHLBI NIH HHS/United States
- T32 HL129982/HL/NHLBI NIH HHS/United States
- R01 MH058799/MH/NIMH NIH HHS/United States
- U01 HG008672/HG/NHGRI NIH HHS/United States
- R01 HL108427/HL/NHLBI NIH HHS/United States
- R35 HL135818/HL/NHLBI NIH HHS/United States
- R01 CA128978/CA/NCI NIH HHS/United States
- U01 DK062418/DK/NIDDK NIH HHS/United States
- R01 HG011052/HG/NHGRI NIH HHS/United States
- DA036216/DA/NIDA NIH HHS/United States
- N01-HD-1-3329/HD/NICHD NIH HHS/United States
- HHSN268201800003I/HL/NHLBI NIH HHS/United States
- U01 HG008684/HG/NHGRI NIH HHS/United States
- HHSN268200782096C/HG/NHGRI NIH HHS/United States
- U01HG008672/HG/NHGRI NIH HHS/United States
- R01HL085251/HL/NHLBI NIH HHS/United States
- N01 HC065234/HL/NHLBI NIH HHS/United States
- MC_PC_14135/MRC_/Medical Research Council/United Kingdom
- DA044283/DA/NIDA NIH HHS/United States
- UL1-TR-001079/TR/NCATS NIH HHS/United States
- N01-HC-25195/HL/NHLBI NIH HHS/United States
- P30 DK063491/DK/NIDDK NIH HHS/United States
- N01-HD-1-3228/HD/NICHD NIH HHS/United States
- R01-DK122503/DK/NIDDK NIH HHS/United States
- EP-C-15-001/EPA/EPA/United States
- R01 CA064277/CA/NCI NIH HHS/United States
- HHSN268201800007I/HL/NHLBI NIH HHS/United States
- HHSN268201700002C/HL/NHLBI NIH HHS/United States
- R01 DK066358/DK/NIDDK NIH HHS/United States
- P30 AG010161/AG/NIA NIH HHS/United States
- P30 DK072488/DK/NIDDK NIH HHS/United States
- HHSN268201800001C/HL/NHLBI NIH HHS/United States
- U01 HG008679/HG/NHGRI NIH HHS/United States
- R01 EY014684/EY/NEI NIH HHS/United States
- CA128978/CA/NCI NIH HHS/United States
- 263 MD 821336/MD/NIMHD NIH HHS/United States
- IK2 CX001780/CX/CSRD VA/United States
- AA10248/AA/NIAAA NIH HHS/United States
- R35 CA053890/CA/NCI NIH HHS/United States
- R01 DA042755/DA/NIDA NIH HHS/United States
- HHSN268201200036C/HL/NHLBI NIH HHS/United States
- HL54471/HL/NHLBI NIH HHS/United States
- R01-HL046380/HL/NHLBI NIH HHS/United States
- R01 DK101855/DK/NIDDK NIH HHS/United States
- N01-HC-95168/HL/NHLBI NIH HHS/United States
- HL54515/HL/NHLBI NIH HHS/United States
- HHSN268201700001I/HL/NHLBI NIH HHS/United States
- R01 HD056465/HD/NICHD NIH HHS/United States
- U19 CA148537/CA/NCI NIH HHS/United States
- IK2 CX001907/CX/CSRD VA/United States
- P01 CA87969/CA/NCI NIH HHS/United States
- N01 HC025195/HL/NHLBI NIH HHS/United States
- R01-CA056678/CA/NCI NIH HHS/United States
- HHSN268201800013I/MD/NIMHD NIH HHS/United States
- Z01 AG000513/ImNIH/Intramural NIH HHS/United States
- U01 NS069208/NS/NINDS NIH HHS/United States
- U01 AG023749/AG/NIA NIH HHS/United States
- UL1TR002243/TR/NCATS NIH HHS/United States
- UL1RR025005/RR/NCRR NIH HHS/United States
- N01 HC055222/HL/NHLBI NIH HHS/United States
- EY022310/EY/NEI NIH HHS/United States
- DA005147/DA/NIDA NIH HHS/United States
- U01HG004446/HG/NHGRI NIH HHS/United States
- U01 HL054457/HL/NHLBI NIH HHS/United States
- R01HL142302/HL/NHLBI NIH HHS/United States
- ZIA CP010152/ImNIH/Intramural NIH HHS/United States
- HHSN271201100004C/AG/NIA NIH HHS/United States
- HHSN268201700004I/HL/NHLBI NIH HHS/United States
- CA063464/CA/NCI NIH HHS/United States
- AA-00145/AA/NIAAA NIH HHS/United States
- R01 HL151152/HL/NHLBI NIH HHS/United States
- R01 CA055069/CA/NCI NIH HHS/United States
- N01-HC65236/HL/NHLBI NIH HHS/United States
- U01 HG008666/HG/NHGRI NIH HHS/United States
- R01 CA063464/CA/NCI NIH HHS/United States
- DK125187/DK/NIDDK NIH HHS/United States
- HHSN268201500001I/HL/NHLBI NIH HHS/United States
- 75N92021D00003/WH/WHI NIH HHS/United States
- N.1-AG-1-1/AG/NIA NIH HHS/United States
- R01 HD074711/HD/NICHD NIH HHS/United States
- U01 AG023755/AG/NIA NIH HHS/United States
- UM1 CA186107/CA/NCI NIH HHS/United States
- N01 HC085079/HL/NHLBI NIH HHS/United States
- R01 HD100406/HD/NICHD NIH HHS/United States
- R01DK107786/DK/NIDDK NIH HHS/United States
- R01 NS114045/NS/NINDS NIH HHS/United States
- U01 HL054498/HL/NHLBI NIH HHS/United States
- R01HL111249-04S1/HL/NHLBI NIH HHS/United States
- D43 TW009077/TW/FIC NIH HHS/United States
- K05 CA175147/CA/NCI NIH HHS/United States
- RC2 GM092618/GM/NIGMS NIH HHS/United States
- U01-DK105535/DK/NIDDK NIH HHS/United States
- 1RC2MH089951-01/MH/NIMH NIH HHS/United States
- R01HL087652/HL/NHLBI NIH HHS/United States
- U01HG008684/HG/NHGRI NIH HHS/United States
- R01HL087641/HL/NHLBI NIH HHS/United States
- AA014041/AA/NIAAA NIH HHS/United States
- R01HL105756/HL/NHLBI NIH HHS/United States
- R01 CA67262/CA/NCI NIH HHS/United States
- K02 AA018755/AA/NIAAA NIH HHS/United States
- S10OD017985/NH/NIH HHS/United States
- U01HG008666/HG/NHGRI NIH HHS/United States
- HHSN268201100002C/WH/WHI NIH HHS/United States
- UL1 TR001420/TR/NCATS NIH HHS/United States
- UL1TR000445/TR/NCATS NIH HHS/United States
- CA054281/CA/NCI NIH HHS/United States
- 75N92020D00004/HL/NHLBI NIH HHS/United States
- EY014684/EY/NEI NIH HHS/United States
- R01 CA082664/CA/NCI NIH HHS/United States
- U24 MH068457/MH/NIMH NIH HHS/United States
- UM1 CA182913/CA/NCI NIH HHS/United States
- U01HG008701/HG/NHGRI NIH HHS/United States
- 1Z01-HG000024/HG/NHGRI NIH HHS/United States
- 1RC2 MH089995/MH/NIMH NIH HHS/United States
- 75N92020D00007/HL/NHLBI NIH HHS/United States
- R01 DA012854/DA/NIDA NIH HHS/United States
- MC_UU_00017/1/MRC_/Medical Research Council/United Kingdom
- R01 CA054281/CA/NCI NIH HHS/United States
- R01AG023629/AG/NIA NIH HHS/United States
- KL2 RR024990/RR/NCRR NIH HHS/United States
- U01 CA063464/CA/NCI NIH HHS/United States
- P50 GM115305/GM/NIGMS NIH HHS/United States
- N01 HC095163/HL/NHLBI NIH HHS/United States
- HHSN268201800011C/HL/NHLBI NIH HHS/United States
- HL54472/HL/NHLBI NIH HHS/United States
- U01 DP003206/DP/NCCDPHP CDC HHS/United States
- 1X01HG006934-01/HG/NHGRI NIH HHS/United States
- K05 AA000145/AA/NIAAA NIH HHS/United States
- U01 NS069208-01/NS/NINDS NIH HHS/United States
- R01 AG028050/AG/NIA NIH HHS/United States
- TW005596/TW/FIC NIH HHS/United States
- N01-AG-6-2106/AG/NIA NIH HHS/United States
- N01-HC-95162/HL/NHLBI NIH HHS/United States
- R01-CA092579/CA/NCI NIH HHS/United States
- UM1CA182913/CA/NCI NIH HHS/United States
- R01-DK072193/DK/NIDDK NIH HHS/United States
- R01 CA128813/CA/NCI NIH HHS/United States
- U19 AG063893/AG/NIA NIH HHS/United States
- U54 MD007593/MD/NIMHD NIH HHS/United States
- M01 RR007122/RR/NCRR NIH HHS/United States
- R01 CA047988/CA/NCI NIH HHS/United States
- KL2 TR002490/TR/NCATS NIH HHS/United States
- R01CA144034/CA/NCI NIH HHS/United States
- R01-HL 067974/HL/NHLBI NIH HHS/United States
- HHSN268201500003I/HL/NHLBI NIH HHS/United States
- U01HG004423/HG/NHGRI NIH HHS/United States
- R01CA64277/CA/NCI NIH HHS/United States
- R01 HD058886/HD/NICHD NIH HHS/United States
- 75N92021D00006/HL/NHLBI NIH HHS/United States
- 5-P60-AR49465/AR/NIAMS NIH HHS/United States
- HHSN268201700005C/HL/NHLBI NIH HHS/United States
- U01 HG008680/HG/NHGRI NIH HHS/United States
- T32HL129982/HL/NHLBI NIH HHS/United States
- R01HL151152/HL/NHLBI NIH HHS/United States
- R01 HL080467/HL/NHLBI NIH HHS/United States
- AA-12502/AA/NIAAA NIH HHS/United States
- N01-HD-1-3333/HD/NICHD NIH HHS/United States
- R01 HL085144/HL/NHLBI NIH HHS/United States
- R01 DK089256/DK/NIDDK NIH HHS/United States
- U19 CA148112/CA/NCI NIH HHS/United States
- U01 HG006378/HG/NHGRI NIH HHS/United States
- R01 DK124097/DK/NIDDK NIH HHS/United States
- R01 AA012502/AA/NIAAA NIH HHS/United States
- U01HG006379/HG/NHGRI NIH HHS/United States
- Z01 CP010119/ImNIH/Intramural NIH HHS/United States
- U01AG009740/AG/NIA NIH HHS/United States
- R01 DA037904/DA/NIDA NIH HHS/United States
- R01HG010297/HG/NHGRI NIH HHS/United States
- R01 CA080205/CA/NCI NIH HHS/United States
- R01-HL113338/HL/NHLBI NIH HHS/United States
- N01-HC-95164/HL/NHLBI NIH HHS/United States
- AA13321/AA/NIAAA NIH HHS/United States
- HHSN268201700001C/HL/NHLBI NIH HHS/United States
- U01 HG004436/HG/NHGRI NIH HHS/United States
- R01 NS105150/NS/NINDS NIH HHS/United States
- UM1 CA167552/CA/NCI NIH HHS/United States
- P30-CA015704/CA/NCI NIH HHS/United States
- HHSN268201700003C/HL/NHLBI NIH HHS/United States
- R01HL103612/HL/NHLBI NIH HHS/United States
- R01 HL086718/HL/NHLBI NIH HHS/United States
- U01 AG023746/AG/NIA NIH HHS/United States
- DP2 ES030554/ES/NIEHS NIH HHS/United States
- ZIA CP010152-20/CA/NCI NIH HHS/United States
- K24HL105780/HL/NHLBI NIH HHS/United States
- R35 CA53890/CA/NCI NIH HHS/United States
- R01DK118427/DK/NIDDK NIH HHS/United States
- K08 HL135275/HL/NHLBI NIH HHS/United States
- R01 HG010067/HG/NHGRI NIH HHS/United States
- K05-CA175147/CA/NCI NIH HHS/United States
- HHSN268201800015I/HB/NHLBI NIH HHS/United States
- U01 HL054481/HL/NHLBI NIH HHS/United States
- P30 DK056350/DK/NIDDK NIH HHS/United States
- U01 CA098758/CA/NCI NIH HHS/United States
- R01 HL09135701/HL/NHLBI NIH HHS/United States
- U19 CA148065/CA/NCI NIH HHS/United States
- P30 DK020572/DK/NIDDK NIH HHS/United States
- HHSN268201700004C/HL/NHLBI NIH HHS/United States
- R01 DK092127/DK/NIDDK NIH HHS/United States
- R21DK105913/DK/NIDDK NIH HHS/United States
- RF1AG15819/AG/NIA NIH HHS/United States
- 1U19 CA148065/CA/NCI NIH HHS/United States
- R01 AA015416/AA/NIAAA NIH HHS/United States
- R01 NS032830/NS/NINDS NIH HHS/United States
- R03 HL154284/HL/NHLBI NIH HHS/United States
- R01 DK053591/DK/NIDDK NIH HHS/United States
- R01 DK125187/DK/NIDDK NIH HHS/United States
- R01-HL074166/HL/NHLBI NIH HHS/United States
- U01HG008685/HG/NHGRI NIH HHS/United States
- UL1 TR000040/TR/NCATS NIH HHS/United States
- RC2 AG036495/AG/NIA NIH HHS/United States
- UL1 RR024975/RR/NCRR NIH HHS/United States
- X01HG007492/HG/NHGRI NIH HHS/United States
- R21 DK105913/DK/NIDDK NIH HHS/United States
- HL043851/HL/NHLBI NIH HHS/United States
- U10 HL054473/HL/NHLBI NIH HHS/United States
- HHSN268201100003I/HL/NHLBI NIH HHS/United States
- N01-HC-95165/HL/NHLBI NIH HHS/United States
- U01 HG008673/HG/NHGRI NIH HHS/United States
- U19 CA 148537-01/CA/NCI NIH HHS/United States
- UL1 TR000077/TR/NCATS NIH HHS/United States
- R01DK101855/DK/NIDDK NIH HHS/United States
- U10 HL054495/HL/NHLBI NIH HHS/United States
- R01AG17917/AG/NIA NIH HHS/United States
- U01 HG008685/HG/NHGRI NIH HHS/United States
- N.1-AG-1-2111/AG/NIA NIH HHS/United States
- MC_UU_00006/1/MRC_/Medical Research Council/United Kingdom
- R01 HL077398/HL/NHLBI NIH HHS/United States
- U01 HG004423/HG/NHGRI NIH HHS/United States
- U10 HL054496/HL/NHLBI NIH HHS/United States
- U01 HG004798/HG/NHGRI NIH HHS/United States
- R01 CA049449/CA/NCI NIH HHS/United States
- HL54509/HL/NHLBI NIH HHS/United States
- HHSN268201100002I/HL/NHLBI NIH HHS/United States
- R01 HL157635/HL/NHLBI NIH HHS/United States
- U01HL130114/HL/NHLBI NIH HHS/United States
- N01 HC095166/HL/NHLBI NIH HHS/United States
- HHSN268201700002I/HL/NHLBI NIH HHS/United States
- R01HL117078/HL/NHLBI NIH HHS/United States
- HHSN268201800010I/HB/NHLBI NIH HHS/United States
- HHSN268201700005I/HL/NHLBI NIH HHS/United States
- 263 MD 9164/MD/NIMHD NIH HHS/United States
- UL1 TR002243/TR/NCATS NIH HHS/United States
- R01-HL088457/HL/NHLBI NIH HHS/United States
- R01-HG003054/HG/NHGRI NIH HHS/United States
- U10 HL054471/HL/NHLBI NIH HHS/United States
- AA13326/AA/NIAAA NIH HHS/United States
- R01 CA080122/CA/NCI NIH HHS/United States
- N01 HC095162/HL/NHLBI NIH HHS/United States
- U01 HG006379/HG/NHGRI NIH HHS/United States
- 75N92020D00006/HL/NHLBI NIH HHS/United States
- R01 HL117078/HL/NHLBI NIH HHS/United States
- DA12854/DA/NIDA NIH HHS/United States
- EY014684-04S1/EY/NEI NIH HHS/United States
- R01 HL095056/HL/NHLBI NIH HHS/United States
- R01 HL087641/HL/NHLBI NIH HHS/United States
- R01 AG023629/AG/NIA NIH HHS/United States
- U01 HL054512/HL/NHLBI NIH HHS/United States
- U01 HG008664/HG/NHGRI NIH HHS/United States
- HHSN268201800011I/HB/NHLBI NIH HHS/United States
- HHSN268201800005I/HL/NHLBI NIH HHS/United States
- UM1 CA182910/CA/NCI NIH HHS/United States
- T32 HL007055/HL/NHLBI NIH HHS/United States
- RC2GM092618/GM/NIGMS NIH HHS/United States
- HL085144/HL/NHLBI NIH HHS/United States
- N01 HC095165/HL/NHLBI NIH HHS/United States
- CA047988/CA/NCI NIH HHS/United States
- AA15416/AA/NIAAA NIH HHS/United States
- R37 DA005147/DA/NIDA NIH HHS/United States
- UL1 TR001881/TR/NCATS NIH HHS/United States
- R01 CA092579/CA/NCI NIH HHS/United States
- R01 CA55069/CA/NCI NIH HHS/United States
- 202802/Z/16/Z/WT_/Wellcome Trust/United Kingdom
- R01 NS45012/NS/NINDS NIH HHS/United States
- HG011052/HG/NHGRI NIH HHS/United States
- N01 HC095164/HL/NHLBI NIH HHS/United States
- RG/17/1/32663/BHF_/British Heart Foundation/United Kingdom
- DK093757/DK/NIDDK NIH HHS/United States
- HHSN268201800006I/HL/NHLBI NIH HHS/United States
- U01 HL054495/HL/NHLBI NIH HHS/United States
- U01 CA164973/CA/NCI NIH HHS/United States
- MR/S019669/1/MRC_/Medical Research Council/United Kingdom
- R37 CA054281/CA/NCI NIH HHS/United States
- 75N92021D00004/WH/WHI NIH HHS/United States
- HHSN268201100001C/WH/WHI NIH HHS/United States
- N01 HC065237/HL/NHLBI NIH HHS/United States
- UM1 CA182883/CA/NCI NIH HHS/United States
- HHSN268201700003I/HL/NHLBI NIH HHS/United States
- U01AG023712/AG/NIA NIH HHS/United States
- CA164973/CA/NCI NIH HHS/United States
- R01 HG010297/HG/NHGRI NIH HHS/United States
- HHSN271201200022C/DA/NIDA NIH HHS/United States
- HHSN268201200008I/HL/NHLBI NIH HHS/United States
- N01 HC085081/HL/NHLBI NIH HHS/United States
- HHSN268201100004C/WH/WHI NIH HHS/United States
- N01-AG-6-2101/AG/NIA NIH HHS/United States
- R01-DK075787/DK/NIDDK NIH HHS/United States
- K07 AG061256/AG/NIA NIH HHS/United States
- U01HG008679/HG/NHGRI NIH HHS/United States
- R01AG034454/AG/NIA NIH HHS/United States
- R01 CA141298/CA/NCI NIH HHS/United States
- R01 HL149683/HL/NHLBI NIH HHS/United States
- U01 HL054473/HL/NHLBI NIH HHS/United States
- R01 AG015819/AG/NIA NIH HHS/United States
- R01-NS100178/NS/NINDS NIH HHS/United States
- R01 DK078150/DK/NIDDK NIH HHS/United States
- R01 DA044283/DA/NIDA NIH HHS/United States
- P01CA055075/CA/NCI NIH HHS/United States
- R01CA128813/CA/NCI NIH HHS/United States
- U01 HG008701/HG/NHGRI NIH HHS/United States
- DK078150/DK/NIDDK NIH HHS/United States
- UL1-TR-000040/TR/NCATS NIH HHS/United States
- R01HL086694/HL/NHLBI NIH HHS/United States
- R01 AG056477/AG/NIA NIH HHS/United States
- UM1 CA182876/CA/NCI NIH HHS/United States
- U01HG008676/HG/NHGRI NIH HHS/United States
- N01 HC095160/HL/NHLBI NIH HHS/United States
- R01 AA013320/AA/NIAAA NIH HHS/United States
- K08 HG010155/HG/NHGRI NIH HHS/United States
- K01 HL135405/HL/NHLBI NIH HHS/United States
- MC_PC_13049/MRC_/Medical Research Council/United Kingdom
- R01-HL-55005/HL/NHLBI NIH HHS/United States
- R01 HL77398/HL/NHLBI NIH HHS/United States
- N01-HC-95169/HL/NHLBI NIH HHS/United States
- N01-HC-95161/HL/NHLBI NIH HHS/United States
- R37 AA012502/AA/NIAAA NIH HHS/United States
- HL080467/HL/NHLBI NIH HHS/United States
- R01 DK122503/DK/NIDDK NIH HHS/United States
- MH081802/MH/NIMH NIH HHS/United States
