. 2022 Oct;610(7931):319-326.
doi: 10.1038/s41586-022-05277-w. Epub 2022 Oct 12.

Maturation and circuit integration of transplanted human cortical organoids

Affiliations

Maturation and circuit integration of transplanted human cortical organoids

Omer Revah et al. Nature. 2022 Oct.

Abstract

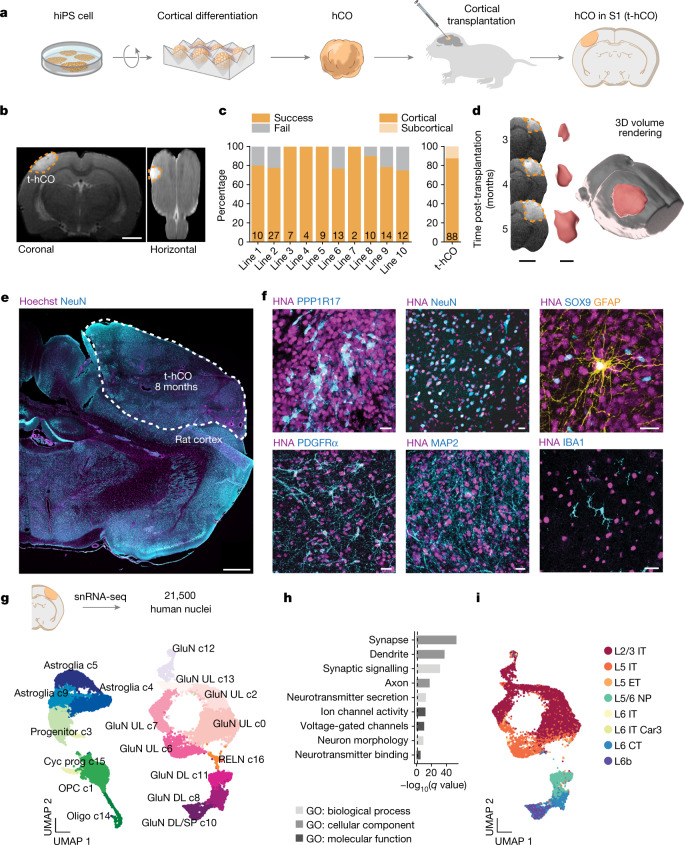
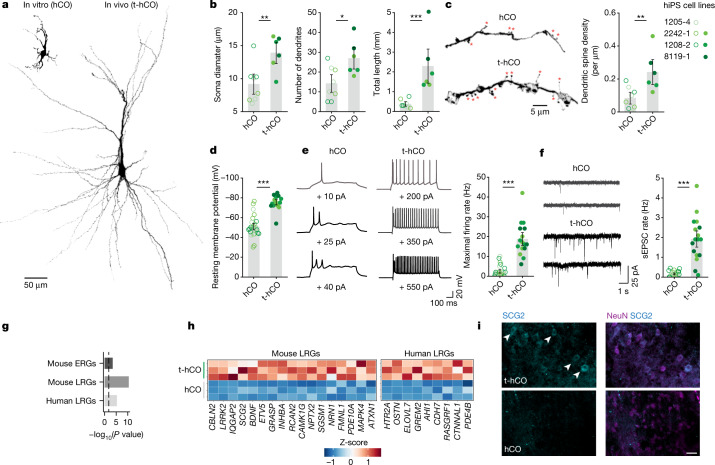
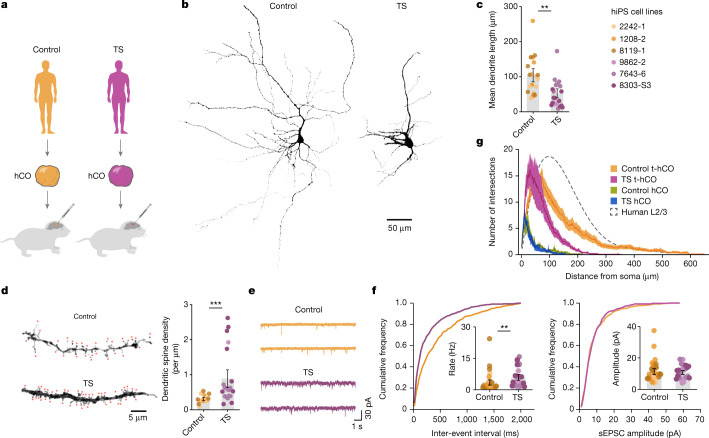
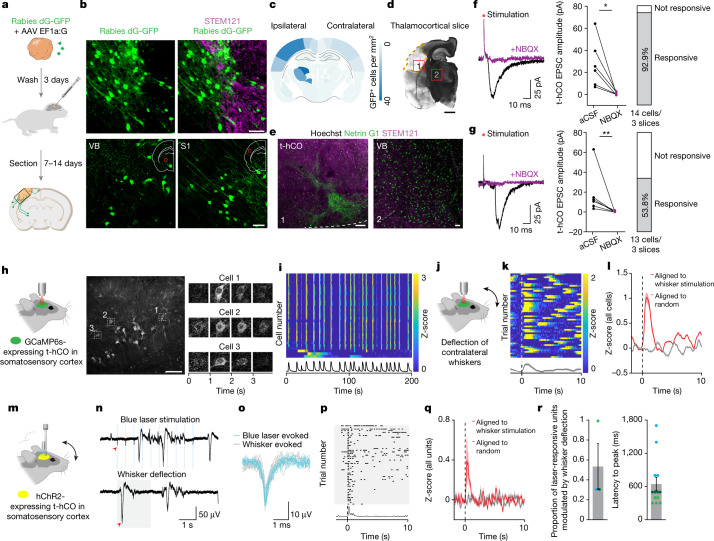
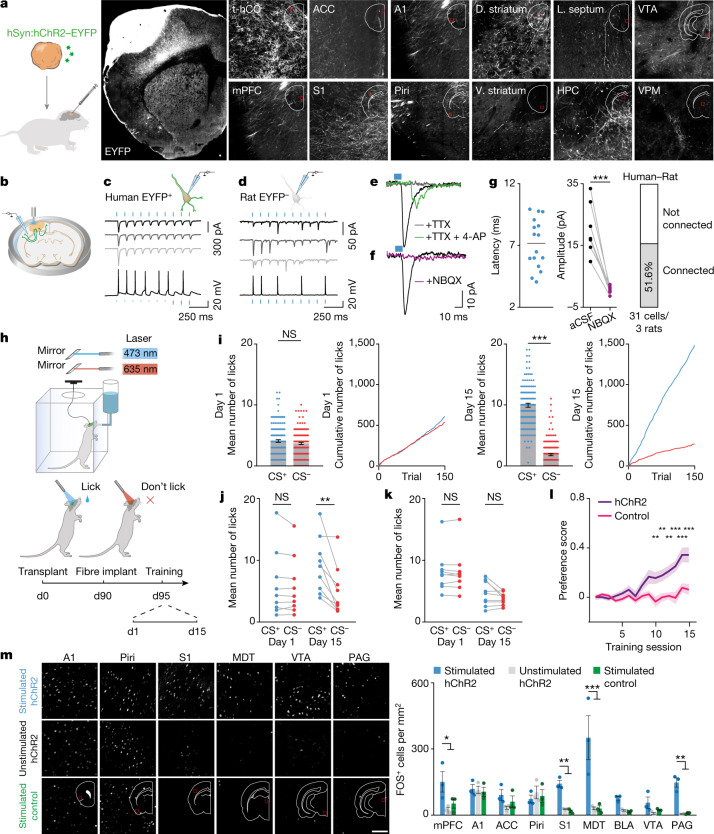
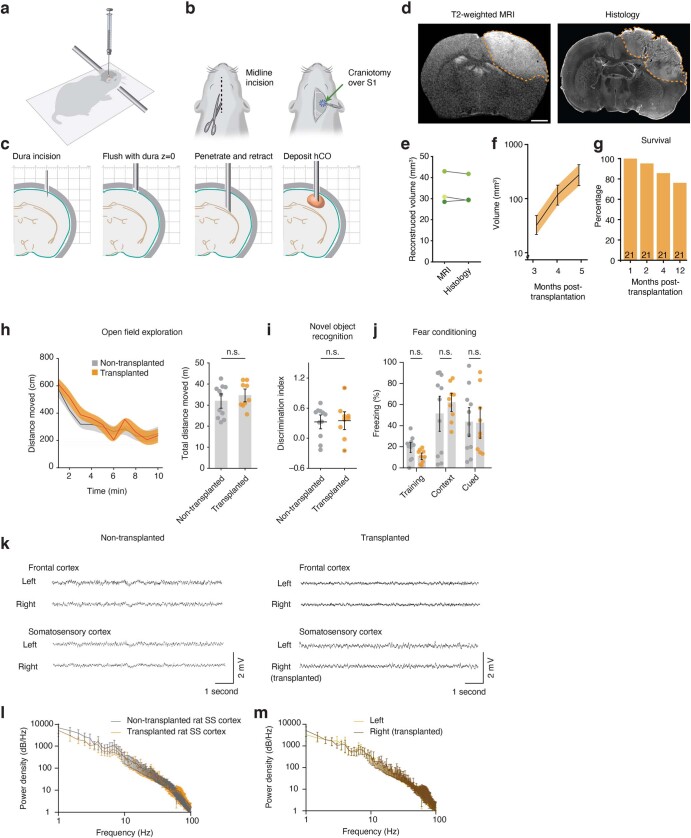
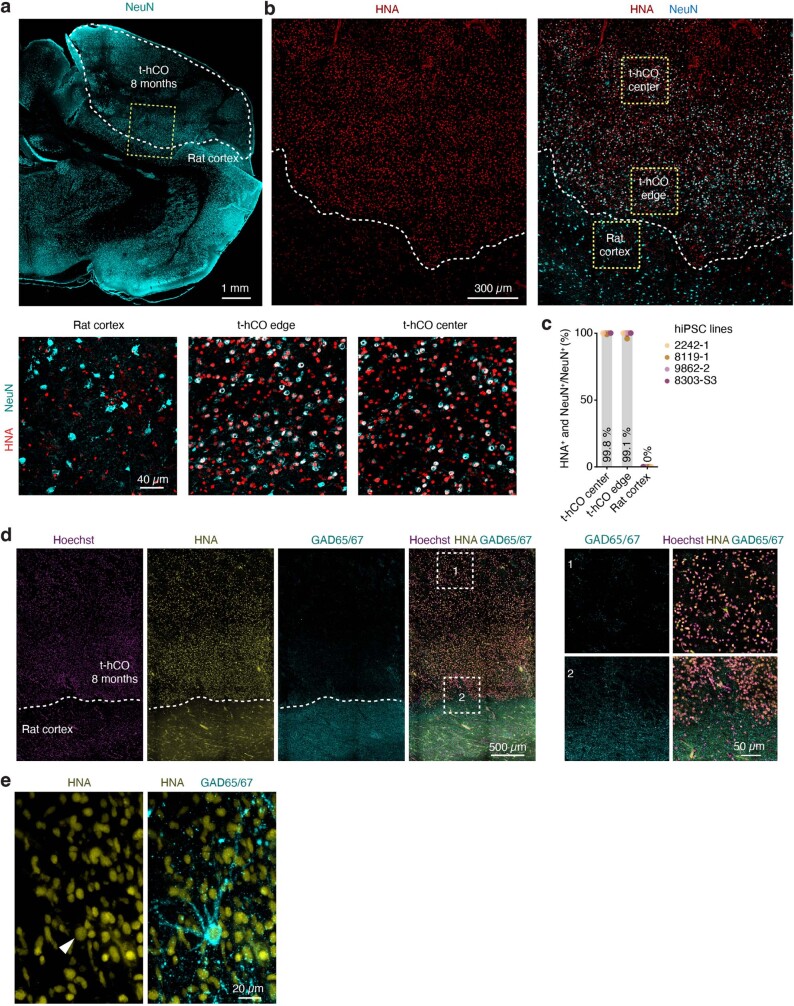
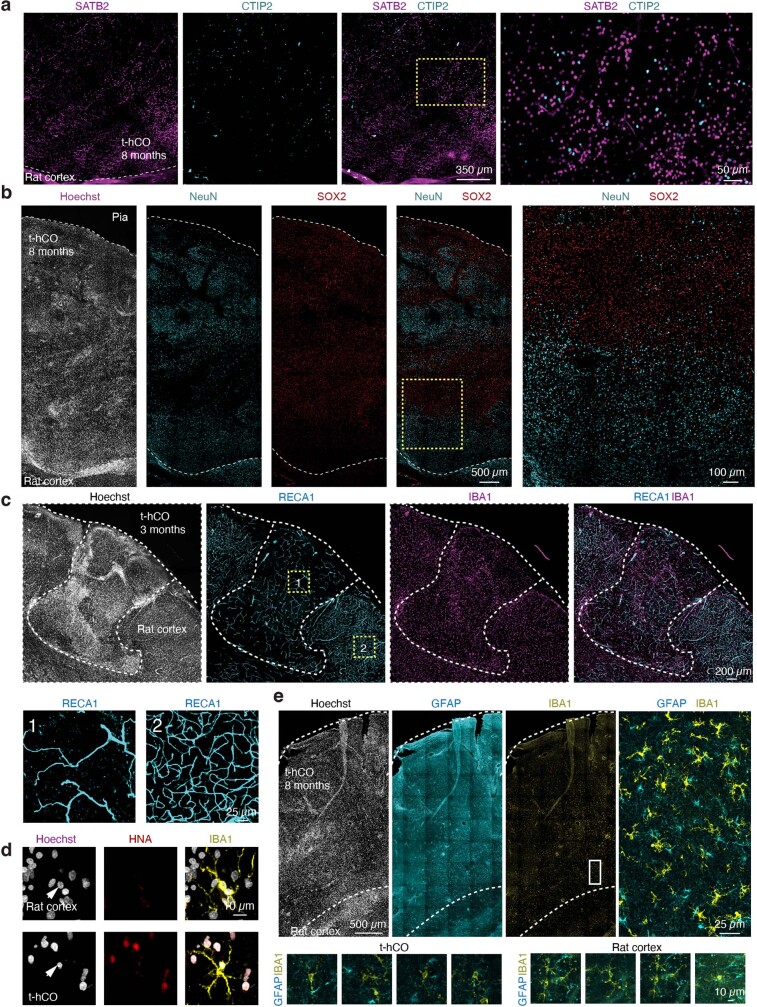
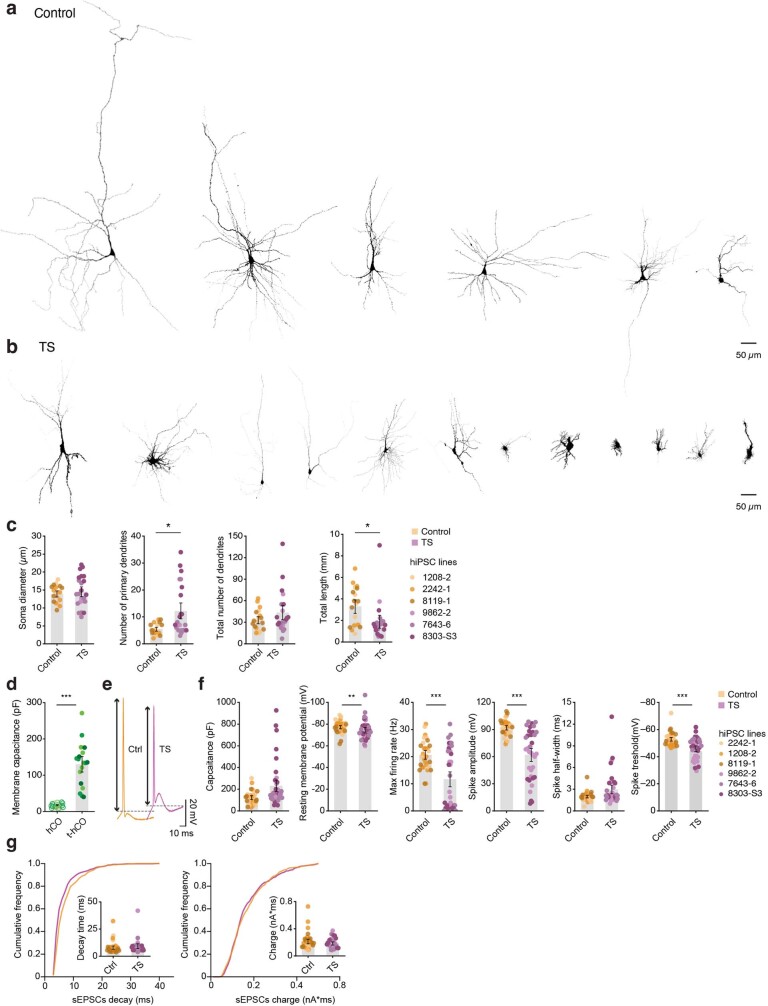
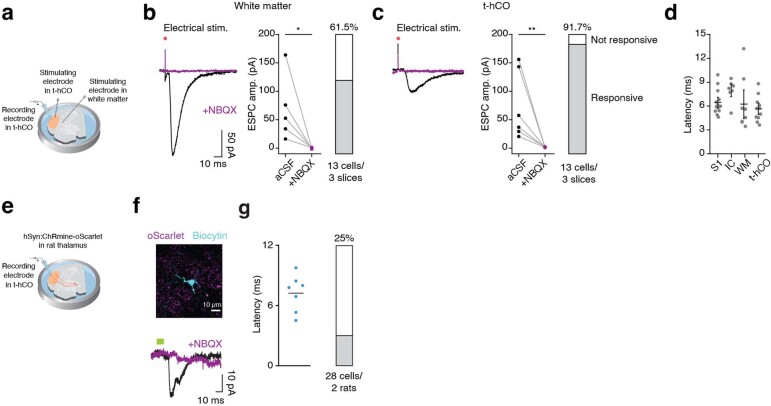
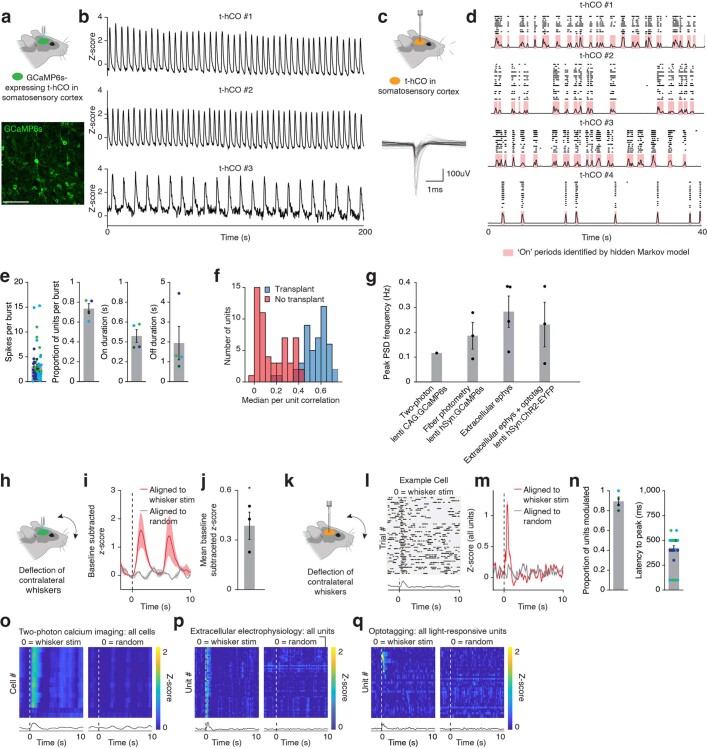
Self-organizing neural organoids represent a promising in vitro platform with which to model human development and disease1-5. However, organoids lack the connectivity that exists in vivo, which limits maturation and makes integration with other circuits that control behaviour impossible. Here we show that human stem cell-derived cortical organoids transplanted into the somatosensory cortex of newborn athymic rats develop mature cell types that integrate into sensory and motivation-related circuits. MRI reveals post-transplantation organoid growth across multiple stem cell lines and animals, whereas single-nucleus profiling shows progression of corticogenesis and the emergence of activity-dependent transcriptional programs. Indeed, transplanted cortical neurons display more complex morphological, synaptic and intrinsic membrane properties than their in vitro counterparts, which enables the discovery of defects in neurons derived from individuals with Timothy syndrome. Anatomical and functional tracings show that transplanted organoids receive thalamocortical and corticocortical inputs, and in vivo recordings of neural activity demonstrate that these inputs can produce sensory responses in human cells. Finally, cortical organoids extend axons throughout the rat brain and their optogenetic activation can drive reward-seeking behaviour. Thus, transplanted human cortical neurons mature and engage host circuits that control behaviour. We anticipate that this approach will be useful for detecting circuit-level phenotypes in patient-derived cells that cannot otherwise be uncovered.


Conflict of interest statement

Stanford University holds patents for the generation of cortical organoids/spheroids (listing S.P.P. as an inventor) and a provisional patent application for transplantation of organoids (listing S.P.P., O.R., F.G., K.D. and K.W.K. as inventors).

Figures

Fig. 1
Fig. 1. Transplantation of human cortical organoids in the developing rat cortex.
a, Schematic of the experimental design. hCO generated from hiPS cells are transplanted at days 30–60 of differentiation into the S1 of newborn athymic rats. b, Coronal and horizontal view T2-weighted MRI images showing t-hCO in the S1 at 2 months post-transplantation. Scale bar, 2 mm. c, Quantification of the success rate of transplantations shown per hiPS cell line (n = 108, numbers inside bars indicate number of t-hCO per hIPS cell line) and cortical or subcortical position (n = 88). d, Coronal MRI images (left; scale bar, 3 mm) and corresponding 3D volume reconstructions (scale bar, 3 mm) showing t-hCO growth over 3 months. e, Overview of example t-hCOs in the rat cortex. Scale bar, 1 mm. f, Representative immunocytochemistry images of t-hCO showing from top left to right (at time in differentiation): PPP1R17 (4 months), NeuN (8 months), SOX9 and GFAP (8 months), PDGFRα; (8 months), MAP2 (8 months) and IBA1 (8 months). Scale bars, 20 μm. Co-expression of HNA indicates cells of human origin. g, snRNA-seq: uniform manifold approximation and projection (UMAP) dimensional reduction visualization of all clustered high-quality t-hCO nuclei after Seurat integration (n = 3 t-hCO samples, n = 2 hiPS cell lines). Astroglia, astrocyte lineage cells; cyc prog, cycling progenitor; GluN DL, deep layer glutamatergic neuron; GluN DL/SP, deep layer and subplate glutamatergic neuron; GluN UL, upper layer glutamatergic neuron; oligo, oligodendrocyte; OPC, oligodendrocyte progenitor cell; RELN, reelin neurons. h, Gene Ontology (GO) term enrichment analysis of genes significantly upregulated (adjusted P < 0.05, fold change > 2, expressed in at least 10% of nuclei) in t-hCO glutamatergic neurons compared with hCO glutamatergic neurons. The dashed line denotes a q value of 0.05. i, UMAP visualization of GluN cell types of t-hCO using label transfer from the adult human motor cortex snRNA-seq reference dataset. CT, corticothalamic cell; ET, extratelencephalic cell; IT, intratelencephalic cell; NP, near-projecting.
Fig. 2
Fig. 2. t-hCO neurons undergo advanced maturation.
a, 3D reconstruction of biocytin-filled hCO and t-hCO neurons at 8 months of differentiation. b, Quantification of morphological features (n = 8 hCO neurons, n = 6 t-hCO neurons; **P = 0.0084, *P = 0.0179 and ***P < 0.0001). c, 3D-reconstructed dendritic branches of hCO and t-hCO at 8 months of differentiation. The red asterisks indicate putative dendritic spines. Quantification of dendritic spine density (n = 8 hCO neurons, n = 6 t-hCO neurons; **P = 0.0092). d, Quantification of the resting membrane potential (n = 25 hCO neurons, n = 16 t-hCO neurons; ***P < 0.0001). e, Repetitive action potential firing in hCO and t-hCO induced by increasing current injections, and quantification of the maximal firing rate (n = 25 hCO neurons, n = 16 t-hCO neurons; ***P < 0.0001). f, Spontaneous EPSCs (sEPSCs) in hCO and t-hCO neurons at 8 months of differentiation, and quantification of the frequency of synaptic events (n = 25 hCO neurons, n = 17 t-hCO neurons; ***P < 0.0001). For bf, hCO and t-hCO from line 1208-2 are taken from the same differentiation batch maintained in parallel. g, Gene set enrichment analysis (one-sided Fisher’s exact test) of genes significantly upregulated (adjusted P < 0.05, fold change > 2, expressed in at least 10% of nuclei) in t-hCO glutamatergic neurons compared with hCO glutamatergic neurons with gene sets of both early-response (ERG) and late-response (LRG) activity-dependent genes identified from an in vivo mouse study and human-specific LRGs from in vitro neurons. The dashed line denotes Bonferroni-corrected P value of 0.05. h, GluN gene expression (pseudobulk and scaled for each gene) across snRNA-seq replicates of LRG genes significantly upregulated in t-hCO glutamatergic neurons. i, Immunostaining showing SCG2 expression in t-hCO (top) and hCO (bottom) neurons. White arrowheads indicate SCG2+ cells. Scale bar, 25 µm. Data are presented as mean ± s.e.m.
Fig. 3
Fig. 3. Advanced neuronal features in t-hCO reveal activity-dependent disease phenotypes in human cortical neurons.
a, Transplantation of hCO generated from control and TS hiPS cell lines into newborn rats. b, 3D reconstruction of biocytin-filled t-hCO neurons at 8 months of differentiation. c, Quantification of mean dendrite length (n = 19 control neurons, n = 21 TS neurons; **P = 0.0041). d, 3D-reconstructed dendritic branches from control and TS t-hCO at 8 months of differentiation, and quantification of dendritic spine density (n = 16 control neurons, n = 21 TS neurons, ***P < 0.0001). Red asterisks indicate putative dendritic spines. e, Spontaneous EPSCs in control and TS t-hCO neurons at 8 months of differentiation. f, Cumulative frequency plots and quantification of synaptic event frequency and amplitude (n = 32 control neurons, n = 26 TS neurons; **P = 0.0076 and P = 0.8102). g, Sholl analysis of TS and control neurons in hCO and t-hCO. The dashed line shows postnatal human L2/3 pyramidal neurons for comparison (n = 24 control t-hCO neurons, n = 21 TS t-hCO neurons, n = 8 control hCO neurons and n = 7 TS hCO neurons). Data are presented as mean ± s.e.m.
Fig. 4
Fig. 4. Transplanted hCO receive sensory-related inputs.
a, Schematic of the rabies-tracing experiment. b, GFP and human-specific STEM121 expression between t-hCO and the rat cortex (top). GFP expression in the rat ipsilateral ventrobasal (VB) nucleus (bottom left) and the ipsilateral S1 (bottom right) is also shown. Scale bars, 50 μm. Red squares indicate the region of the brain from which the image is taken. c, Quantification of GFP-expressing cells (n = 4 rats). d,e, Netrin G1+ thalamic terminals in t-hCO. In d, a coronal section containing t-hCO and the VB nucleus is shown. Scale bar, 2 mm. In e, Netrin G1 expression and STEM121 expression in t-hCO (left) and VB neurons (right) are shown. Scale bars, 50 µm. Orange dashed line indicates border of t-hCO. f,g, Current traces from t-hCO neurons following electrical stimulation in the rat S1 (f) or the internal capsule (g), with (purple) or without (black) NBQX (left). EPSC amplitude with or without NBQX (n = 6 S1 neurons, *P = 0.0119; and n = 6 internal capsule neurons, **P = 0.0022) (middle). Percentage of t-hCO neurons that displayed EPSCs in response to electrical stimulation of the rat S1 (f) or internal capsule (g) (right). aCSF, artificial cerebrospinal fluid. h, Schematic of the 2P-imaging experiment (left). GCaMP6s expression in t-hCO (middle). Scale bar, 100 μm. Timelapse of GCaMP6s fluorescence (right). i, Z-scored fluorescence of spontaneous activity. j, Schematic of whisker stimulation. k, Single-trial z-scored 2P fluorescence traces aligned to whisker deflection at time zero (dashed line) in an example cell. l, Population-averaged z-scored responses of all cells aligned to whisker deflection at time zero (dashed line) (red) or randomly generated timestamps (grey). m, Schematic of the optotagging experiment. n, Raw voltage traces from an example t-hCO unit during blue laser stimulation or whisker deflection. The red arrowheads indicate the first light-evoked (top) or whisker deflection-evoked (bottom) spike. Grey shading indicates period of whisker deflection. o, Spike waveforms of light and whisker deflection responses. p, Single-trial spiking aligned to whisker deflection in an example cell. 0 indicates whisker deflection (dashed line). q, Population-averaged z-scored firing rates of all light-responsive units aligned to whisker deflection at time zero (dashed line) (red) or randomly generated timestamps (grey). r, Proportion of light-responsive units significantly modulated by whisker deflection (n = 3 rats) (left). Latency to peak z-score (n = 3 rats; n = 5 (light green), n = 4 (dark green) and n = 4 (cyan) whisker deflection-modulated units per rat) (right). Data are presented as mean ± s.e.m.
Fig. 5
Fig. 5. Transplanted hCO make functional connections onto rat neurons and modulate behaviour.
a, Schematic of axon tracing (left). t-hCO EYFP expression (right). Scale bar, 100 μm. A1, auditory cortex; ACC, anterior cingulate cortex; d. striatum, dorsal striatum; HPC, hippocampus; l. septum, lateral septum; mPFC, medial prefrontal cortex; piri, piriform cortex; v. striatum, ventral striatum; VPM, ventral posteromedial nucleus of thalamus; VTA, ventral tegmental area. Red squares indicate the region of the brain from which the image is taken. b, Schematic of the stimulation experiment. c,d, Example blue light-evoked photocurrents (top) and voltage responses (bottom) in human EYFP+ t-hCO (c) or rat EYFP cells (d). e,f, Current traces from rat neurons following blue light stimulation of t-hCO axons with TTX and 4-AP (green), TTX (grey) or in aCSF (black) (e), or with (purple) or without (black) NBQX (f). g, Latency of blue light-evoked responses in rat cells (n = 16 cells); horizontal bar indicates mean latency (7.13 ms) (left). Amplitude of light-evoked EPSCs recorded with or without NBQX (n = 7 cells; ***P < 0.0001) (middle). Percentage of rat cells that demonstrated EPSCs in response to blue light (right). h, Schematic of the behavioural task. d0, day 0. i, Performance of an example animal on day 1 (left) or day 15 (right) of training. The mean number of licks performed on day 1 (left) or day 15 (right centre) (n = 150 blue light trials, n = 150 red light trials; ***P < 0.0001). Cumulative lick count across red and blue light trials on day 1 (left centre) or day 15 (right). NS, not significant. j,k, Behavioural performance of all animals transplanted with t-hCO expressing hChR2–EYFP (j) or control fluorophore (k) on day 1 or day 15 (hChR2–EYFP: n = 9 rats, **P = 0.0049; control: n = 9, P = 0.1497). l, Evolution of preference score (n = 9 hChR2, n = 9 control; **P < 0.001, ***P < 0.0001). m, FOS expression in response to optogenetic activation of t-hCO in the S1. Images of FOS expression (left), and quantification (n = 3 per group; *P < 0.05, **P < 0.01 and ***P < 0.001) (right) are shown. Scale bar, 100 μm. Data are presented as mean ± s.e.m. BLA, basolateral amygdala; MDT, mediodorsal nucleus of the thalamus; PAG, periaqueductal grey.
Extended Data Fig. 1
Extended Data Fig. 1. Schematic of the transplantation procedure and effects on animal behaviour.
a–c. Schematics of surgical approach. d. Left, t-hCO visualized with T2-weighted MRI. Right, t-hCO visualized with DAPI. e. Reconstructed volumes of the same t-hCO calculated from MRI or histological slices (n = 3, P = 0.9160 t-hCO). f. Quantification of MRI volume reconstruction over time (n = 6 t-hCO, *P = 0.0239). g. Quantification of survival in transplanted animals over time. h–j. Animals transplanted with t-hCO do not show behavioral deficits or seizures. h. Distance traveled in open field arena by transplanted (orange) or non-transplanted control animals (grey) for each minute of a 10-minute testing session (left) and across the entire 10-minute testing period (right) (n = 11 non-transplanted control rats, 9 transplanted rats, P = 0.4082). i. Discrimination index ((time spent interacting with novel object - time spent interacting with familiar object)/(time spent interacting with novel object + time spent interacting with familiar object)) during novel object test calculated for transplanted (orange) or non-transplanted control animals (grey) (n = 11 non-transplanted control rats, 9 transplanted rats, P = 0.8756). j. Freezing behaviour during fear conditioning training, contextual fear memory test, and cued fear memory test for transplanted (orange) or non-transplanted control animals (grey) (n = 11 non-transplanted control rats, 9 transplanted rats, P = 0.9599). k. Representative EEG recordings from the frontal and somatosensory cortices of non-transplanted (left) and transplanted (right) rats. l. Power spectral density plots of EEG activity recorded in the somatosensory cortex of non-transplanted control and transplanted rats (n = 3 transplanted rats, 3 non-transplanted rats). m. Power spectral density plots of somatosensory cortex EEG activity recorded simultaneously in the non-transplanted and transplanted hemisphere of individual rats (n = 3 transplanted rats). Data are presented as mean ± SEM.
Extended Data Fig. 2
Extended Data Fig. 2. Immunohistochemical characterization of t-hCO.
a–b. NeuN expression in t-hCO and the surrounding rat brain. c. Quantification of the overlap of HNA and NeuN expression in t-hCO and rat cortex (n = 5 t-hCO from 4 hiPS lines, 1–2 t-hCO per line). d. Representative images of GAD65/67 expression in t-hCO-rat cortex border. e. Example image of a rarely observed HNA+GAD65/67+ neuron in t-hCO. All images were acquired 8 months after transplantation unless otherwise stated.
Extended Data Fig. 3
Extended Data Fig. 3. Immunohistochemical characterization of t-hCO continued.
a. Representative images of SATB2 and CTIP2 expression in t-hCO. b. Example images of SOX2 and NeuN expression in t-hCO. c. Representative images of rat-edothelial-marker-1 (RECA1) and IBA1 expression in t-hCO and nearby rat cortex 3 months after transplantation. d. HNA and IBA1 expression in t-hCO. Absence of overlap between HNA and IBA1 suggests microglia originate from rat. e. GFAP and IBA1 expression in t-hCO and rat cortex. All images were acquired 7–9 months in differentiation unless otherwise stated.
Extended Data Fig. 4
Extended Data Fig. 4. Data quality of single nucleus RNA-seq samples and hCO analysis.
a. The number of snRNA-seq read counts aligned to rat and human genome for each nucleus split by sample. Human nuclei were defined as nuclei with >95% of total reads aligning to the human genome. b. snRNA-seq quality metrics showing the distribution of the number of counts, number of genes, and mitochondrial (MT) gene fraction per cell in each sample. MT gene fraction plotted as boxplots (horizontal line denotes median; lower and upper hinges correspond to the first and third quartiles; whiskers extend 1.5 times the interquartile range with outliers shown outside this range). Lines denote nuclei quality thresholds. c. Gene expression violin plots for selected marker genes in t-hCO. d. Same integrated UMAP as shown in Fig. 1g, colored by t-hCO sample. e. Cell type proportions across t-hCO samples colored by clusters. f. UMAP dimensional reduction visualization of all clustered high-quality hCO nuclei after Seurat integration (n = 3 t-hCO samples from 3 hiPS lines). g. Gene expression violin plots for selected marker genes. h. Same integrated UMAP as shown in panel f, colored by hCO sample. i. Cell type proportions across hCO samples colored by clusters. hCO and t-hCO from 2242-1 at day 227 are taken from the same differentiation batch maintained in parallel. Cyc. prog., cycling progenitor; Astroglia, astrocyte lineage cell; IPC, intermediate progenitor cell; GluN_UL, upper layer glutamatergic neuron; GluN_DL, deep layer glutamatergic neuron; GluN_DL/SP, deep layer and subplate glutamatergic neurons; RELN, Reelin neurons; IN, GABAergic neurons; Choroid, choroid plexus-like cells; Mening., meningeal-like cells.
Extended Data Fig. 5
Extended Data Fig. 5. Transplanted hCO RNA-seq comparisons to fetal and adult human cortex.
a. Left: The first principal component (PC1) calculated on gene expression (log base 2 RPKM, reads per kilobase of exon per million reads mapped) from human cortical BrainSpan samples and pseudobulk (Methods) snRNA-seq samples using previously defined developmentally regulated genes. Right: PC1 values for t-hCO and hCO samples. b. The sample weights (Methods) of five neurodevelopmental transcriptomic signatures identified by Zhu et al. across human cortical BrainSpan samples. Dashed lines denote fitted curves by LOESS regression. c. Gene set enrichment analysis (one-sided Fisher’s exact test) using the top 200 genes from each neurodevelopmental signature with significantly up-regulated (adjusted P-value < 0.05) t-hCO genes from pseudobulk GluN clusters (neurogenesis, neuronal differentiation, and synaptogenesis signatures), Astroglia clusters (astrogenesis signature), and from pseudobulk of all clusters (myelination-related signature). Line denotes Bonferroni corrected P-value of 0.05. d. Gene expression (pseudobulk and scaled) of the top 50 significantly upregulated t-hCO genes (ranked by differential expression p-value significance) for each signature. e–f. Heat maps of t-hCO (e) and hCO (f) cluster overlap by RNA-seq integration with primary human fetal cortical cell clusters,. Cell cluster labels are from original studies. RG, radial glia; Cyc.prog, cycling progenitors; tRG, truncated radial glia, mGPC, multipotent glial progenitor cell; OPC/Oligo, oligodendrocyte progenitor cell/oligodendrocyte; nIPC, neuronal intermediate progenitor cell; GluN, glutamatergic neuron; CGE IN, caudal ganglionic eminence interneuron; MGE IN, medial ganglionic eminence interneuron; EC, endothelial cell; MG, microglia; Peric., Pericytes; PgG2M and PgS, cycling progenitors; IP, intermediate progenitor; oRG, outer radial glia; End, endothelial cell; Per, pericyte; vRG, ventricular radial glia; ExM, maturing excitatory neuron; ExN, excitatory neuron; ExM.U, maturing upper layer excitatory neuron; ExDp, excitatory deep layer neuron; In, interneuron. g–h. UMAP visualization of GluN cell type classification of t-hCO (g) and hCO (h) using label transfer (methods) from adult human cortical single nuclei RNA-seq reference datasets. Transfer labels from dissected cortical layers of medial temporal gyrus (MTG) shown in g and to the left in h. Right (h): transfer labels from annotated GluN subclasses from motor cortex (M1). I–j. Heat maps of t-hCO (i) and hCO (j) cluster overlap by RNA-seq integration with primary human adult cortical cell clusters,. Cell cluster labels are from original studies. Exc, excitatory neuron; Inh, inhibitory neuron; Astro, astrocyte; Endo, endothelial cells; CT, corticothalamic cell; ET, extratelencephalic cell; IT, intratelencephalic cell; micro, microglia; NP, near-projecting; oligo, oligodendrocyte; OPC, oligodendrocyte precursor; PVM, perivascular macrophage; VLMC, vascular and leptomeningeal cells.
Extended Data Fig. 6
Extended Data Fig. 6. Electrophysiological and morphological properties of glutamatergic hCO neurons.
a. Example 3D-reconstruction of biocytin-filled Camk2α:eYFP-expressing hCO neurons at 8 months. b. Morphological properties of 3D reconstructed Camk2α+ hCO neurons (n = 8). c. Electrophysiological properties of Camk2α+ hCO neurons (n = 16 neurons). Data are presented as mean ± SEM.
Extended Data Fig. 7
Extended Data Fig. 7. Electrophysiological and morphological properties of cortical neurons from postnatal human cerebral cortex.
a. Schematics showing the location of resected specimens and recording conditions. b. 3D-reconstruction of biocytin-filled human L2/3 pyramidal neurons. c. Quantification of the soma diameter, number of primary branches, total number of dendrites, total length and spine density (n = 12 L2/3 neurons from 2 specimens). d. Sholl analysis comparison of the dendritic complexity of L2/3 neurons (n = 7 L2/3 neurons from sample 1 and n = 8 neurons from sample 2). e. Quantification of membrane capacitance, resting membrane potential, maximal firing rate, spike amplitude, spike half-width and spike threshold of L2/3 pyramidal neurons (n = 22 L2/3 neurons from 2 specimens). Dotted lines show t-hCO for comparison. Data are presented as mean ± SEM.
Extended Data Fig. 8
Extended Data Fig. 8. Morphological and electrophysiological properties of control and TS t-hCO neurons.
a–c. Morphological properties of control and TS t-hCO neurons. a–b. Examples of 3D-reconstructed t-hCO neurons derived from control Line identities of filled cells from left to right, Control: 1208-2; 2242-1; 8119-1; 2242-1; 2242-1; 1208-2; and TS: 8303-S3; 8303-S3; 7643-6; 7643-6; 9862-2; 8303-S3; 8303-S3; 8303-S3; 8303-S3; 9862-2; 8303-S3; 7643-6. c. Quantification of the soma diameter, number of primary branches, total number of dendrites and total length (control: n = 19 neurons, TS: n = 23 neurons, P = 0.592, *P = 0.025; control: n = 19 neurons, TS: n = 21 neurons P = 0.7627, * P = 0.0112). d. Comparison of membrane capacitance in hCO and t-hCO (hCO: n = 25 neurons, t-hCO: n = 18 neurons, ***P < 0.0001). e–g. Electrophysiological properties of control and TS t-hCO neurons. e. Example traces of a single AP firing in control and TS t-hCO neurons, showing differences in AP height (black arrows) and threshold (gray dashed line). f. Comparison of electrophysiological properties in control and TS t-hCO neurons; membrane capacitance (Control: n = 30 neurons, TS: n = 36 neurons, P = 0.0848), resting membrane potential (Control: n = 31 neurons, TS: n = 33 neurons, **P < 0.0044), maximal firing rate (Control: n = 29 neurons, TS: n = 36 neurons, ***P < 0.0001), spike amplitude (Control: n = 31 neurons, TS: n = 35 neurons, ***P < 0.0001), spike half-width (Control: n = 31 neurons, TS: n = 34 neurons, P = 0.0984) and spike threshold (Control: n = 31 neurons, TS: n = 34 neurons, ***P < 0.0001). g. Cumulative frequency plots and quantification of spontaneous EPSCs decay time and charge (Control: n = 32 neurons; TS: n = 26 neurons, P = 0.0744, P = 0.4812). Data are presented as mean ± SEM.
Extended Data Fig. 9
Extended Data Fig. 9. Electrophysiological characterization of inputs onto t-hCO.
a. Schematic of experimental preparation for electrically activating rat tissue while performing whole cell recordings from t-hCO neurons. b. Left, current traces from a representative t-hCO neuron following electrical stimulation in white matter with (purple) or without (black) NBQX. Middle, quantification of EPSC amplitude with or without NBQX (paired t-test, *P = 0.0295). Right, percentage of t-hCO neurons that displayed EPSCs in response to electrical stimulation in white matter. c. Left, Current traces from a representative t-hCO neuron following electrical stimulation of t-hCO with (purple) or without (black) NBQX. Middle, quantification of EPSC amplitude with or without NBQX (Wilcoxon test, **P = 0.0022). Right, percentage of t-hCO neurons that displayed EPSCs in response to electrical stimulation of t-hCO. d. Latency to EPSC in t-hCO neurons following electrical stimulation of somatosensory cortex (S1, n = 13 neurons), internal capsule (IC, n = 7 neurons), white matter (WM, n = 8 neurons), or t-hCO (n = 11 neurons). e. Schematic of experimental preparation for optogenetically activating rat thalamic terminals in t-hCO while performing whole cell recordings from t-hCO neurons. f. Top, example recorded t-hCO neuron. Bottom, current traces from a representative t-hCO neuron following optogenetic activation of rat thalamic terminals in t-hCO with (purple) or without (black) NBQX. g, Left, latency to EPSC in t-hCO neurons following optogenetic activation of rat thalamic terminals in t-hCO (n = 7 neurons, 2 animals). Right, percentage of t-hCO neurons that displayed EPSCs in response to optogenetic activation of rat thalamic terminals in t-hCO. Data are presented as mean ± SEM.
Extended Data Fig. 10
Extended Data Fig. 10. Characterization of t-hCO activity in vivo.
a–g. Characterization of spontaneous activity in t-hCO in vivo. a–c. Fiber photometry recordings of spontaneous t-hCO activity in vivo. a. Top, Schematic of experimental preparation. Bottom, representative image of GcaMP6s expression in t-hCO. Scale bar, 100 μm. b. Example z-scored fluorescence traces from awake recording of spontaneous activity. c–f. Extracellular recordings of spontaneous t-hCO activity in vivo. c. Top, Schematic of experimental preparation. Bottom, average waveforms of putative t-hCO units. d. Hidden Markov model used to identify ‘on’ and ‘off’ periods of population activity. Top, raster plot of spontaneous activity of simultaneously recorded units. Bottom, population averaged z-scored activity with ‘on’ states identified by Hidden Markov model overlaid in red. e. Quantification of spontaneous spiking activity. Left, number of spikes each unit contributed to each burst (n = 4 rats, 10 (dark green), 12 (light green), 19 (cyan), and 14 (blue) units per rat). Left center, proportion of recorded units that were engaged in each burst (n = 4 rats). Right center, ON period duration (n = 4 rats). Right, OFF period duration (n = 4 rats). f. Histogram of median correlations of each unit with all other simultaneously recorded units recorded in transplanted rats (putative human units, blue, n = 48 units from 4 rats) or non-transplanted rats (rat units, red, n = 56 units from 3 rats, P < 0.0001). g. Peak power spectral density frequency of spontaneous activity across all recording modalities used (two photon n = 1 rat, fiber photometry n = 3 rats, extracellular electrophysiology n = 4 rats, optotag n = 3 rats). h–q. Characterization of evoked activity in t-hCO in vivo. h–j. Fiber photometry recordings of t-hCO activity in response to whisker deflection. h. Schematic of experimental preparation for fiber photometry recording of t-hCO neurons in response to whisker deflection. i. Z-scored responses to whisker deflection at time zero (red) or randomly generated timestamps (grey) averaged across animals (n = 3 rats). j. Quantification of mean z-score following whisker stimulation compared to baseline (n = 3 rats, *P = 0.0430). k–n. Extracellular electrophysiological recordings of t-hCO activity in response to whisker deflection. k. Schematic of experimental preparation for extracellular electrophysiological recordings of t-hCO activity in response to whisker deflection. l. Single trial responses to whisker stimulation from a representative example single unit. Top, raster plot of single trial spiking activity aligned to whisker deflection. Bottom, trial-averaged z-scored firing rate. m. Population-averaged z-scored firing rates of all cells aligned to whisker deflection at time zero (red) or randomly generated timestamps (grey). n. Quantification of evoked spiking activity. Left, proportion of units significantly modulated by whisker deflection (n = 4 rats). Right, latency to peak z-score (n = 4 rats, n = 8 (dark green), 11 (light green), 12 (cyan), and 11 (blue) whisker deflection-modulated units per rat). o–q. Heatmaps of trial-averaged responses of all identified putative t-hCO cells across different recording modalities. o. Top, heatmap of trial-averaged z-scored fluorescence traces from all t-hCO cells recorded with two-photon calcium imaging aligned to whisker deflection (left) or randomly generated timestamps (right). Bottom, population-averaged z-scored fluorescence traces (n = 14 cells from 1 rat). p. Top, heatmap of trial-averaged z-scored firing rates from all t-hCO units recorded with extracellular electrophysiology aligned to whisker deflection (left) or randomly generated timestamps (right). Bottom, population-averaged z-scored firing rates (n = 42 units from 4 rats). q. Top, heatmap of trial-averaged z-scored firing rates from all opto-tagged t-hCO units recorded with extracellular electrophysiology aligned to whisker deflection (left) or randomly generated timestamps (right). Bottom, population-averaged z-scored firing rates (n = 31 units from 3 rats). Data are presented as mean ± SEM.

Comment in

Similar articles

Cited by

References

    1. Kelley, K. W. & Pașca, S. P. Human brain organogenesis: toward a cellular understanding of development and disease. Cell185, 42–61 (2021). 10.1016/j.cell.2021.10.003 - DOI - PubMed
    1. Pasca, A. M. et al. Functional cortical neurons and astrocytes from human pluripotent stem cells in 3D culture. Nat. Methods12, 671–678 (2015). 10.1038/nmeth.3415 - DOI - PMC - PubMed
    1. Valesco, S. et al. Individual brain organoids reproducibly form cell diversity of the human cerebral cortex. Nature570, 523–527 (2019). 10.1038/s41586-019-1289-x - DOI - PMC - PubMed
    1. Qian, X. et al. Brain-region-specific organoids using mini-bioreactors for modeling ZIKV exposure. Cell165, 1238–1254 (2016). 10.1016/j.cell.2016.04.032 - DOI - PMC - PubMed
    1. Yoon, S. J. et al. Reliability of human cortical organoid generation. Nat. Methods16, 75–78 (2019). 10.1038/s41592-018-0255-0 - DOI - PMC - PubMed

Supplementary concepts