

NSMCE2, a novel super-enhancer-regulated gene, is linked to poor prognosis and therapy resistance in breast cancer
- PMID: 36224576
- PMCID: PMC9555101
- DOI: 10.1186/s12885-022-10157-7
NSMCE2, a novel super-enhancer-regulated gene, is linked to poor prognosis and therapy resistance in breast cancer
Abstract
Background: Despite today's advances in the treatment of cancer, breast cancer-related mortality remains high, in part due to the lack of effective targeted therapies against breast tumor types that do not respond to standard treatments. Therefore, identifying additional breast cancer molecular targets is urgently needed. Super-enhancers are large regions of open chromatin involved in the overactivation of oncogenes. Thus, inhibition of super-enhancers has become a focus in clinical trials for its therapeutic potential. Here, we aimed to identify novel super-enhancer dysregulated genes highly associated with breast cancer patients' poor prognosis and negative response to treatment.
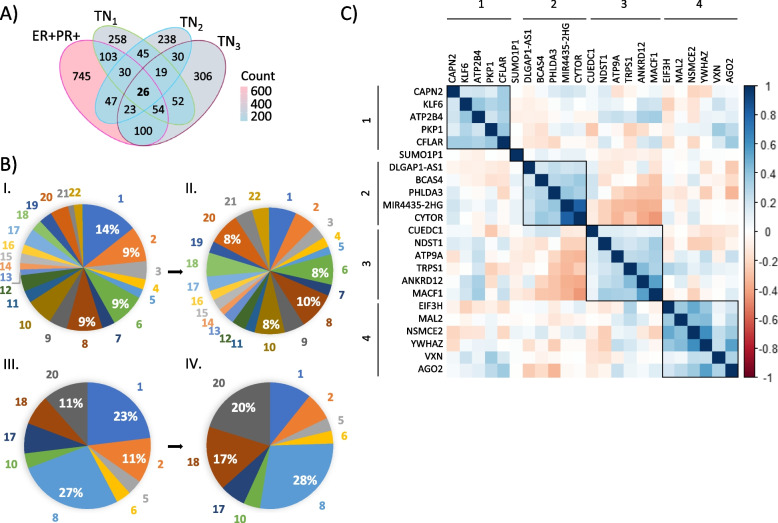
Methods: Using existing datasets containing super-enhancer-associated genes identified in breast tumors and public databases comprising genomic and clinical information for breast cancer patients, we investigated whether highly expressed super-enhancer-associated genes correlate to breast cancer patients' poor prognosis and to patients' poor response to therapy. Our computational findings were experimentally confirmed in breast cancer cells by pharmacological SE disruption and gene silencing techniques.
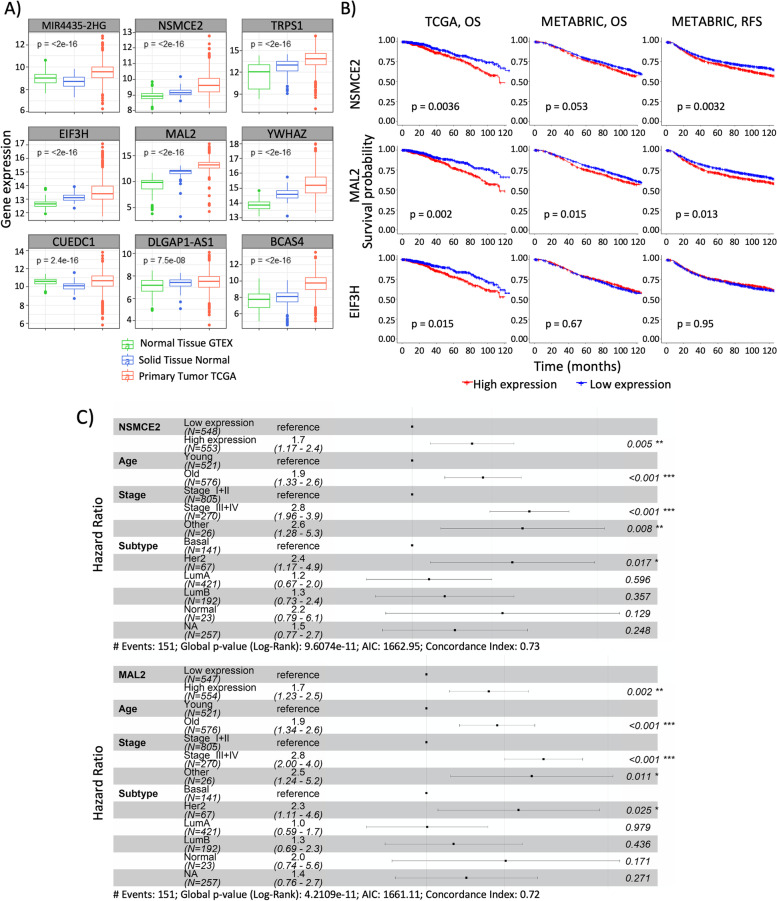
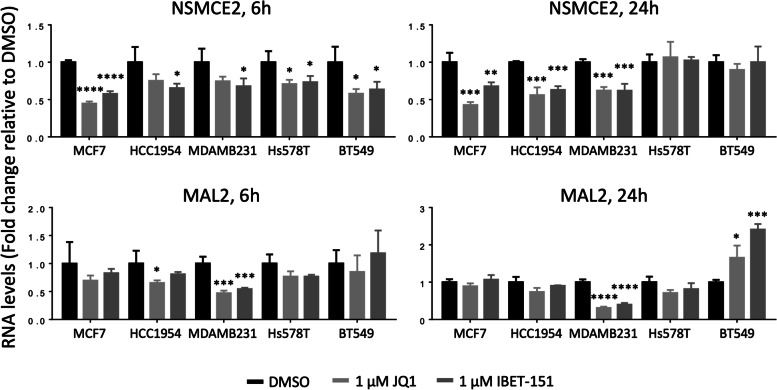
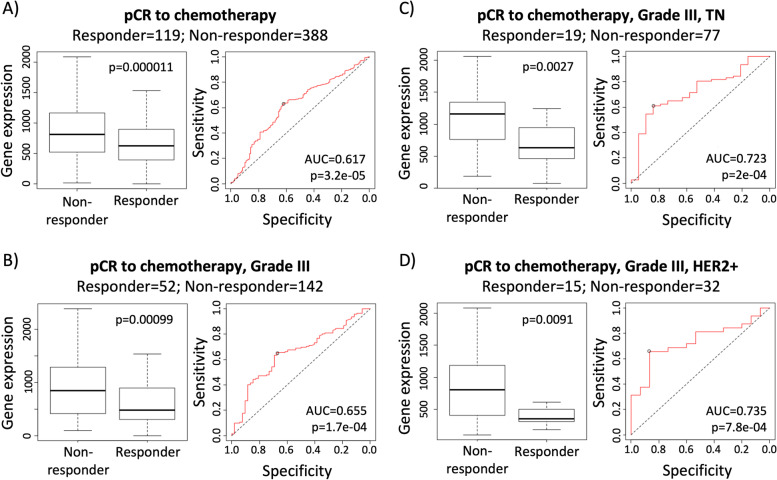
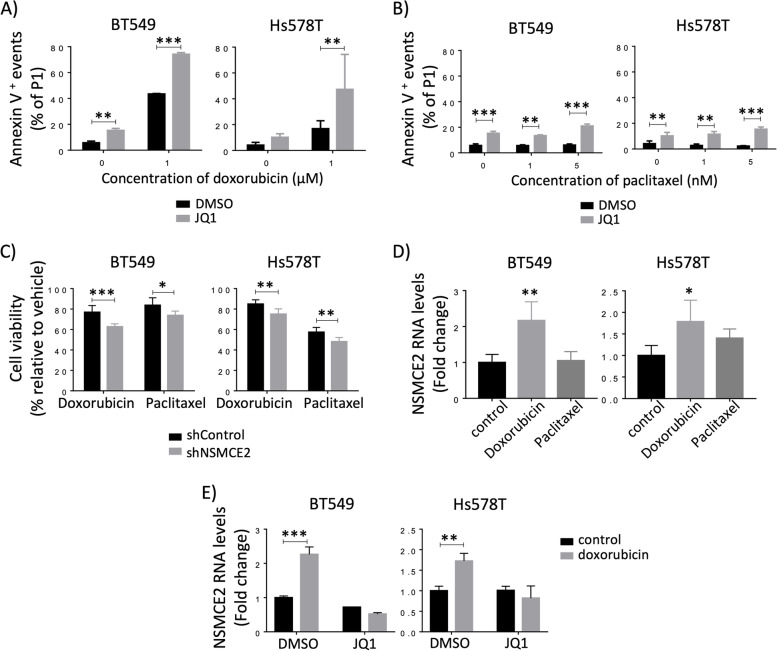
Results: We bioinformatically identified two novel super-enhancer-associated genes - NSMCE2 and MAL2 - highly upregulated in breast tumors, for which high RNA levels significantly and specifically correlate with breast cancer patients' poor prognosis. Through in-vitro pharmacological super-enhancer disruption assays, we confirmed that super-enhancers upregulate NSMCE2 and MAL2 transcriptionally, and, through bioinformatics, we found that high levels of NSMCE2 strongly associate with patients' poor response to chemotherapy, especially for patients diagnosed with aggressive triple negative and HER2 positive tumor types. Finally, we showed that decreasing NSMCE2 gene expression increases breast cancer cells' sensitivity to chemotherapy treatment.
Conclusions: Our results indicate that moderating the transcript levels of NSMCE2 could improve patients' response to standard chemotherapy consequently improving disease outcome. Our approach offers a new avenue to identify a signature of tumor specific genes that are not frequently mutated but dysregulated by super-enhancers. As a result, this strategy can lead to the discovery of potential and novel pharmacological targets for improving targeted therapy and the treatment of breast cancer.
Keywords: Breast cancer; MAL2; NSMCE2; Super-enhancers; Therapy resistance.
© 2022. The Author(s).
Conflict of interest statement
The authors declare that they have no competing interests.
Figures
Similar articles
-
CRISPR Screening of Transcribed Super-Enhancers Identifies Drivers of Triple-Negative Breast Cancer Progression.Cancer Res. 2024 Nov 4;84(21):3684-3700. doi: 10.1158/0008-5472.CAN-23-3995. Cancer Res. 2024. PMID: 39186674 Free PMC article.
-
Targeting Super-Enhancer-Associated Oncogenes in Osteosarcoma with THZ2, a Covalent CDK7 Inhibitor.Clin Cancer Res. 2020 Jun 1;26(11):2681-2692. doi: 10.1158/1078-0432.CCR-19-1418. Epub 2020 Jan 14. Clin Cancer Res. 2020. PMID: 31937612
-
Defining super-enhancer landscape in triple-negative breast cancer by multiomic profiling.Nat Commun. 2021 Apr 14;12(1):2242. doi: 10.1038/s41467-021-22445-0. Nat Commun. 2021. PMID: 33854062 Free PMC article.
-
Oncogenic super-enhancers in cancer: mechanisms and therapeutic targets.Cancer Metastasis Rev. 2023 Jun;42(2):471-480. doi: 10.1007/s10555-023-10103-4. Epub 2023 Apr 14. Cancer Metastasis Rev. 2023. PMID: 37059907 Free PMC article. Review.
-
The molecular understanding of super-enhancer dysregulation in cancer.Nagoya J Med Sci. 2022 May;84(2):216-229. doi: 10.18999/nagjms.84.2.216. Nagoya J Med Sci. 2022. PMID: 35967935 Free PMC article. Review.
Cited by
-
The SMC5/6 complex: folding chromosomes back into shape when genomes take a break.Nucleic Acids Res. 2024 Mar 21;52(5):2112-2129. doi: 10.1093/nar/gkae103. Nucleic Acids Res. 2024. PMID: 38375830 Free PMC article. Review.
-
Loop Extrusion Machinery Impairments in Models and Disease.Cells. 2024 Nov 17;13(22):1896. doi: 10.3390/cells13221896. Cells. 2024. PMID: 39594644 Free PMC article. Review.
-
Super-Enhancers and Their Parts: From Prediction Efforts to Pathognomonic Status.Int J Mol Sci. 2024 Mar 7;25(6):3103. doi: 10.3390/ijms25063103. Int J Mol Sci. 2024. PMID: 38542080 Free PMC article. Review.
-
Enhancer Clusters Drive Type I Interferon-Induced TRAIL Overexpression in Cancer, and Its Intracellular Protein Accumulation Fails to Induce Apoptosis.Cancers (Basel). 2023 Feb 3;15(3):967. doi: 10.3390/cancers15030967. Cancers (Basel). 2023. PMID: 36765925 Free PMC article.
-
Cancer fusion transcripts with human non-coding RNAs.Front Oncol. 2024 Jun 11;14:1415801. doi: 10.3389/fonc.2024.1415801. eCollection 2024. Front Oncol. 2024. PMID: 38919532 Free PMC article. Review.
References
MeSH terms
Substances
Grants and funding
LinkOut - more resources
Full Text Sources
Medical
Molecular Biology Databases
Research Materials
Miscellaneous
