

Transcriptomic profiling of sporadic Alzheimer's disease patients
- PMID: 36224601
- PMCID: PMC9559068
- DOI: 10.1186/s13041-022-00963-2
Transcriptomic profiling of sporadic Alzheimer's disease patients
Abstract
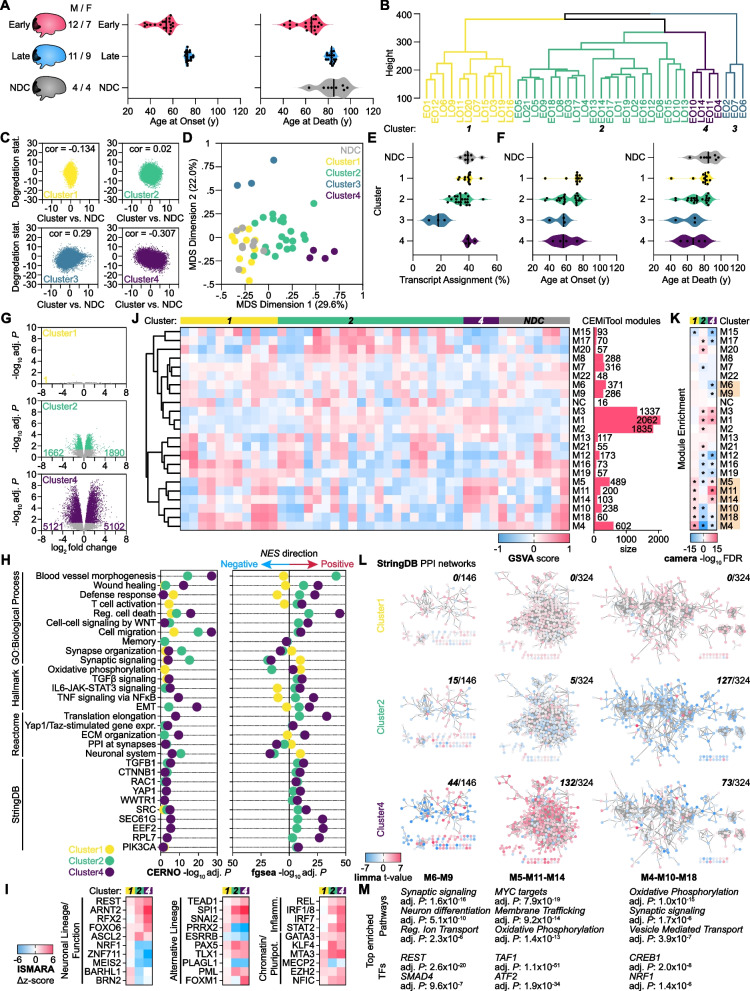
Alzheimer's disease (AD) manifested before age 65 is commonly referred to as early-onset AD (EOAD) (Reitz et al. Neurol Genet. 2020;6:e512). While the majority (> 90%) of EOAD cases are not caused by autosomal-dominant mutations in PSEN1, PSEN2, and APP, they do have a higher heritability (92-100%) than sporadic late-onset AD (LOAD, 70%) (Wingo et al. Arch Neurol. 2012;69:59-64, Fulton-Howard et al. Neurobiol Aging. 2021;99:101.e1-101.e9). Although the endpoint clinicopathological changes, i.e., Aβ plaques, tau tangles, and cognitive decline, are common across EOAD and LOAD, the disease progression is highly heterogeneous (Neff et al. Sci Adv Am Assoc Adv Sci. 2021;7:eabb5398). This heterogeneity, leading to temporally distinct age at onset (AAO) and stages of cognitive decline, may be caused by myriad combinations of distinct disease-associated molecular mechanisms. We and others have used transcriptome profiling in AD patient-derived neuron models of autosomal-dominant EOAD and sporadic LOAD to identify disease endotypes (Caldwell et al. Sci Adv Am Assoc Adv Sci. 2020;6:eaba5933, Mertens et al. Cell Stem Cell. 2021;28:1533-1548.e6, Caldwell et al. Alzheimers Demen. 2022). Further, analyses of large postmortem brain cohorts demonstrate that only one-third of AD patients show hallmark disease endotypes like increased inflammation and decreased synaptic signaling (Neff et al. Sci Adv Am Assoc Adv Sci. 2021;7:eabb5398). Areas of the brain less affected by AD pathology at early disease stages-such as the primary visual cortex-exhibit similar transcriptomic dysregulation as those regions traditionally affected and, therefore, may offer a view into the molecular mechanisms of AD without the associated inflammatory changes and gliosis induced by pathology (Haroutunian et al. Neurobiol Aging. 2009;30:561-73). To this end, we analyzed AD patient samples from the primary visual cortex (19 EOAD, 20 LOAD) using transcriptomic signatures to identify patient clusters and disease endotypes. Interestingly, although the clusters showed distinct combinations and severity of endotypes, each patient cluster contained both EOAD and LOAD cases, suggesting that AAO may not directly correlate with the identity and severity of AD endotypes.
© 2022. The Author(s).
Conflict of interest statement
The authors declare no competing interests. The contents do not represent the views of the U.S. Department of Veterans Affairs or the United States Government.
Figures
References
Publication types
MeSH terms
Grants and funding
- R01 HL108735/HL/NHLBI NIH HHS/United States
- DK097430/GF/NIH HHS/United States
- LM012595/GF/NIH HHS/United States
- R01 HL106579/HL/NHLBI NIH HHS/United States
- HL106579-07/GF/NIH HHS/United States
- P30 AG062429/AG/NIA NIH HHS/United States
- P30 DK120515/DK/NIDDK NIH HHS/United States
- CA198941/GF/NIH HHS/United States
- P30 CA023100/CA/NCI NIH HHS/United States
- I01 RX002259/RX/RRD VA/United States
- AGO5131/GF/NIH HHS/United States
- P30 DK063491/DK/NIDDK NIH HHS/United States
- HD084633/GF/NIH HHS/United States
LinkOut - more resources
Full Text Sources
Medical
Molecular Biology Databases
