

Scaffold-mediated switching of lymphoma metabolism in culture
- PMID: 36224623
- PMCID: PMC9559005
- DOI: 10.1186/s40170-022-00291-y
Scaffold-mediated switching of lymphoma metabolism in culture
Abstract
Background: Diffuse large B cell lymphoma (DLBCL) is an aggressive subtype of non-Hodgkin lymphoma (NHL) and accounts for about a third of all NHL cases. A significant proportion (~40%) of treated DLBCL patients develop refractory or relapsed disease due to drug resistance which can be attributed to metabolomic and genetic variations amongst diverse DLBCL subtypes. An assay platform that reproduces metabolic patterns of DLBCL in vivo could serve as a useful model for DLBCL.
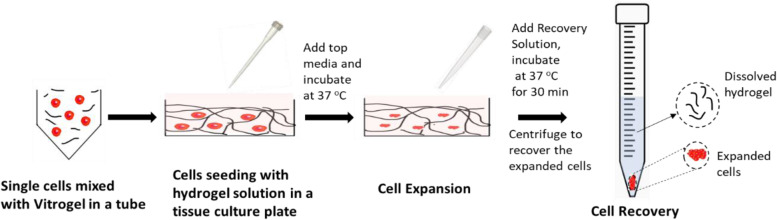
Methods: This report investigated metabolic functions in 2D and 3D cell cultures using parental and drug-resistant DLBCL cell lines as compared to patient biopsy tissue.
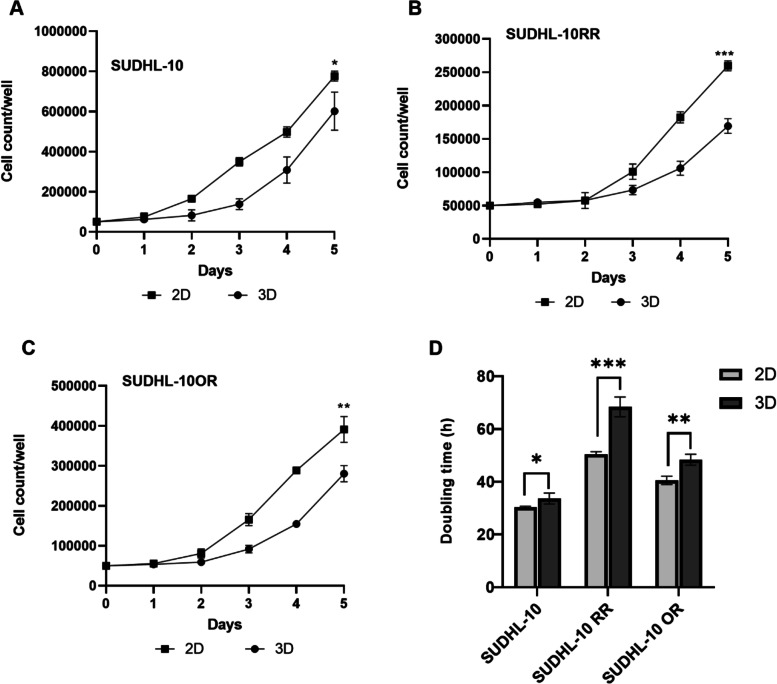
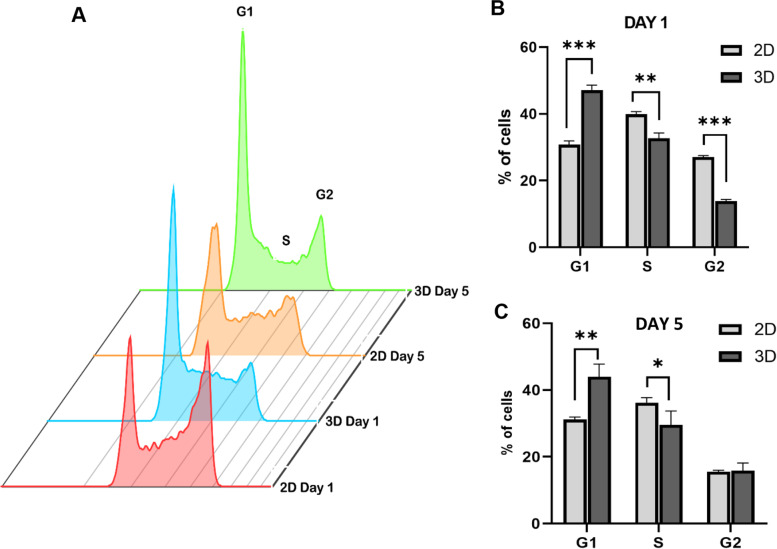
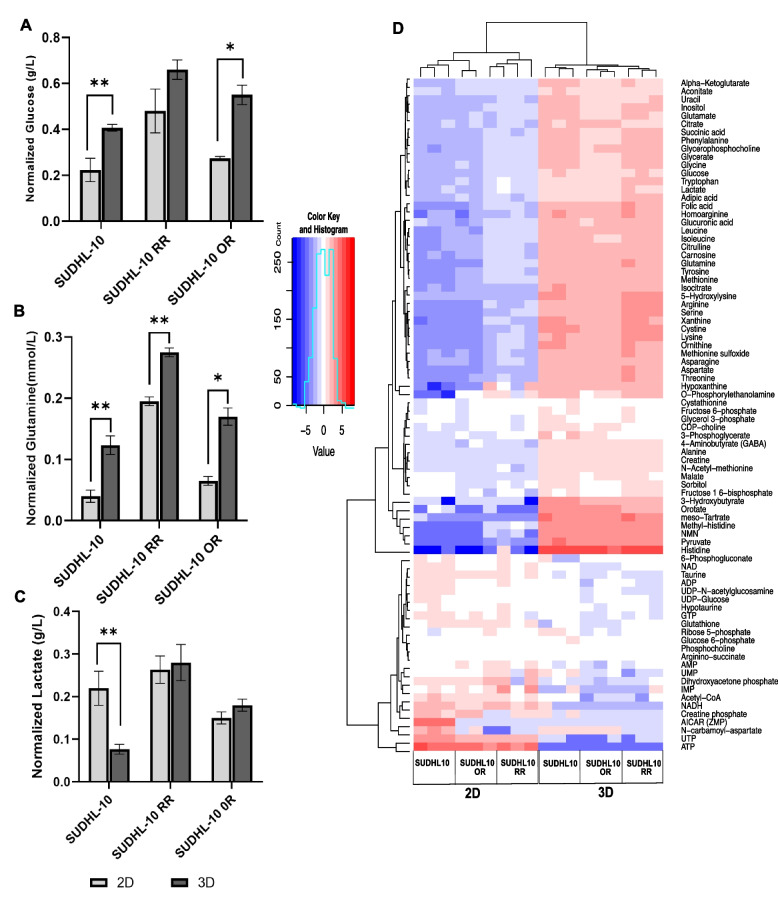
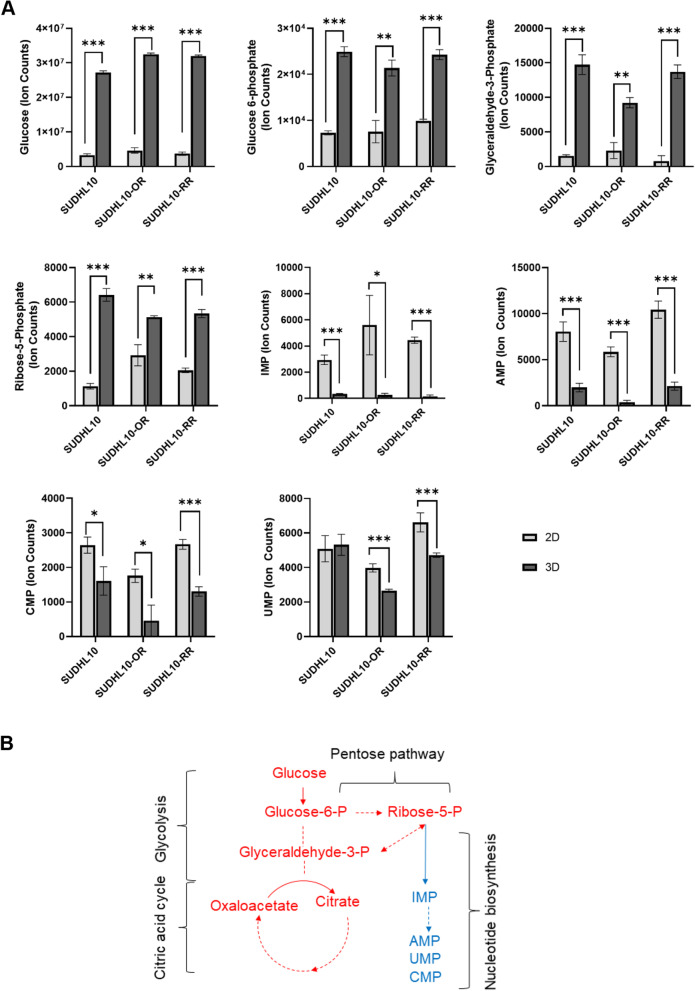
Results: A 3D culture model controlled the proliferation of parental and drug-resistant DLBCL cell lines, SUDHL-10, SUDHL-10 RR (rituximab resistant), and SUDHL-10 OR (obinutuzumab resistant), as well as retained differential sensitivity to CHOP. The results from metabolic profiling and isotope tracer studies with D-glucose-13C6 indicated metabolic switching in 3D culture when compared with a 2D environment. Analysis of DLBCL patient tumor tissue revealed that the metabolic changes in 3D grown cells were shifted towards that of clinical specimens.
Conclusion: 3D culture restrained DLBCL cell line growth and modulated metabolic pathways that trend towards the biological characteristics of patient tumors. Counter-intuitively, this research thereby contends that 3D matrices can be a tool to control tumor function towards a slower growing and metabolically dormant state that better reflects in vivo tumor physiology.
Keywords: 3D model; DLBCL; Drug sensitivity; Lymphoma; Metabolic flux; Proliferation.
© 2022. The Author(s).
Conflict of interest statement
R.B, D.R., and B.P. declare that they have no competing interests. A.M.E. receives an honorarium from Advisory board Bayer, Seattle Genetics, Affimed, Verastem, Pharmacyclics, Research to Practice, and Physician Education Resource and research support: Takeda, Seattle Genetics, Merck, NIH/NCI, Leukemia and Lymphoma Society, and ORIEN
Figures


Similar articles
-
Rituximab: a review of its use in non-Hodgkin's lymphoma and chronic lymphocytic leukaemia.Drugs. 2003;63(8):803-43. doi: 10.2165/00003495-200363080-00005. Drugs. 2003. PMID: 12662126 Review.
-
A bone-based 3D scaffold as an in-vitro model of microenvironment-DLBCL lymphoma cell interaction.Front Oncol. 2022 Oct 18;12:947823. doi: 10.3389/fonc.2022.947823. eCollection 2022. Front Oncol. 2022. PMID: 36330473 Free PMC article.
-
MicroRNAs associated to single drug components of R-CHOP identifies diffuse large B-cell lymphoma patients with poor outcome and adds prognostic value to the international prognostic index.BMC Cancer. 2020 Mar 20;20(1):237. doi: 10.1186/s12885-020-6643-8. BMC Cancer. 2020. PMID: 32192453 Free PMC article.
-
PI3Kδ activation, IL6 over-expression, and CD37 loss cause resistance to the targeting of CD37-positive lymphomas with the antibody-drug conjugate naratuximab emtansine.bioRxiv [Preprint]. 2023 Nov 16:2023.11.14.566994. doi: 10.1101/2023.11.14.566994. bioRxiv. 2023. PMID: 38014209 Free PMC article. Preprint.
-
Novel drug targets for personalized precision medicine in relapsed/refractory diffuse large B-cell lymphoma: a comprehensive review.Mol Cancer. 2015 Dec 11;14:207. doi: 10.1186/s12943-015-0474-2. Mol Cancer. 2015. PMID: 26654227 Free PMC article. Review.
Cited by
-
Metabolic Reprogramming and Potential Therapeutic Targets in Lymphoma.Int J Mol Sci. 2023 Mar 13;24(6):5493. doi: 10.3390/ijms24065493. Int J Mol Sci. 2023. PMID: 36982568 Free PMC article. Review.
-
Characterizing influence of rCHOP treatment on diffuse large B-cell lymphoma microenvironment through in vitro microfluidic spheroid model.Cell Death Dis. 2024 Jan 9;15(1):18. doi: 10.1038/s41419-023-06299-6. Cell Death Dis. 2024. PMID: 38195589 Free PMC article.
-
Deciphering the Metabolic Basis and Molecular Circuitry of the Warburg Paradox in Lymphoma.Cancers (Basel). 2024 Oct 25;16(21):3606. doi: 10.3390/cancers16213606. Cancers (Basel). 2024. PMID: 39518046 Free PMC article.
References
Grants and funding
LinkOut - more resources
Full Text Sources
Research Materials
