. 2022 Oct 13;15(1):145.
doi: 10.1186/s13045-022-01357-6.

CRISPR/Cas9-mediated deletion of Interleukin-30 suppresses IGF1 and CXCL5 and boosts SOCS3 reducing prostate cancer growth and mortality

Affiliations

CRISPR/Cas9-mediated deletion of Interleukin-30 suppresses IGF1 and CXCL5 and boosts SOCS3 reducing prostate cancer growth and mortality

Carlo Sorrentino et al. J Hematol Oncol. .

Abstract

Background: Metastatic prostate cancer (PC) is a leading cause of cancer death in men worldwide. Targeting of the culprits of disease progression is an unmet need. Interleukin (IL)-30 promotes PC onset and development, but whether it can be a suitable therapeutic target remains to be investigated. Here, we shed light on the relationship between IL30 and canonical PC driver genes and explored the anti-tumor potential of CRISPR/Cas9-mediated deletion of IL30.

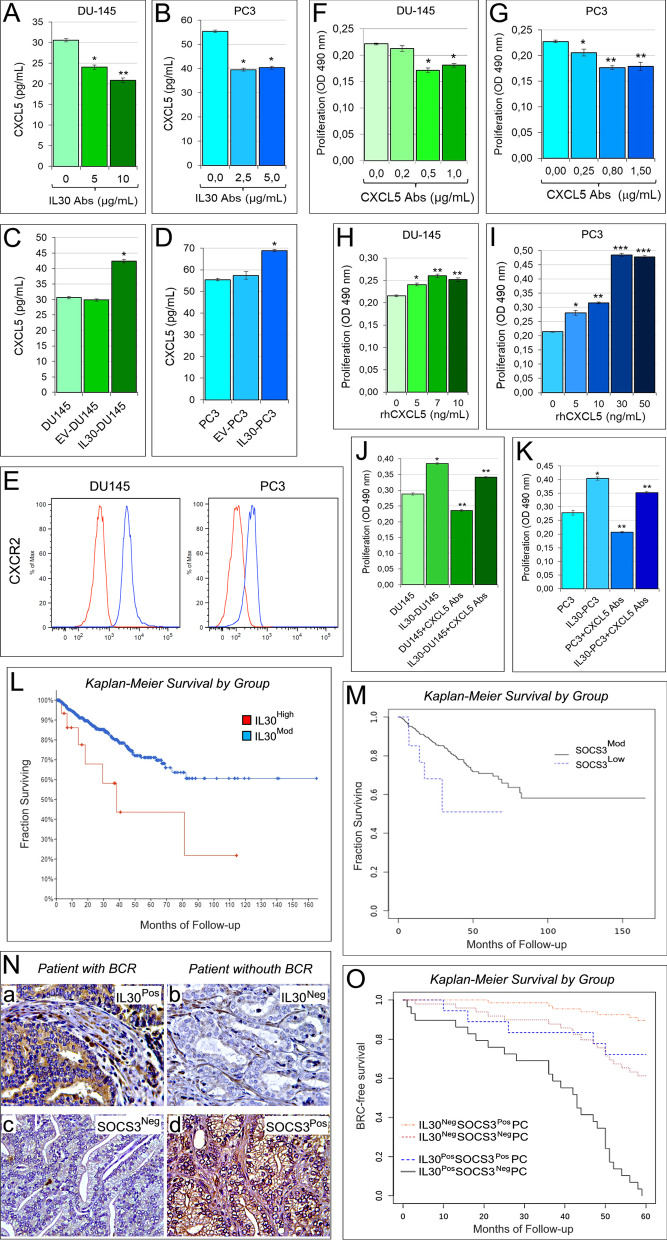
Methods: PC cell production of, and response to, IL30 was tested by flow cytometry, immunoelectron microscopy, invasion and migration assays and PCR arrays. Syngeneic and xenograft models were used to investigate the effects of IL30, and its deletion by CRISPR/Cas9 genome editing, on tumor growth. Bioinformatics of transcriptional data and immunopathology of PC samples were used to assess the translational value of the experimental findings.

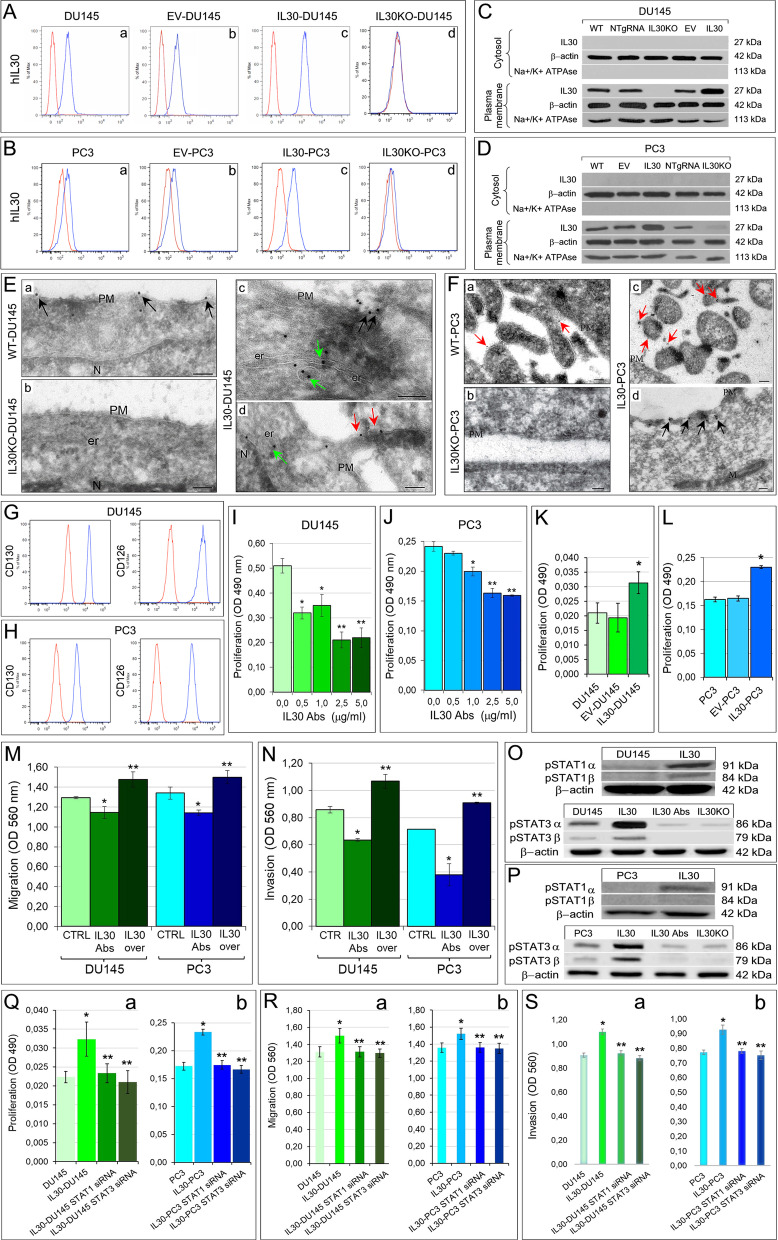
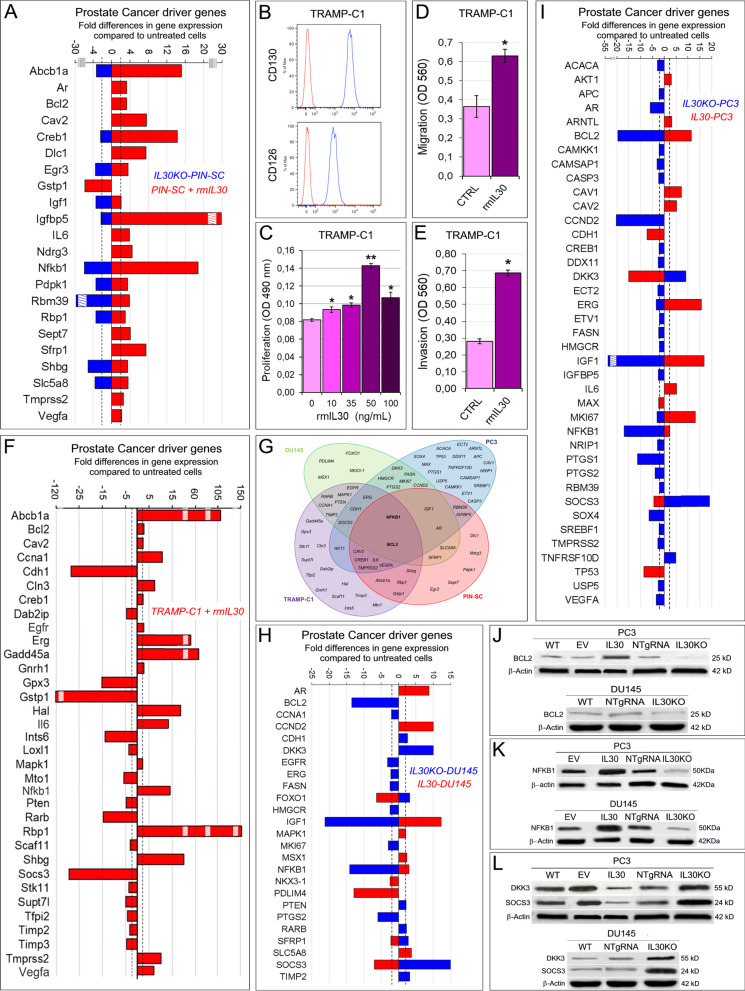
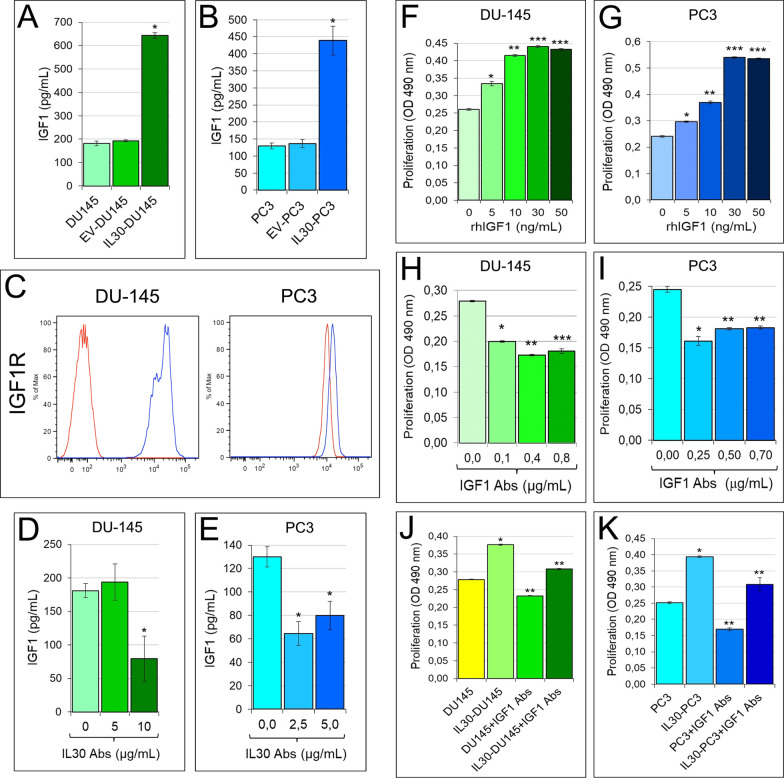
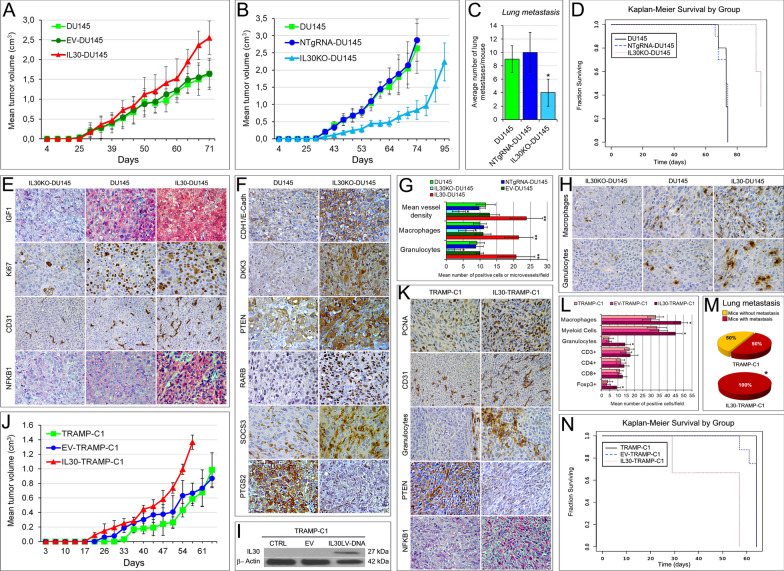
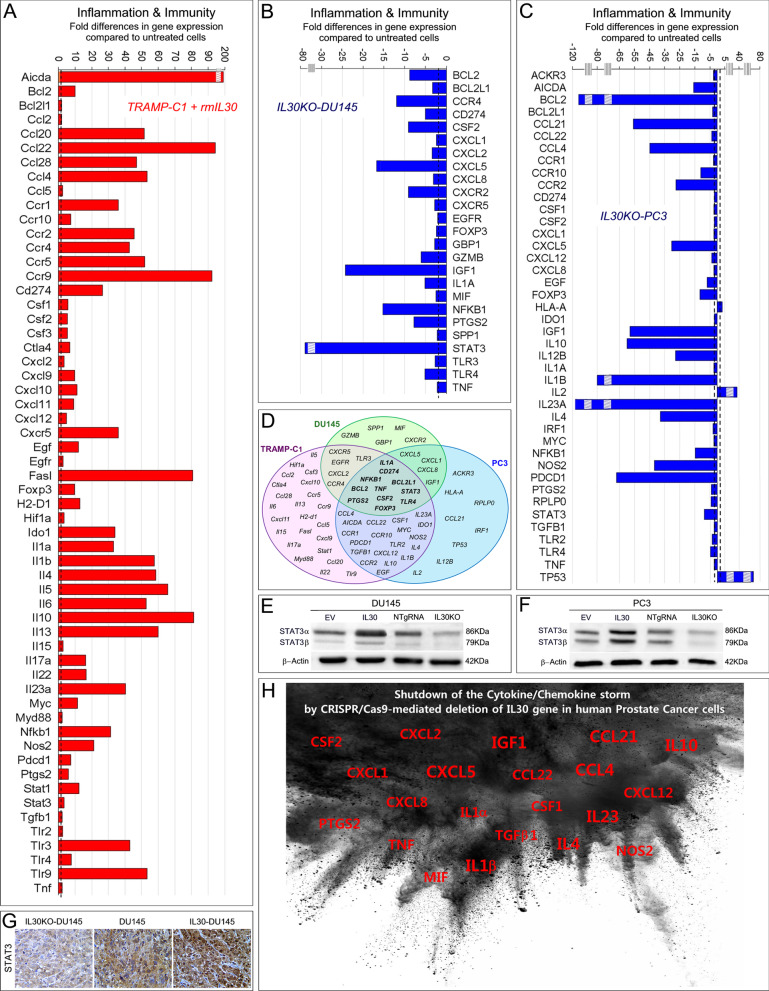
Results: Human membrane-bound IL30 promoted PC cell proliferation, invasion and migration in association with STAT1/STAT3 phosphorylation, similarly to its murine, but secreted, counterpart. Both human and murine IL30 regulated PC driver and immunity genes and shared the upregulation of oncogenes, BCL2 and NFKB1, immunoregulatory mediators, IL1A, TNF, TLR4, PTGS2, PD-L1, STAT3, and chemokine receptors, CCR2, CCR4, CXCR5. In human PC cells, IL30 improved the release of IGF1 and CXCL5, which mediated, via autocrine loops, its potent proliferative effect. Deletion of IL30 dramatically downregulated BCL2, NFKB1, STAT3, IGF1 and CXCL5, whereas tumor suppressors, primarily SOCS3, were upregulated. Syngeneic and xenograft PC models demonstrated IL30's ability to boost cancer proliferation, vascularization and myeloid-derived cell infiltration, which were hindered, along with tumor growth and metastasis, by IL30 deletion, with improved host survival. RNA-Seq data from the PanCancer collection and immunohistochemistry of high-grade locally advanced PCs demonstrated an inverse association (chi-squared test, p = 0.0242) between IL30 and SOCS3 expression and a longer progression-free survival of patients with IL30NegSOCS3PosPC, when compared to patients with IL30PosSOCS3NegPC.

Conclusions: Membrane-anchored IL30 expressed by human PC cells shares a tumor progression programs with its murine homolog and, via juxtacrine signals, steers a complex network of PC driver and immunity genes promoting prostate oncogenesis. The efficacy of CRISPR/Cas9-mediated targeting of IL30 in curbing PC progression paves the way for its clinical use.

Keywords: CRISPR/Cas9; CXCL5; IGF1; Interleukin-30; Prostate cancer; Tumor microenvironment.


Conflict of interest statement

The authors declare that they have no competing interests.

Figures

Fig. 1
Fig. 1
Constitutive expression of IL30 in human PC cells and IL30-dependent regulation of their proliferation, migration and invasion abilities. A, B Cytofluorimetric analyses of IL30 expression in human PC cells, DU145 (A) and PC3 (B). The DU145 cells showed a mean fluorescence intensity (MFI) ratio of 2.34, whereas the MFI ratio of PC3 cells was 1.95. The MFI was obtained calculating the ratio between the fluorescence of the samples and their isotype controls. Red lines: isotype control. Blue lines: anti-IL30 Abs. Results obtained from NTgRNA-treated cells were comparable with those from WT and EV-transfected cells. Experiments were performed in triplicate. C, D Western blot analyses of IL30 protein expression in the cytosolic and plasma membrane fractions of wild type, NTgRNA-treated, IL30KO, EV and IL30 gene-transfected DU145 (C) and PC3 (D) cells. E, F Cryo-immunoelectron microscopy of IL30 in DU145 (E) and PC3 (F) cells, showing IL30 localization, by gold particles, in WT (a), IL30KO (b) and IL30-overexpressing (c, d) cells. The gold particles were more frequent in IL30-overexpressing DU145 and PC3 cells (c, d) than in WT cells (a), whereas they were absent in IL30KO cells (b). In both DU145 and PC3 cells, the gold particles specifically delineated the plasma membranes (black arrows) and their microvilli-like structures (red arrows), the endoplasmic reticulum and associated cytoplasmic vesicles (green arrows). One out of four labeling experiments is shown. PM, plasma membrane; N, nucleus; er, endoplasmic reticulum; M, mitochondrion. Scale bars: 100 nm. G, H Cytofluorimetric analyses of gp130 (CD130) and IL6Rα (CD126) expression in DU145 (G) and PC3 (H) cells. Red lines: isotype control. Experiments were performed in triplicate. I, J MTT assay of DU145 (I) and PC3 (J) cells, after 48 h of treatment with anti-IL30 Abs (0.5–5.0 µg/mL). ANOVA: p < 0.0001. I *p < 0.01, Tukey HSD test compared with 0.0 µg/mL. **p < 0.05, Tukey HSD test compared with 0.0, 0.5 and 1.0 μg/mL. J *p < 0.01, Tukey HSD test compared with 0.0 and 0.5 µg/mL. **p < 0.01, Tukey HSD test compared with 0.0, 0.5 and 1.0 μg/mL. Results are expressed as mean ± SD. K, L MTT assay of IL30 gene-transfected, IL30-DU145 (K) and IL30-PC3 (L) cells, versus EV-transfected and WT cells. K ANOVA, p < 0.05. *p < 0.05, Tukey HSD test compared with WT and EV-transfected cells. L ANOVA, p < 0.0001. *p < 0.01, Tukey HSD test compared with WT and EV-transfected cells. Results are expressed as mean ± SD. M, N The treatment with anti-IL30 Abs (48 h) significantly decreased the number of DU145 and PC3 cells, that migrated (M) across the polycarbonate membrane insert or that invaded (N) the basement membrane matrix layer. By contrast, IL30 overexpression (IL30 over) significantly increased the number of migrating and invading DU145 (M) and PC3 (M) cells. Results obtained from EV-transfected cells are comparable with those from untreated wild-type cells (CTRL). Experiments were performed in triplicate. Results are expressed as mean ± SD. ANOVA, p < 0.01. *p < 0.05, Tukey HSD test compared with CTRL. **p < 0.05, Tukey HSD test compared with CTRL and cells treated with anti-IL30 Abs. O, P Quantitative western blot analysis of the expression of phospho-STAT1α and β isoforms, and phospho-STAT3α and β isoforms in DU145 (O) and PC3 (P) cells, and corresponding IL30 gene-transfected (IL30) cells, or IL30 gene knockout (IL30KO) cells, or wild-type cells treated with anti-IL30 Abs (IL30Abs). Expression of phospho-STAT1α was 15.93, and 53.26 times higher in IL30-DU145 and IL30-PC3, respectively, than in wild-type cells. Expression of phospho-STAT1β was 31.46, and 17.56 times higher in IL30-DU145 and IL30-PC3, respectively, than in wild-type cells. Expression of phospho-STAT3α and β was higher in IL30-DU145 (2.33 and 3.12 times) than in wild-type cells, whereas it was reduced in IL30KO-DU145 (− 6.63 and − 22.75 times) and in DU145 cells treated with anti-IL30 Abs (− 5.94 and − 23.89 times). Expression of phospho-STAT3α and β was higher in IL30-PC3 (2.22 and 4.17 times) than in wild-type cells, whereas it was reduced in IL30KO-PC3 (− 3.02 and − 6.42 times) and in PC3 cells treated with anti-IL30 Abs (− 2.96 and − 3.32 times). Results from control EV-transfected or NTgRNA-treated cells were comparable with those from wild-type cells. Q MTT assay of STAT1 siRNA- or STAT3 siRNA-transfected IL30-DU145 (a) and IL30-PC3 (b) cells. (a) ANOVA, p < 0.01; *p < 0.05, Tukey HSD test compared with DU145 cells; **p < 0.05, Tukey HSD test compared with IL30-DU145 cells. (b) ANOVA, p < 0.0001; *p < 0.01, Tukey HSD test compared with PC3 cells; **p < 0.01, Tukey HSD test compared with IL30-PC3 cells. Results from cells transfected with STAT1 or STAT3 scrambled siRNAs are comparable with those from IL30-overexpressing cells. Results are expressed as mean ± SD. R Migration assay of STAT1 siRNA- or STAT3 siRNA-transfected IL30-DU145 (a) and IL30-PC3 (b). ANOVA, p < 0.05. *p < 0.05, Tukey HSD test compared with DU145 (a) and PC3 (b) cells; **p < 0.05, Tukey HSD test compared with IL30-DU145 (a) and IL30-PC3 (b) cells. Results from cells transfected with STAT1 or STAT3 scrambled siRNAs are comparable with those from IL30-overexpressing cells. Results are expressed as mean ± SD. S Invasion assay of STAT1 siRNA- or STAT3 siRNA-transfected IL30-DU145 (a) and IL30-PC3 (b) cells. ANOVA, p < 0.0001. *p < 0.01, Tukey HSD test compared with DU145 (a) and PC3 (b) cells; **p < 0.01, Tukey HSD test compared with IL30-DU145 (a) and IL30-PC3 (b) cells. Results from cells transfected with STAT1 or STAT3 scrambled siRNAs are comparable with those from IL30-overexpressing cells. Results are expressed as mean ± SD
Fig. 2
Fig. 2
IL30-dependent regulation of PC driver genes in murine and human PC cells. A Mouse Prostate Cancer PCR Array. Fold differences of the mRNAs of PC driver genes between rmIL30-treated (red bars) and untreated wild-type murine (m) PC-SLCs, and between IL30KO-mPC-SLCs (blue bars) and mPC-SLCs. Results obtained from control NTgRNA-treated and untreated mPC-SLCs were comparable to those from wild type cells. A significant threshold of twofold change in gene expression corresponded to p < 0.001. Only genes with a fold change > 2, in at least one condition, up- or downregulation, are shown. Experiments were performed in duplicate. Stripped boxes represent scale breaks. The dashed lines represent the twofold change cutoff. B Cytofluorimetric analyses of gp130 (CD130) and IL6Rα (CD126) expression in TRAMP-C1 cells. Red lines: isotype control. Experiments were performed in triplicate. C MTT assay of TRAMP-C1 cells after 48 h treatment with rmIL30 at concentrations of 10, 35, 50 and 100 ng/mL. ANOVA: p < 0.0001. *p < 0.05, Tukey HSD test compared with 0 ng/mL. **p < 0.01, Tukey HSD test compared with 0, 10, 35 and 100 ng/mL. Results are expressed as mean ± SD. D, E The treatment with rmIL30 (6 h), significantly increased the number of TRAMP-C1 cells, which migrated (D) across the polycarbonate membrane insert, or which invaded (E) the basement membrane matrix layer. Results are expressed as mean ± SD. *Student’s t test: p = 0.0001 (D), p = 0.00001 (E), compared with untreated (CTRL) cells. Experiments were performed in triplicate. F Mouse Prostate Cancer PCR Array. Fold differences of the mRNAs of PC driver genes between rmIL30-treated (red bars) and untreated wild-type TRAMP-C1 cells. A significant threshold of a twofold change in gene expression corresponded to p < 0.001. Only genes with a fold change > 2 are shown. Experiments were performed in duplicate. Stripped boxes represent scale breaks. The dashed lines represent the twofold change cutoff. G Venn diagram representing the “PC Driver Genes” which are up- and/or downregulated by IL30 (treatment with rmIL30 or human IL30 gene knockout) in TRAMP-C1 (purple circle), PIN-SC (red circle), DU145 (green circle) and PC3 cells (blue circle). Overlapping circles illustrate the sharing of IL30-regulated genes between different cell lines. H Human Prostate Cancer PCR Array. Fold differences of mRNAs of PC driver genes between IL30-overexpressing IL30-DU145 cells (red bars) and wild-type DU145 cells, and between IL30KO-DU145 cells (blue bars) and wild-type cells. Results obtained from control NTgRNA-treated and EV-transfected DU145 cells were comparable to those from wild-type cells. A significant threshold of twofold change in gene expression corresponded to p < 0.001. Only genes with a fold change > 2, in at least one condition, up- or downregulation, are shown. Experiments were performed in duplicate. The dashed lines represent the twofold change cutoff. I Fold differences of the mRNAs of PC driver genes between IL30-overexpressing IL30-PC3 cells (red bars) and wild-type PC3 cells, and between IL30KO-PC3 cells (blue bars) and wild-type cells. Results obtained from control NTgRNA-treated and EV-transfected PC3 cells were comparable to those from wild-type cells. A significant threshold of a twofold change in gene expression corresponded to p < 0.001. Only genes with a fold change > 2, in at least one condition, up- or downregulation, are shown. Experiments were performed in duplicate. The stripped box represents a scale break. The dashed lines represent the twofold change cutoff. J Western blot analysis of BCL2 protein expression in WT, EV- or IL30 gene-transfected, NTgRNA-treated and IL30KO-PC3 cells, and in WT, NTgRNA-treated and IL30KO-DU145 cells. K Western blot analysis of NFKB1 protein expression in EV- or IL30 gene-transfected, NTgRNA-treated and IL30KO, PC3 and DU145 cells. Results obtained from control NTgRNA-treated and EV-transfected cells were comparable to those from wild-type cells. L Western blot analysis of DKK3 and SOCS3 protein expression in WT, EV- or IL30 gene-transfected, NTgRNA-treated and IL30KO-PC3 cells, and in WT, NTgRNA-treated and IL30KO-DU145 cells
Fig. 3
Fig. 3
IL30-dependent regulation of IGF1 production in human PC cells and IGF1-mediated autocrine growth loop. A, B Elisa assay of IGF1 release by wild-type, EV and IL30 gene-transfected DU145 (A) and PC3 (B) cells. ANOVA: p < 0.0001. *p < 0.01, Tukey HSD test compared with WT and EV-transfected cells. Results are expressed as mean ± SD. C Cytofluorimetric analyses of IGF1R expression in PC3 and DU145 cells. Red lines: isotype control. Experiments were performed in triplicate. D, E Elisa assay of IGF1 release by wild-type DU145 (D) and PC3 (E) cells, after the treatment with anti-IL30 Abs. (D) ANOVA: p < 0.05. *p < 0.05, Tukey HSD test compared with DU145 cells untreated or treated with 5 μg/mL. E ANOVA: p < 0.001. *p < 0.01, Tukey HSD test compared with untreated PC3 cells. Results are expressed as mean ± SD. F, G MTT assay of DU145 (F) and PC3 (G) cells, untreated (0.0 ng/mL) or treated with rhIGF1 (5.0, 10, 30, 50 ng/mL). ANOVA: p < 0.0001. *p < 0.01, Tukey HSD test compared with 0 ng/mL. **p < 0.01, Tukey HSD test compared with 0 and 5 ng/mL. ***p < 0.01, Tukey HSD test compared with 0, 5 and 10 ng/mL. Results are expressed as mean ± SD. H, I MTT assay of DU145 (H) and PC3 (I) cells, untreated (0.0 μg/mL) or treated with anti-IGF1 Abs (0.1, 0.4, 0.8 μg/mL in DU145; 0.25, 0.50, 0.70 μg/mL in PC3). (H) ANOVA: p < 0.0001. *p < 0.01, Tukey HSD test compared with 0.0 μg/mL. **p < 0.01, Tukey HSD test compared with 0.0 and 0.1 μg/mL. ***p < 0.05, Tukey HSD test compared with 0.0, 0.1 and 0.4 μg/mL. (I) ANOVA: p < 0.0001. *p < 0.01, Tukey HSD test compared with 0.00 µg/mL. **p < 0.01, Tukey HSD test compared with 0.00 and 0.25 μg/mL. Results are expressed as mean ± SD. J, K MTT assay of wild-type and IL30 gene-transfected DU145 (J) and PC3 (K) cells, untreated (0.0 μg/mL), or treated with anti-IGF1 Abs (30 μg/mL). ANOVA: p < 0.0001. *p < 0.01, Tukey HSD test compared with wild-type cells. **p < 0.01, Tukey HSD test compared with wild-type and IL30-transfected cells. Results are expressed as mean ± SD
Fig. 4
Fig. 4
Tumor growth and survival of mice-bearing IL30-deficient or IL30-overexpressing PC of murine or human origin. A Mean volume of tumors developed in NSG mice, after s.c. implantation of wild type, EV- or IL30-DU145 cells. ANOVA, p < 0.0001; Tukey HSD test, p < 0.01 versus wild type or EV-transfected DU145 cells. Results are expressed as mean ± SD. B Mean volume of tumors developed in NSG mice, after s.c. implantation of wild type, NTgRNA-treated or IL30KO-DU145 cells. ANOVA, p < 0.0001; Tukey HSD test, p < 0.01 versus wild type or NTgRNA-treated DU145 cells. Results are expressed as mean ± SD. C Average number of lung metastasis spontaneously developed in NSG mice, which developed tumors after s.c. implantation of wild type, NTgRNA-treated or IL30KO-DU145 cells. ANOVA: p < 0.0001. *p < 0.01, Tukey HSD test versus DU145 or NTgRNA-treated DU145 cells. Results are expressed as mean ± SD. D Kaplan–Meier survival curves of mice-bearing tumors developed after s.c. implantation of wild type, NTgRNA-treated or IL30KO-DU145 cells. Log-rank test: p = 0.000009. E Immunopathological features of tumors developed in NSG mice, after s.c. implantation of IL30KO-DU145, wild type DU145 and IL30-DU145 cells. Expression of IGF1, proliferation (Ki67 Abs) and vascularization (CD31 Abs) were prominent in IL30-overexpressing tumors, and scanty in IL30KO tumors, compared with wild type tumors. Cytoplasmic and nuclear expression of NFKB1 was strong in IL30-overexpressing tumors and faint in IL30KO tumors. The immunopathological features of tumors developed after implantation of control, EV-transfected or NTgRNA-treated, cells were comparable to those of wild type tumors. Magnification: × 400; CD31, × 200. F Immunopathological features of tumors developed in NSG mice, after s.c. implantation of IL30KO-DU145 and wild type DU145 cells. Expression of tumor suppressor genes CDH1/E-Cadh, DKK3, PTEN, RARb and SOCS3 was stronger in IL30KO-DU145 tumors, when compared to wild type tumors, whereas the expression of PTGS2 was weaker. The immunopathological features of control tumors, developed in NSG after implantation of NTgRNA-treated cells, were comparable to those of wild type tumors. Magnification: × 400. G Automated immune cell count and microvessel density in tumors developed in NSG mice, after implantation of wild type, EV- or IL30 gene-transfected, NTgRNA-treated and IL30KO-DU145 cells, assessed by immunohistochemistry, as described in Methods. ANOVA, p < 0.0001. *p < 0.01, Tukey HSD test compared with DU145, NTgRNA-treated DU145 and EV-transfected DU145. **p < 0.01, Tukey HSD test compared with DU145, NTgRNA-treated DU145, IL30KO-DU145 and EV-transfected DU145. Results are expressed as mean ± SD. H The immune cell contexture of tumors developed in NSG mice, after s.c. implantation of IL30KO and IL30-DU145 cells, revealed a higher content of macrophages (anti-F4/80 Abs) and granulocytes (anti-Ly-6G Abs) in IL30-overexpressing tumors, compared to wild type tumors. By contrast, these immune cell populations were scarce to absent in IL30-deficient tumors. Magnification: × 400. Scale bars: 30 μm. I Western blot analysis of IL30 protein expression in wild type, EV- and IL30 gene-transfected TRAMP-C1 cells. J Mean volume of tumors developed in C57BL/6J mice, after s.c. implantation of wild type, EV- or IL30-TRAMP-C1 cells. ANOVA, p < 0.0001. Tukey HSD test, p < 0.01 versus wild type or EV-TRAMP-C1 cells. Results are expressed as mean ± SD. K Immunopathological features of tumors developed in C57BL/6J mice, after s.c. implantation of wild type or IL30-TRAMP-C1 cells revealed that proliferation (PCNA Abs), microvascular density (CD31 Abs) and granulocyte content (Ly-6G Abs) were higher in IL30-overexpressing tumors, than in control tumors. Cancer cells that formed IL30-TRAMP-C1 tumors showed reduced cytoplasmic expression of PTEN and an increased nuclear and cytoplasmic expression of NFKB1. Magnification: × 400; CD31, × 200. L Automated immune cell count in tumors developed in C57BL/6J mice, after s.c. implantation of wild type, EV or IL30 gene-transfected TRAMP-C1 cells, assessed by immunohistochemistry, as described in Methods. ANOVA, p < 0.001. *p < 0.01, Tukey HSD test compared with wild type or EV-TRAMP-C1 cells. Results are expressed as mean ± SD. M Percentage of lung metastasis spontaneously developed in C57BL/6J mice, which developed tumors after s.c. implantation of wild type or IL30 gene-transfected TRAMP-C1 cells. *Fisher’s exact test, p = 0.03 versus EV-TRAMP-C1 or TRAMP-C1. Results from mice implanted with EV-TRAMP-C1 cells were comparable to those obtained from mice implanted with wild type cells. N Kaplan–Meier survival curves of mice-bearing tumors developed after s.c. implantation of wild type, EV- or IL30 gene-transfected TRAMP-C1 cells. Log-rank test: p = 0.000124
Fig. 5
Fig. 5
IL30-dependent regulation of inflammation and immunity gene expression in murine and human PC cells. A Mouse Cancer Inflammation & Immunity Crosstalk PCR Array. Fold differences of mRNAs of inflammation and immunity-related genes between rmIL30-treated (red bars) and untreated wild-type TRAMP-C1 cells. A significant threshold of twofold change in gene expression corresponded to p < 0.001. Only genes with a fold change > 2 are shown. Experiments were performed in duplicate. The stripped box represents a scale break. The dashed line represents the twofold change cutoff. B Human Cancer Inflammation & Immunity Crosstalk PCR Array. Fold differences of mRNAs of inflammation and immunity-related genes between IL30KO-DU145 cells (blue bars) and wild-type cells. Results obtained from control NTgRNA-treated DU145 cells were comparable to those from wild type cells. A significant threshold of a twofold change in gene expression corresponded to p < 0.001. Only genes with a fold change > 2 are shown. Experiments were performed in duplicate. The stripped box represents a scale break. The dashed line represents the twofold change cutoff. C Human Cancer Inflammation & Immunity Crosstalk PCR Array. Fold differences of mRNAs of inflammation and immunity-related genes between IL30KO-PC3 cells (blue bars) and wild-type cells. Results obtained from control NTgRNA-treated PC3 cells were comparable to those from wild-type cells. A significant threshold of a twofold change in gene expression corresponded to p < 0.001. Only genes with a fold change > 2 are shown. Experiments were performed in duplicate. Stripped boxes represent scale breaks. The dashed lines represent the twofold change cutoff. D Venn diagram representing the genes that govern “Cancer Inflammation & Immunity Crosstalk” which are up- and/or downregulated by IL30 (treatment with rmIL30 or human IL30 gene knockout) in TRAMP-C1 (purple circle), DU145 (green circle) and PC3 cells (blue circle). Overlapping circles illustrate the sharing of IL30-regulated genes between different cell lines. E, F Western blot analysis of the expression of STAT3 α and β isoforms in EV-, IL30 gene-, NTgRNA-treated and IL30KO-DU145 (E) and PC3 (F) cells. Results obtained from control NTgRNA-treated and EV-transfected cells were comparable to those from wild-type cells. G Immunostaining of STAT3 in tumors developed in NSG mice, after s.c. implantation of IL30 gene-transfected, or deleted, DU145 cells, revealed that the cytoplasmic and nuclear expression of STAT3 was strong in IL30-overexpressing tumors, scanty in IL30-deficient tumors and moderate in wild-type tumors. Immunostaining of control tumors, developed after implantation of EV-transfected or NTgRNA-treated cells, was comparable to that of wild-type tumors. Magnification: × 400. H Graphic representation of the suppression of cytokine and chemokine expression in DU145 and PC3 cells following IL30 gene deletion by CRISPR/Cas9 technology. The most downregulated molecular mediators are represented with a larger font size. Both IL23A and IL12B, which form the heterodimeric cytokine IL23, were suppressed
Fig. 6
Fig. 6
IL30-dependent regulation of CXCL5 production in human PC cells and survival curves of PC patients based on the expression of IL30 and SOCS3 in their clinical samples. A, B Elisa assay of CXCL5 release by wild type DU145 (A) and PC3 (B) cells, after the treatment with anti-IL30 Abs. A ANOVA: p < 0.0001. *p < 0.01, Tukey HSD test compared with untreated DU145 cells. **p < 0.01, Tukey HSD test compared with DU145 cells untreated or treated with 5 μg/mL. B ANOVA: p < 0.001. *p < 0.01, Tukey HSD test compared with untreated PC3 cells. Results are expressed as mean ± SD. C, D Elisa assay of CXCL5 release by wild type, EV- and IL30 gene-transfected DU145 (C) and PC3 (D) cells. ANOVA: p < 0.0001. *p < 0.01, Tukey HSD test compared with WT and EV-transfected DU145 cells. Results are expressed as mean ± SD. E Cytofluorimetric analyses of CXCR2 expression in PC3 and DU145 cells. Red lines: isotype control. Experiments were performed in triplicate. F, G MTT assay of DU145 (F) and PC3 (G) cells, untreated (0.0 μg/mL) or treated with anti-CXCL5 Abs (0.2, 0.5, 1.0 μg/mL in DU145; 0.25, 0.80, 1.50 μg/mL in PC3). (F) ANOVA: p < 0.0001. *p < 0.01, Tukey HSD test compared with 0.0 and 0.2 μg/mL. (G) ANOVA: p < 0.0001. *p < 0.01, Tukey HSD test compared with 0.0 µg/mL. **p < 0.01, Tukey HSD test compared with 0.0 and 0.25 μg/mL. Results are expressed as mean ± SD. H, I MTT assay of DU145 (H) and PC3 (I) cells, untreated (0.0 ng/mL) or treated with rhCXCL5 (5, 7, 10, ng/mL in DU145; 5, 10, 30, 50 ng/mL in PC3). H ANOVA: p < 0.0001. *p < 0.01, Tukey HSD test compared with 0 ng/mL. **p < 0.05, Tukey HSD test compared with 0 and 5 ng/mL. I ANOVA: p < 0.0001. *p < 0.01, Tukey HSD test compared with 0 ng/mL. **p < 0.01, Tukey HSD test compared with 0 and 5 ng/mL. ***p < 0.01, Tukey HSD test compared with 0, 5 and 10 ng/mL. Results are expressed as mean ± SD. J, K MTT assay of wild type and IL30 gene-transfected DU145 (J) and PC3 (K) cells, untreated (0.0 μg/mL), or treated with anti-CXCL5 Abs (0.5 μg/mL and 0.80 μg/mL, respectively). ANOVA: p < 0.0001. *p < 0.01, Tukey HSD test compared with wild type cells. **p < 0.01, Tukey HSD test compared with wild type and IL30 gene-transfected cells. Results are expressed as mean ± SD. L Kaplan–Meier curves representing, for each time point, the fraction of surviving PC patients, from the PanCancer collection, classified, based on mRNA expression levels in tumor samples, as IL30 mRNAHigh (n.16/494) and IL30 mRNAMod (n.478/494). Log-rank test, p = 0.01. M Kaplan–Meier curves representing, for each time point, the fraction of surviving PC patients, from the PanCancer collection, classified, based on mRNA expression levels in tumor samples, as SOCS3 mRNAMod (n.476/493) and SOCS3 mRNALow (n.17/493). Log-rank test, p = 0.04. N Expression of IL30 (a, b) and SOCS3 (c, d) in PC tissues obtained from patients with (IL30PosSOCS3Neg) or without (IL30NegSOCS3Pos) biochemical recurrence (BCR). Magnification: × 630. O Kaplan–Meier curves representing, for each time point, the fraction of surviving PC patients classified, based on IL30 and SOCS3 expression in both tumor cells and infiltrating leukocytes, as IL30PosSOCS3NegPC (n.29), IL30PosSOCS3PosPC (n.18), IL30NegSOCS3NegPC (n.49) and IL30NegSOCS3PosPC (n. 67). Log-rank test, p < 0.001

Similar articles

Cited by

References

    1. GBD 2017 Disease and Injury Incidence and Prevalence Collaborators Global, regional, and national incidence, prevalence, and years lived with disability for 354 diseases and injuries for 195 countries and territories, 1990–2017: a systematic analysis for the Global Burden of Disease Study 2017. Lancet. 2018;392(10159):1789–1858. doi: 10.1016/S0140-6736(18)32279-7. - DOI - PMC - PubMed
    1. Vitkin N, Nersesian S, Siemens DR, Koti M. The tumor immune contexture of prostate cancer. Front Immunol. 2019;10:603. doi: 10.3389/fimmu.2019.00603. - DOI - PMC - PubMed
    1. Di Meo S, Airoldi I, Sorrentino C, Zorzoli A, Esposito S, Di Carlo E. Interleukin-30 expression in prostate cancer and its draining lymph nodes correlates with advanced grade and stage. Clin Cancer Res. 2014;20(3):585–594. doi: 10.1158/1078-0432.CCR-13-2240. - DOI - PubMed
    1. Sorrentino C, Ciummo SL, Cipollone G, Caputo S, Bellone M, Di Carlo E. Interleukin-30/IL27p28 shapes prostate cancer stem-like cell behavior and is critical for tumor onset and metastasization. Cancer Res. 2018;78(10):2654–2668. doi: 10.1158/0008-5472.CAN-17-3117. - DOI - PubMed
    1. Pflanz S, Timans JC, Cheung J, Rosales R, Kanzler H, Gilbert J, Hibbert L, Churakova T, Travis M, Vaisberg E, et al. IL-27, a heterodimeric cytokine composed of EBI3 and p28 protein, induces proliferation of naive CD4+ T cells. Immunity. 2002;16(6):779–790. doi: 10.1016/S1074-7613(02)00324-2. - DOI - PubMed

Publication types

MeSH terms