

A unified global genotyping framework of dengue virus serotype-1 for a stratified coordinated surveillance strategy of dengue epidemics
- PMID: 36224651
- PMCID: PMC9556283
- DOI: 10.1186/s40249-022-01024-5
A unified global genotyping framework of dengue virus serotype-1 for a stratified coordinated surveillance strategy of dengue epidemics
Abstract
Background: Dengue is the fastest spreading arboviral disease, posing great challenges on global public health. A reproduceable and comparable global genotyping framework for contextualizing spatiotemporal epidemiological data of dengue virus (DENV) is essential for research studies and collaborative surveillance.
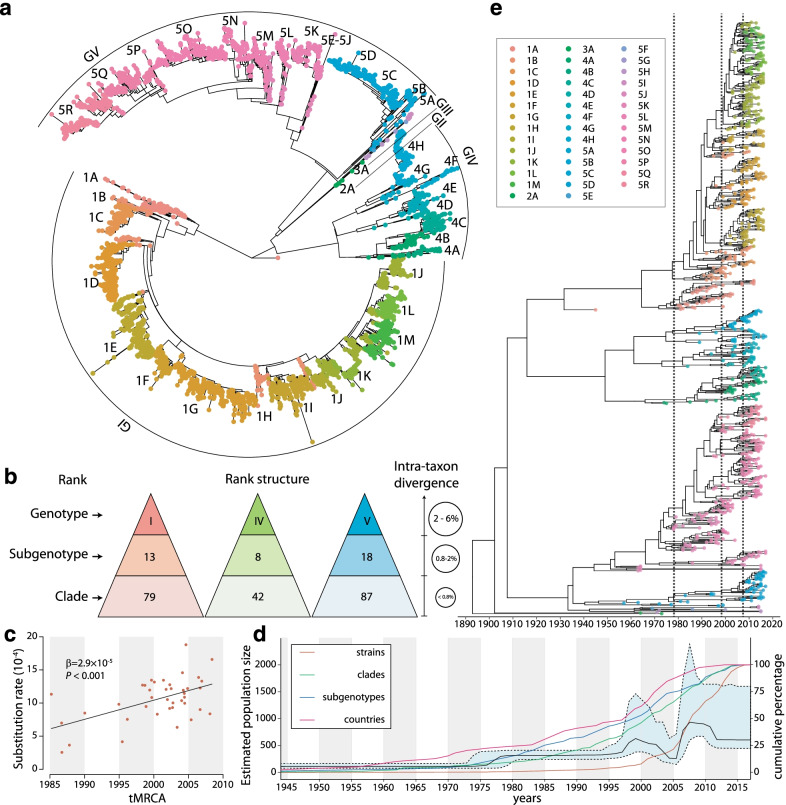
Methods: Targeting DENV-1 spreading prominently in recent decades, by reconciling all qualified complete E gene sequences of 5003 DENV-1 strains with epidemiological information from 78 epidemic countries/areas ranging from 1944 to 2018, we established and characterized a unified global high-resolution genotyping framework using phylogenetics, population genetics, phylogeography, and phylodynamics.
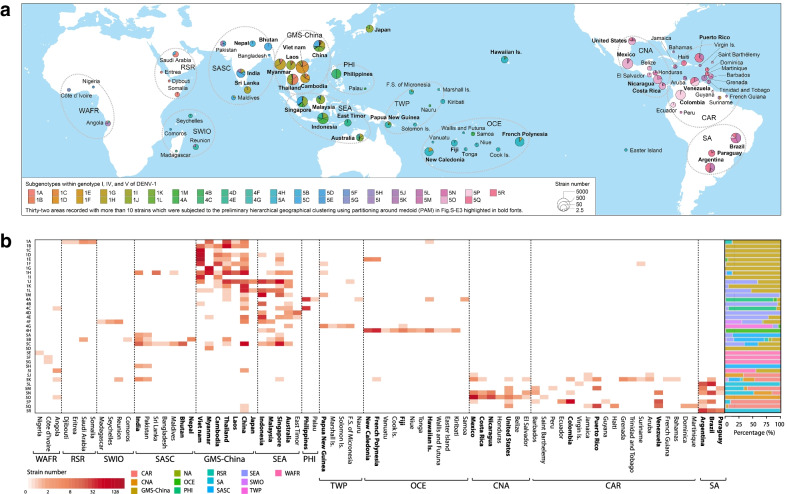
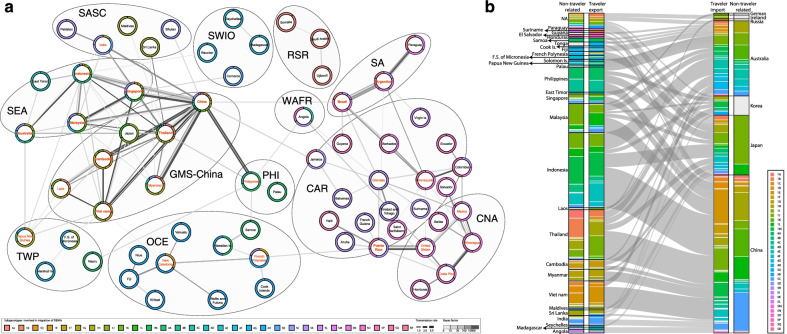
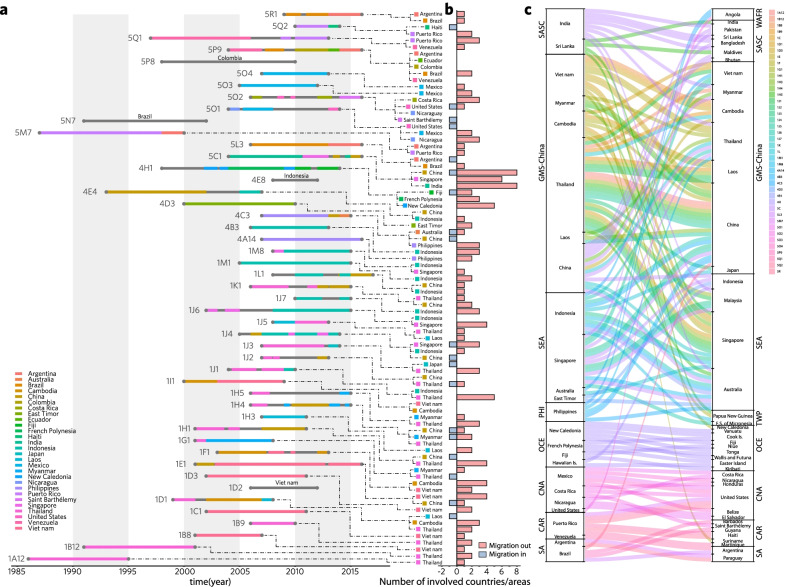
Results: The defined framework was discriminated with three hierarchical layers of genotype, subgenotype and clade with respective mean pairwise distances 2-6%, 0.8-2%, and ≤ 0.8%. The global epidemic patterns of DENV-1 showed strong geographic constraints representing stratified spatial-genetic epidemic pairs of Continent-Genotype, Region-Subgenotype and Nation-Clade, thereby identifying 12 epidemic regions which prospectively facilitates the region-based coordination. The increasing cross-transmission trends were also demonstrated. The traditional endemic countries such as Thailand, Vietnam and Indonesia displayed as persisting dominant source centers, while the emerging epidemic countries such as China, Australia, and the USA, where dengue outbreaks were frequently triggered by importation, showed a growing trend of DENV-1 diffusion. The probably hidden epidemics were found especially in Africa and India. Then, our framework can be utilized in an accurate stratified coordinated surveillance based on the defined viral population compositions. Thereby it is prospectively valuable for further hampering the ongoing transition process of epidemic to endemic, addressing the issue of inadequate monitoring, and warning us to be concerned about the cross-national, cross-regional, and cross-continental diffusions of dengue, which can potentially trigger large epidemics.
Conclusions: The framework and its utilization in quantitatively assessing DENV-1 epidemics has laid a foundation and re-unveiled the urgency for establishing a stratified coordinated surveillance platform for blocking global spreading of dengue. This framework is also expected to bridge classical DENV-1 genotyping with genomic epidemiology and risk modeling. We will promote it to the public and update it periodically.
Keywords: Dengue virus serotype-1 (DENV-1); Global genotyping framework; Molecular epidemiology; Molecular surveillance; Phylogeography; Population structure.
© 2022. The Author(s).
Conflict of interest statement
The authors declare that they have no competing interests.
Figures
Similar articles
-
Phylodynamics unveils invading and diffusing patterns of dengue virus serotype-1 in Guangdong, China from 1990 to 2019 under a global genotyping framework.Infect Dis Poverty. 2024 Jun 11;13(1):43. doi: 10.1186/s40249-024-01211-6. Infect Dis Poverty. 2024. PMID: 38863070 Free PMC article.
-
Analysis of Dengue Serotype 4 in Sri Lanka during the 2012-2013 Dengue Epidemic.Am J Trop Med Hyg. 2017 Jul;97(1):130-136. doi: 10.4269/ajtmh.16-0540. Am J Trop Med Hyg. 2017. PMID: 28719296 Free PMC article.
-
Detection of genotype-1 of dengue virus serotype 3 for the first time and complete genome analysis of dengue viruses during the 2018 epidemic in Mandalay, Upper Myanmar.PLoS One. 2021 Jun 4;16(6):e0251314. doi: 10.1371/journal.pone.0251314. eCollection 2021. PLoS One. 2021. PMID: 34086703 Free PMC article.
-
Dengue viruses circulating in Indonesia: A systematic review and phylogenetic analysis of data from five decades.Rev Med Virol. 2019 Jul;29(4):e2037. doi: 10.1002/rmv.2037. Epub 2019 May 16. Rev Med Virol. 2019. PMID: 31099110
-
Understanding dengue virus evolution to support epidemic surveillance and counter-measure development.Infect Genet Evol. 2018 Aug;62:279-295. doi: 10.1016/j.meegid.2018.04.032. Epub 2018 Apr 25. Infect Genet Evol. 2018. PMID: 29704626 Free PMC article. Review.
Cited by
-
Global Circulation Dynamics and Its Determinants of Dengue Virus: A Network Evolution and Model Study from 1990 to 2019.Viruses. 2025 Aug 4;17(8):1078. doi: 10.3390/v17081078. Viruses. 2025. PMID: 40872792 Free PMC article.
-
Unraveling Dengue Virus Diversity in Asia: An Epidemiological Study through Genetic Sequences and Phylogenetic Analysis.Viruses. 2024 Jun 28;16(7):1046. doi: 10.3390/v16071046. Viruses. 2024. PMID: 39066210 Free PMC article. Review.
-
Assessing the global dengue burden: Incidence, mortality, and disability trends over three decades.PLoS Negl Trop Dis. 2025 Mar 12;19(3):e0012932. doi: 10.1371/journal.pntd.0012932. eCollection 2025 Mar. PLoS Negl Trop Dis. 2025. PMID: 40072961 Free PMC article.
-
Dominance of DENV-1 and Flavivirus Serological Cross-Reactivity During the 2016 Dengue Outbreak in Vietnam.J Med Virol. 2025 Aug;97(8):e70569. doi: 10.1002/jmv.70569. J Med Virol. 2025. PMID: 40838976 Free PMC article.
-
Phylodynamics unveils invading and diffusing patterns of dengue virus serotype-1 in Guangdong, China from 1990 to 2019 under a global genotyping framework.Infect Dis Poverty. 2024 Jun 11;13(1):43. doi: 10.1186/s40249-024-01211-6. Infect Dis Poverty. 2024. PMID: 38863070 Free PMC article.
References
MeSH terms
Grants and funding
LinkOut - more resources
Full Text Sources
Medical
