

Quantitative measurement of resistance force and subsequent attenuation during passive isokinetic extension of the wrist in patients with mild to moderate spasticity after stroke
- PMID: 36224659
- PMCID: PMC9559851
- DOI: 10.1186/s12984-022-01087-3
Quantitative measurement of resistance force and subsequent attenuation during passive isokinetic extension of the wrist in patients with mild to moderate spasticity after stroke
Abstract
Background: Spasticity is evaluated by measuring the increased resistance to passive movement, primarily by manual methods. Few options are available to measure spasticity in the wrist more objectively. Furthermore, no studies have investigated the force attenuation following increased resistance. The aim of this study was to conduct a safe quantitative evaluation of wrist passive extension stiffness in stroke survivors with mild to moderate spastic paresis using a custom motor-controlled device. Furthermore, we wanted to clarify whether the changes in the measured values could quantitatively reflect the spastic state of the flexor muscles involved in the wrist stiffness of the patients.
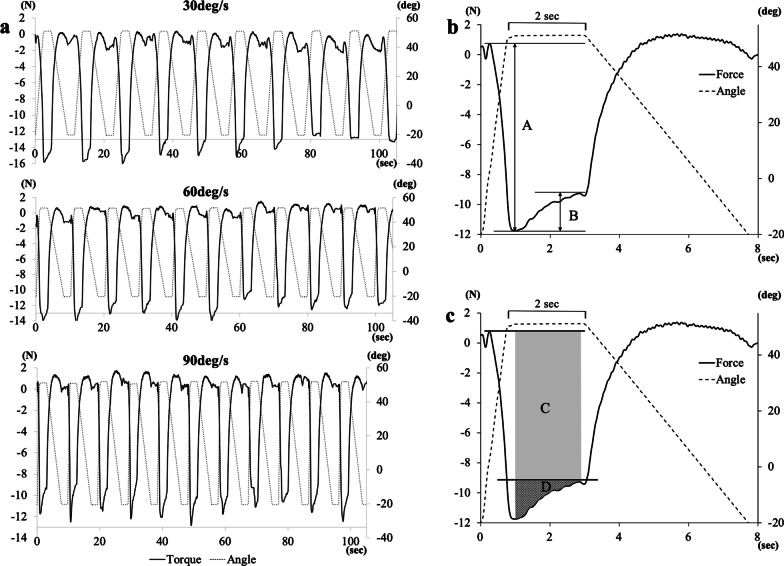
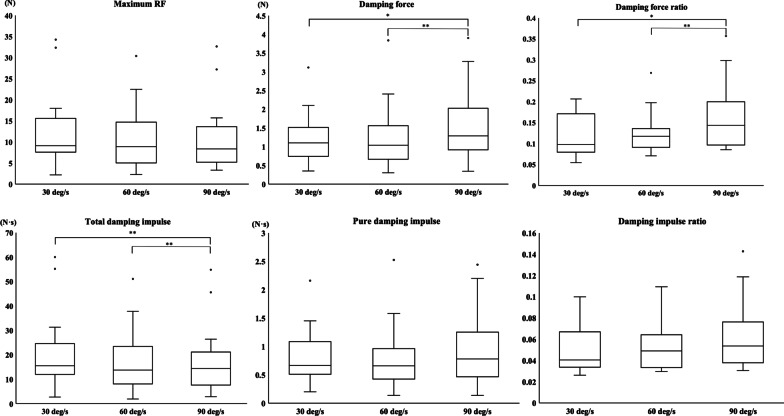
Materials and methods: Resistance forces were measured in 17 patients during repetitive passive extension of the wrist at velocities of 30, 60, and 90 deg/s. The Modified Ashworth Scale (MAS) in the wrist and finger flexors was also assessed by two skilled therapists and their scores were averaged (i.e., average MAS) for analysis. Of the fluctuation of resistance, we focused on the damping just after the peak forces and used these for our analysis. A repeated measures analysis of variance was conducted to assess velocity-dependence. Correlations between MAS and damping parameters were analyzed using Spearman's rank correlation.
Results: The damping force and normalized value calculated from damping part showed significant velocity-dependent increases. There were significant correlations (ρ = 0.53-0.56) between average MAS for wrist and the normalized value of the damping part at 90 deg/s. The correlations became stronger at 60 deg/s and 90 deg/s when the MAS for finger flexors was added to that for wrist flexors (ρ = 0.65-0.68).
Conclusions: This custom-made isokinetic device could quantitatively evaluate spastic changes in the wrist and finger flexors simultaneously by focusing on the damping part, which may reflect the decrease in resistance we perceive when manually assessing wrist spasticity using MAS. Trial registration UMIN Clinical Trial Registry, as UMIN000030672, on July 4, 2018.
Keywords: Biomechanics; Finger; Force attenuation; Muscle spasticity; Objective assessment; Rehabilitation; Resistance force; Stroke; Wrist.
© 2022. The Author(s).
Conflict of interest statement
The author(s) declare that there are no potential competing interests with respect to the research, authorship, and/or publication of this article.
Figures


Similar articles
-
Adhesive taping vs. daily manual muscle stretching and splinting after botulinum toxin type A injection for wrist and fingers spastic overactivity in stroke patients: a randomized controlled trial.Clin Rehabil. 2015 Jan;29(1):50-8. doi: 10.1177/0269215514537915. Epub 2014 Jun 10. Clin Rehabil. 2015. PMID: 24917588 Clinical Trial.
-
Effects of a 3D-printed orthosis compared to a low-temperature thermoplastic plate orthosis on wrist flexor spasticity in chronic hemiparetic stroke patients: a randomized controlled trial.Clin Rehabil. 2020 Feb;34(2):194-204. doi: 10.1177/0269215519885174. Epub 2019 Nov 5. Clin Rehabil. 2020. PMID: 31686529 Clinical Trial.
-
Tibetan Medicated Bathing Therapy for Patients With Post-stroke Limb Spasticity: A Randomized Controlled Clinical Trial.J Am Med Dir Assoc. 2020 Mar;21(3):374-380.e4. doi: 10.1016/j.jamda.2019.10.018. Epub 2019 Dec 25. J Am Med Dir Assoc. 2020. PMID: 31882240 Clinical Trial.
-
A single group, pretest-posttest clinical trial for the effects of dry needling on wrist flexors spasticity after stroke.NeuroRehabilitation. 2017;40(3):325-336. doi: 10.3233/NRE-161420. NeuroRehabilitation. 2017. PMID: 28222554 Clinical Trial.
-
A Systematic Review and Meta-Analysis on the Use of Repetitive Transcranial Magnetic Stimulation for Spasticity Poststroke.PM R. 2018 Mar;10(3):293-302. doi: 10.1016/j.pmrj.2017.10.001. Epub 2017 Oct 16. PM R. 2018. PMID: 29045857
References
Publication types
MeSH terms
LinkOut - more resources
Full Text Sources
Medical
