

Mortality-Air Pollution Associations in Low Exposure Environments (MAPLE): Phase 2
- PMID: 36224709
- PMCID: PMC9556709
Mortality-Air Pollution Associations in Low Exposure Environments (MAPLE): Phase 2
Abstract
Introduction: Mortality is associated with long-term exposure to fine particulate matter (particulate matter ≤2.5 μm in aerodynamic diameter; PM2.5), although the magnitude and form of these associations remain poorly understood at lower concentrations. Knowledge gaps include the shape of concentration-response curves and the lowest levels of exposure at which increased risks are evident and the occurrence and extent of associations with specific causes of death. Here, we applied improved estimates of exposure to ambient PM2.5 to national population-based cohorts in Canada, including a stacked cohort of 7.1 million people who responded to census year 1991, 1996, or 2001. The characterization of the shape of the concentration-response relationship for nonaccidental mortality and several specific causes of death at low levels of exposure was the focus of the Mortality-Air Pollution Associations in Low Exposure Environments (MAPLE) Phase 1 report. In the Phase 1 report we reported that associations between outdoor PM2.5 concentrations and nonaccidental mortality were attenuated with the addition of ozone (O3) or a measure of gaseous pollutant oxidant capacity (Ox), which was estimated from O3 and nitrogen dioxide (NO2) concentrations. This was motivated by our interests in understanding both the effects air pollutant mixtures may have on mortality and also the role of O3 as a copollutant that shares common sources and precursor emissions with those of PM2.5. In this Phase 2 report, we further explore the sensitivity of these associations with O3 and Ox, evaluate sensitivity to other factors, such as regional variation, and present ambient PM2.5 concentration-response relationships for specific causes of death.
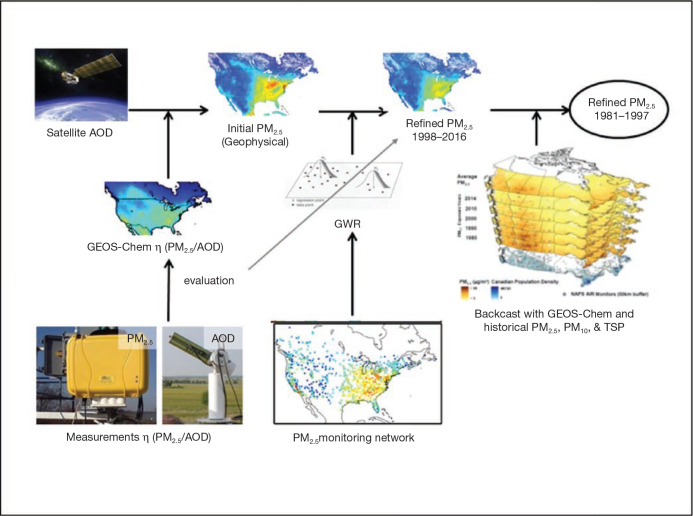
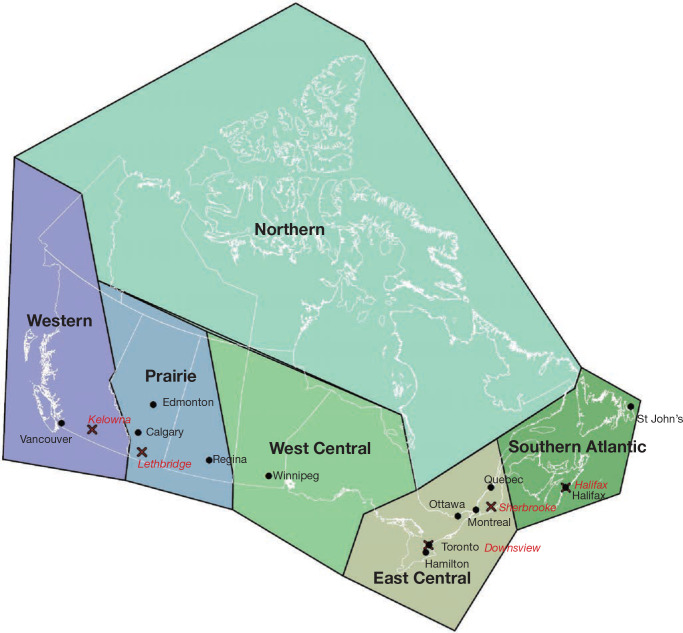
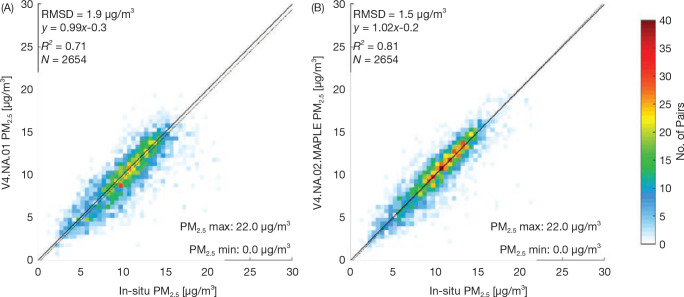
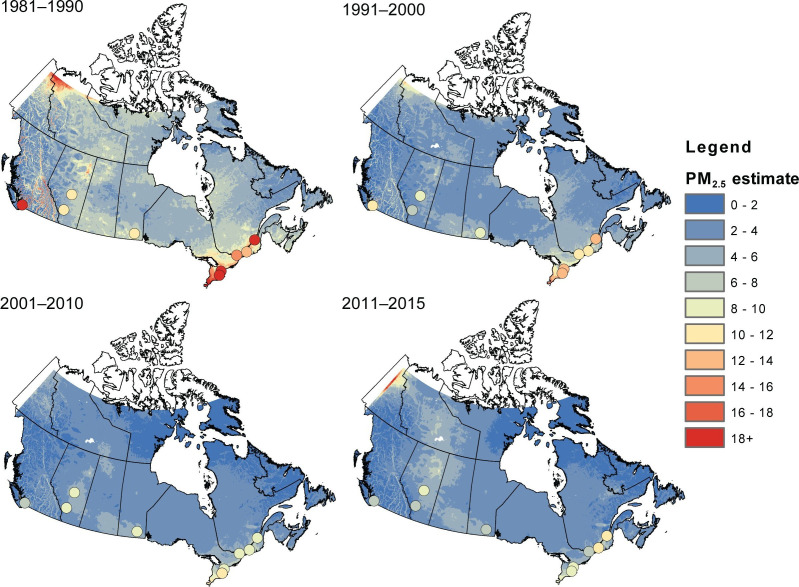
Methods: PM2.5 concentrations were estimated at 1 km2 spatial resolution across North America using remote sensing of aerosol optical depth (AOD) combined with chemical transport model (GEOS-Chem) simulations of the AOD:surface PM2.5 mass concentration relationship, land use information, and ground monitoring. These estimates were informed and further refined with collocated measurements of PM2.5 and AOD, including targeted measurements in areas of low PM2.5 concentrations collected at five locations across Canada. Ground measurements of PM2.5 and total suspended particulate matter (TSP) mass concentrations from 1981 to 1999 were used to backcast remote-sensing-based estimates over that same time period, resulting in modeled annual surfaces from 1981 to 2016.
Annual exposures to PM2.5 were then estimated for subjects in several national population-based Canadian cohorts using residential histories derived from annual postal code entries in income tax files. These cohorts included three census-based cohorts: the 1991 Canadian Census Health and Environment Cohort (CanCHEC; 2.5 million respondents), the 1996 CanCHEC (3 million respondents), the 2001 CanCHEC (3 million respondents), and a Stacked CanCHEC where duplicate records of respondents were excluded (Stacked CanCHEC; 7.1 million respondents). The Canadian Community Health Survey (CCHS) mortality cohort (mCCHS), derived from several pooled cycles of the CCHS (540,900 respondents), included additional individual information about health behaviors. Follow-up periods were completed to the end of 2016 for all cohorts. Cox proportional hazard ratios (HRs) were estimated for nonaccidental and other major causes of death using a 10-year moving average exposure and 1-year lag. All models were stratified by age, sex, immigrant status, and where appropriate, census year or survey cycle. Models were further adjusted for income adequacy quintile, visible minority status, Indigenous identity, educational attainment, labor-force status, marital status, occupation, and ecological covariates of community size, airshed, urban form, and four dimensions of the Canadian Marginalization Index (Can-Marg; instability, deprivation, dependency, and ethnic concentration). The mCCHS analyses were also adjusted for individual-level measures of smoking, alcohol consumption, fruit and vegetable consumption, body mass index (BMI), and exercise behavior.
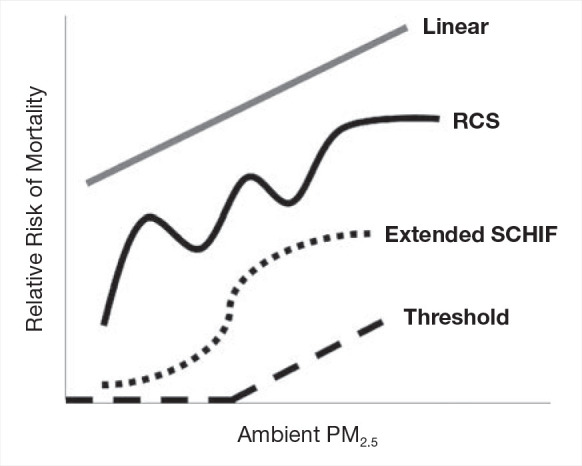
In addition to linear models, the shape of the concentration-response function was investigated using restricted cubic splines (RCS). The number of knots were selected by minimizing the Bayesian Information Criterion (BIC). Two additional models were used to examine the association between nonaccidental mortality and PM2.5. The first is the standard threshold model defined by a transformation of concentration equaling zero if the concentration was less than a specific threshold value and concentration minus the threshold value for concentrations above the threshold. The second additional model was an extension of the Shape Constrained Health Impact Function (SCHIF), the eSCHIF, which converts RCS predictions into functions potentially more suitable for use in health impact assessments. Given the RCS parameter estimates and their covariance matrix, 1,000 realizations of the RCS were simulated at concentrations from the minimum to the maximum concentration, by increments of 0.1 μg/m3. An eSCHIF was then fit to each of these RCS realizations. Thus, 1,000 eSCHIF predictions and uncertainty intervals were determined at each concentration within the total range.
Sensitivity analyses were conducted to examine associations between PM2.5 and mortality when in the presence of, or stratified by tertile of, O3 or Ox. Additionally, associations between PM2.5 and mortality were assessed for sensitivity to lower concentration thresholds, where person-years below a threshold value were assigned the mean exposure within that group. We also examined the sensitivity of the shape of the nonaccidental mortality-PM2.5 association to removal of person-years at or above 12 μg/m3 (the current U.S. National Ambient Air Quality Standard) and 10 μg/m3 (the current Canadian and former [2005] World Health Organization [WHO] guideline, and current WHO Interim Target-4). Finally, differences in the shapes of PM2.5-mortality associations were assessed across broad geographic regions (airsheds) within Canada.
Results: The refined PM2.5 exposure estimates demonstrated improved performance relative to estimates applied previously and in the MAPLE Phase 1 report, with slightly reduced errors, including at lower ranges of concentrations (e.g., for PM2.5 <10 μg/m3).
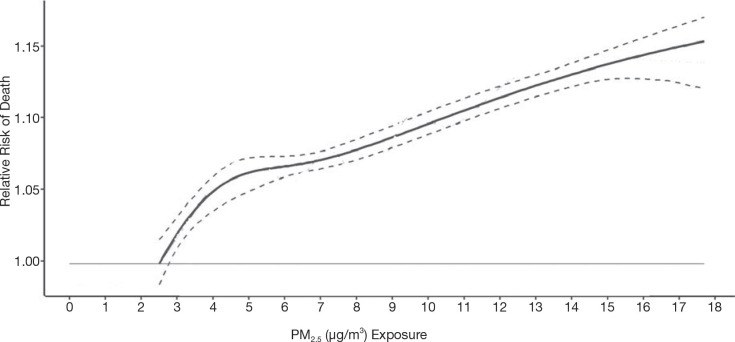
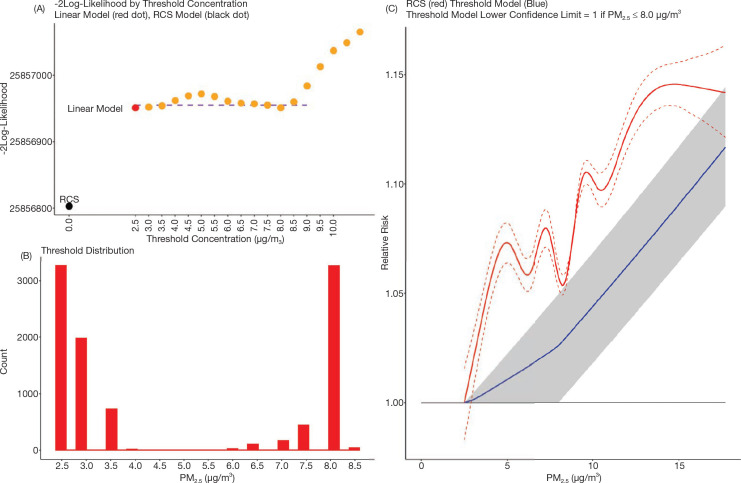
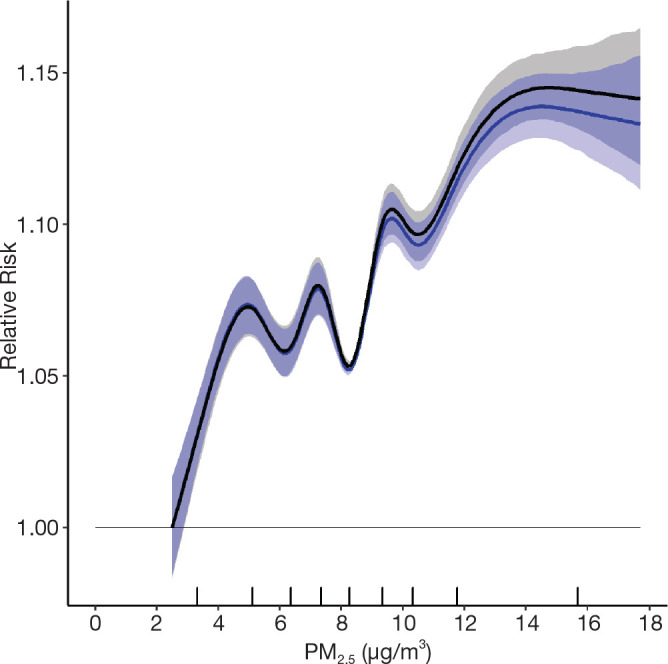
Positive associations between outdoor PM2.5 concentrations and nonaccidental mortality were consistently observed in all cohorts. In the Stacked CanCHEC analyses (1.3 million deaths), each 10-μg/m3 increase in outdoor PM2.5 concentration corresponded to an HR of 1.084 (95% confidence interval [CI]: 1.073 to 1.096) for nonaccidental mortality. For an interquartile range (IQR) increase in PM2.5 mass concentration of 4.16 μg/m3 and for a mean annual nonaccidental death rate of 92.8 per 10,000 persons (over the 1991-2016 period for cohort participants ages 25-90), this HR corresponds to an additional 31.62 deaths per 100,000 people, which is equivalent to an additional 7,848 deaths per year in Canada, based on the 2016 population. In RCS models, mean HR predictions increased from the minimum concentration of 2.5 μg/m3 to 4.5 μg/m3, flattened from 4.5 μg/m3 to 8.0 μg/m3, then increased for concentrations above 8.0 μg/m3. The threshold model results reflected this pattern with -2 log-likelihood values being equal at 2.5 μg/m3 and 8.0 μg/m3. However, mean threshold model predictions monotonically increased over the concentration range with the lower 95% CI equal to one from 2.5 μg/m3 to 8.0 μg/m3. The RCS model was a superior predictor compared with any of the threshold models, including the linear model.
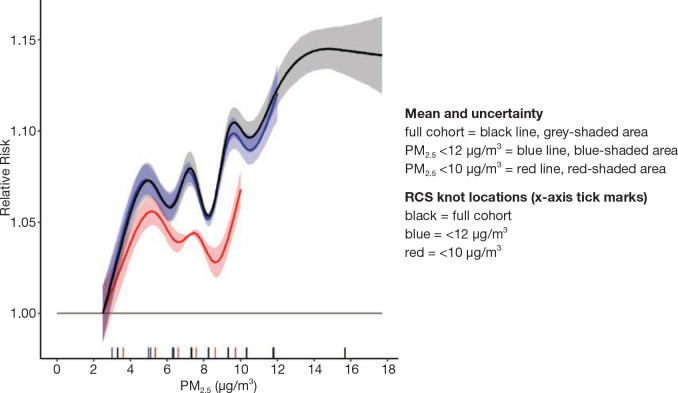
In the mCCHS cohort analyses inclusion of behavioral covariates did not substantially change the results for both linear and nonlinear models. We examined the sensitivity of the shape of the nonaccidental mortality-PM2.5 association to removal of person-years at or above the current U.S. and Canadian standards of 12 μg/m3 and 10 μg/m3, respectively. In the full cohort and in both restricted cohorts, a steep increase was observed from the minimum concentration of 2.5 μg/m3 to 5 μg/m3. For the full cohort and the <12 μg/m3 cohort the relationship flattened over the 5 to 9 μg/m3 range and then increased above 9 μg/m3. A similar increase was observed for the <10 μg/m3 cohort followed by a clear decline in the magnitude of predictions over the 5 to 9 μg/m3 range and an increase above 9 μg/m3. Together these results suggest that a positive association exists for concentrations >9 μg/m3 with indications of adverse effects on mortality at concentrations as low as 2.5 μg/m3.
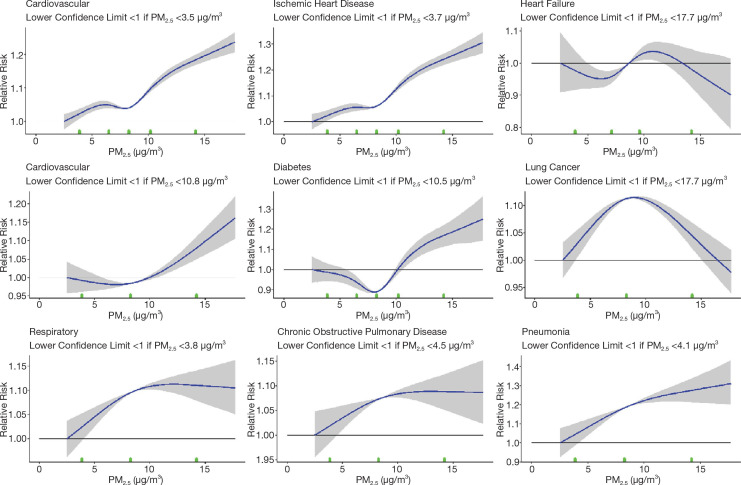
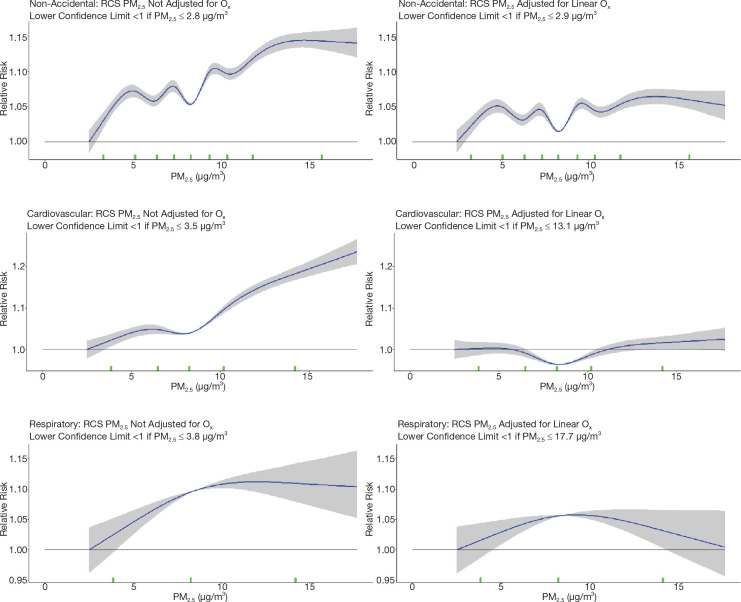
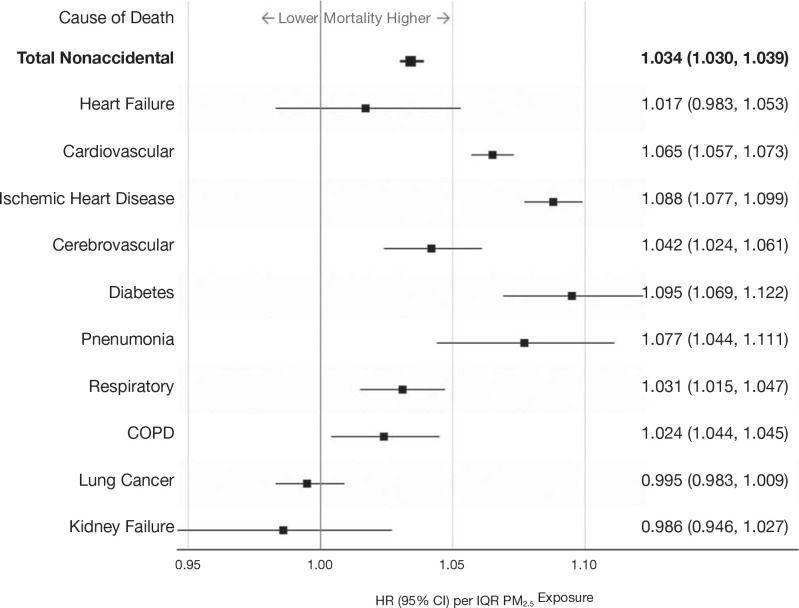
Among the other causes of death examined, PM2.5 exposures were consistently associated with an increased hazard of mortality due to ischemic heart disease, respiratory disease, cardiovascular disease, and diabetes across all cohorts. Associations were observed in the Stacked CanCHEC but not in all other cohorts for cerebrovascular disease, pneumonia, and chronic obstructive pulmonary disease (COPD) mortality. No significant associations were observed between mortality and exposure to PM2.5 for heart failure, lung cancer, and kidney failure.
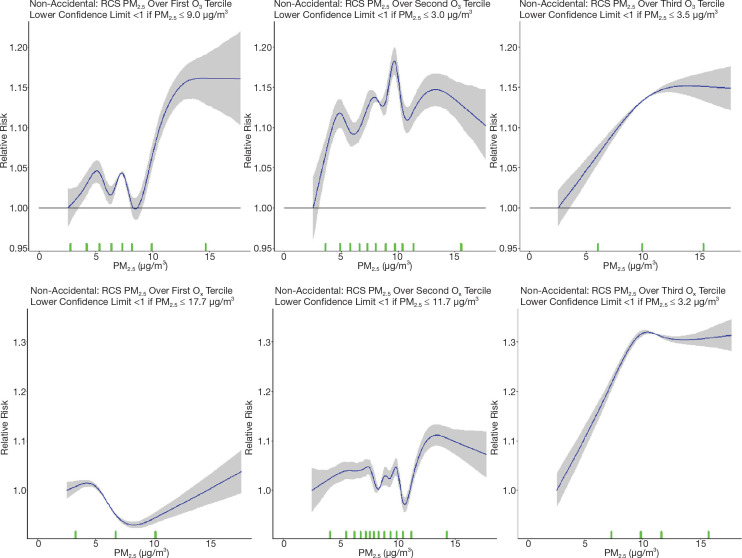
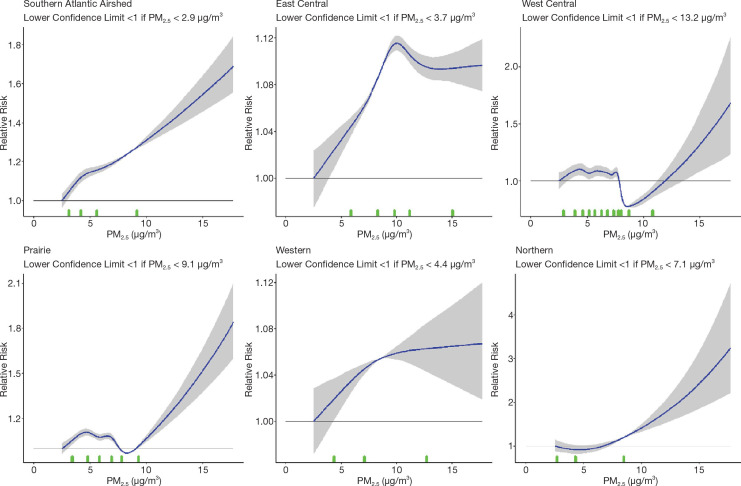
In sensitivity analyses, the addition of O3 and Ox attenuated associations between PM2.5 and mortality. When analyses were stratified by tertiles of copollutants, associations between PM2.5 and mortality were only observed in the highest tertile of O3 or Ox. Across broad regions of Canada, linear HR estimates and the shape of the eSCHIF varied substantially, possibly reflecting underlying differences in air pollutant mixtures not characterized by PM2.5 mass concentrations or the included gaseous pollutants. Sensitivity analyses to assess regional variation in population characteristics and access to healthcare indicated that the observed regional differences in concentration-mortality relationships, specifically the flattening of the concentration-mortality relationship over the 5 to 9 μg/m3 range, was not likely related to variation in the makeup of the cohort or its access to healthcare, lending support to the potential role of spatially varying air pollutant mixtures not sufficiently characterized by PM2.5 mass concentrations.
Conclusions: In several large, national Canadian cohorts, including a cohort of 7.1 million unique census respondents, associations were observed between exposure to PM2.5 with nonaccidental mortality and several specific causes of death. Associations with nonaccidental mortality were observed using the eSCHIF methodology at concentrations as low as 2.5 μg/m3, and there was no clear evidence in the observed data of a lower threshold, below which PM2.5 was not associated with nonaccidental mortality.
© 2022 Health Effects Institute. All rights reserved.
Figures


Similar articles
-
Mortality-Air Pollution Associations in Low-Exposure Environments (MAPLE): Phase 1.Res Rep Health Eff Inst. 2019 Nov;2019(203):1-87. Res Rep Health Eff Inst. 2019. PMID: 31909580 Free PMC article.
-
Mortality and Morbidity Effects of Long-Term Exposure to Low-Level PM2.5, BC, NO2, and O3: An Analysis of European Cohorts in the ELAPSE Project.Res Rep Health Eff Inst. 2021 Sep;2021(208):1-127. Res Rep Health Eff Inst. 2021. PMID: 36106702 Free PMC article.
-
Ambient PM2.5, O₃, and NO₂ Exposures and Associations with Mortality over 16 Years of Follow-Up in the Canadian Census Health and Environment Cohort (CanCHEC).Environ Health Perspect. 2015 Nov;123(11):1180-6. doi: 10.1289/ehp.1409276. Epub 2015 Nov 1. Environ Health Perspect. 2015. PMID: 26528712 Free PMC article.
-
Assessing Adverse Health Effects of Long-Term Exposure to Low Levels of Ambient Air Pollution: Implementation of Causal Inference Methods.Res Rep Health Eff Inst. 2022 Jan;2022(211):1-56. Res Rep Health Eff Inst. 2022. PMID: 36193708 Free PMC article. Review.
-
Long-term exposure to NO2 and O3 and all-cause and respiratory mortality: A systematic review and meta-analysis.Environ Int. 2020 Nov;144:105998. doi: 10.1016/j.envint.2020.105998. Epub 2020 Oct 5. Environ Int. 2020. PMID: 33032072 Free PMC article.
Cited by
-
Identification of Neighborhood Hotspots via the Cumulative Hazard Index: Results From a Community-Partnered Low-Cost Sensor Deployment.Geohealth. 2024 Feb 14;8(2):e2023GH000935. doi: 10.1029/2023GH000935. eCollection 2024 Feb. Geohealth. 2024. PMID: 38361590 Free PMC article.
-
Nano carbon-modified air purification filters for removal and detection of particulate matters from ambient air.Sci Rep. 2024 Jan 5;14(1):621. doi: 10.1038/s41598-023-50902-x. Sci Rep. 2024. PMID: 38182636 Free PMC article.
-
The Air Pollution Human Health Burden in Different Future Scenarios That Involve the Mitigation of Near-Term Climate Forcers, Climate and Land-Use.Geohealth. 2023 Aug 15;7(8):e2023GH000812. doi: 10.1029/2023GH000812. eCollection 2023 Aug. Geohealth. 2023. PMID: 37593109 Free PMC article.
-
The Impact of Socioeconomic Factors on Long-Term Mortality Associated With Exposure to PM2.5: A Systematic Literature Review and Meta-Analysis.Public Health Rev. 2025 Mar 26;46:1607290. doi: 10.3389/phrs.2025.1607290. eCollection 2025. Public Health Rev. 2025. PMID: 40206455 Free PMC article. Review.
-
Assessing Adverse Health Effects of Long-Term Exposure to Low Levels of Ambient Air Pollution: The HEI Experience and What's Next?Environ Sci Technol. 2024 Jul 23;58(29):12767-12783. doi: 10.1021/acs.est.3c09745. Epub 2024 Jul 11. Environ Sci Technol. 2024. PMID: 38991107 Free PMC article. Review.
References
-
- Apte JS, Marshall JD, Cohen AJ, Brauer M. 2015. Addressing global mortality from ambient PM2.5. Environ Sci Technol 49:8057–8066. - PubMed
-
- Beelen R, Raaschou-Nielsen O, Stafoggia M, Jovanovic Andersen Z, Weinmayr G, Hoffman B, et al. . 2014. Effects of long-term exposure to air pollution on natural-cause mortality: An analysis of 22 European cohorts within the multicenter ESCAPE project. Lancet 383:785–795. - PubMed
-
- Bérard-Chagnon J. 2017. Comparison of place of residence between the T1 Family File and the Census: Evaluation using record linkage. Statistics Canada Demographics Documents, Catalogue no. 91F0015M —No. 13ISSN 205-996X ISBN 978-0-660-08112-0.
-
- Bissonnette P. 2019. SYRUP: A Novel Inversion Method for AerosolSize-Distribution Properties from Optical and Chemical Measurements of PM2.5. MSc thesis, Dalhousie University, Halifax, Canada. Available: https://dalspace.library.dal.ca/xmlui/handle/10222/76202 [accessed 24 June 2021].
-
- Blomberg A, Mudway I, Svensson M, Hagenbjörk-Gustafsson A, Thomasson L, Helleday R, et al. . 2003. Clara cell protein as a biomarker for ozone-induced lung injury in humans. Eur Respir J22:883–888. - PubMed
Publication types
MeSH terms
Substances
LinkOut - more resources
Full Text Sources
Medical
Miscellaneous