. 2023 Jan;56(1):e13345.
doi: 10.1111/cpr.13345. Epub 2022 Oct 12.

Role of glycosphingolipid SSEA-3 and FGF2 in the stemness and lineage commitment of multilineage differentiating stress enduring (MUSE) cells

Affiliations

Role of glycosphingolipid SSEA-3 and FGF2 in the stemness and lineage commitment of multilineage differentiating stress enduring (MUSE) cells

Domenico Aprile et al. Cell Prolif. 2023 Jan.

Abstract

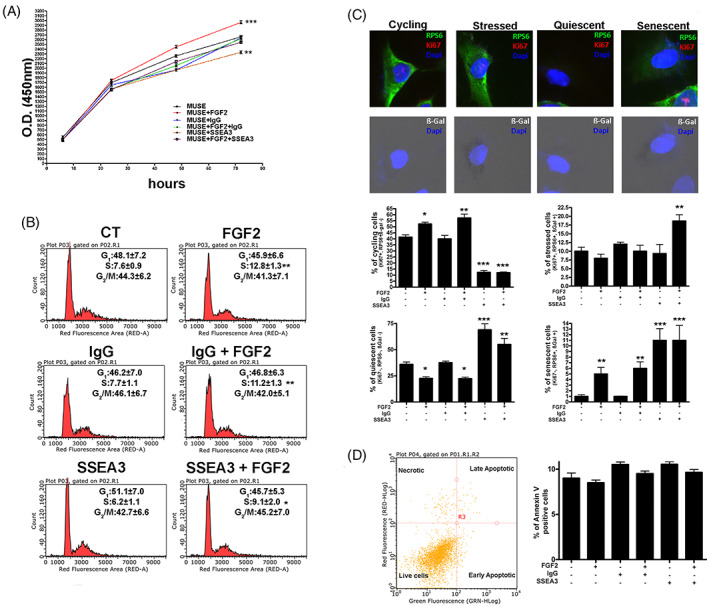
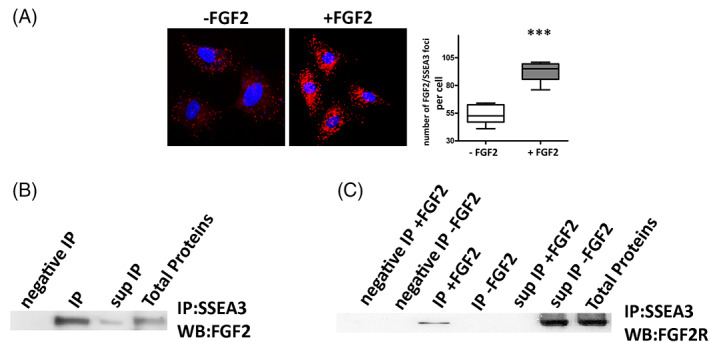
Objectives: Multilineage differentiating Stress Enduring (MUSE) cells are endogenous, stress-resistant stem cells, expressing pluripotency master genes and able to differentiate in cells of the three embryonic sheets. Stage-Specific Embryonic Antigen 3 (SSEA-3), a glycosphingolipid (GSL), is the marker for identifying MUSE cells and is used to isolate this population from mesenchymal stromal cells. GSLs modulate signal transduction by interacting with plasma membrane components. The growth factor FGF2, important for MUSE cells biology, may interact with GSLs. Specific cell surface markers represent an invaluable tool for stem cell isolation. Nonetheless their role, if any, in stem cell biology is poorly investigated. Functions of stem cells, however, depend on niche external cues, which reach cells through surface markers. We addressed the role of SSEA-3 in MUSE cell behaviour, trying to define whether SSEA-3 is just a marker or if it plays a functional role in this cell population by determining if it has any relationship with FGF2 activity.

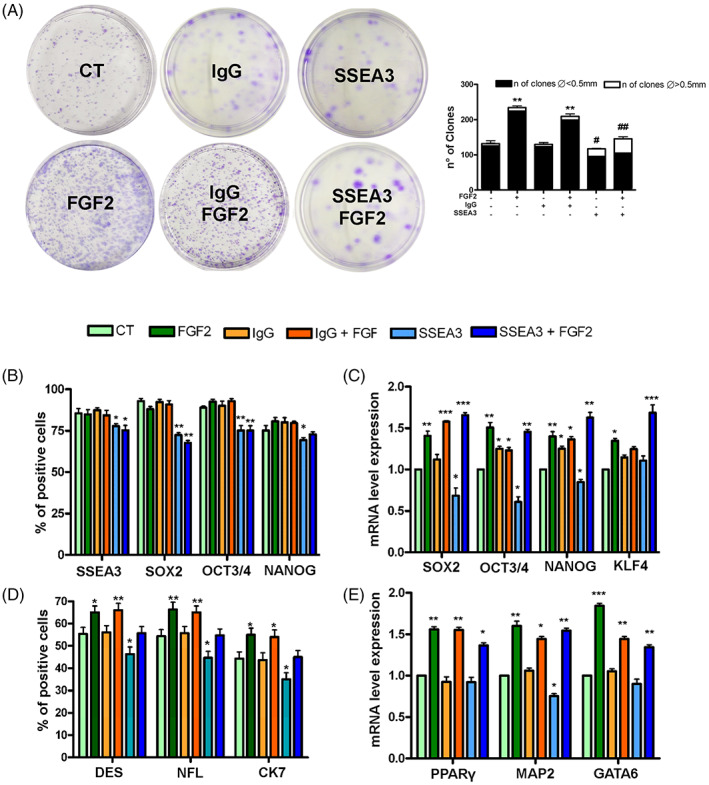
Results: We evidenced how the SSEA-3 and FGF2 cooperation affected the self-renewal and clonogenic capacity of MUSE cells. The block of SSEA-3 significantly reduced the multilineage potential of MUSE cells with production of nullipotent clones.

Conclusions: We contributed to dissecting the mechanisms underlying MUSE cell properties for establishing successful stem-cell-based therapies and the promotion of MUSE cells as a tool for the in vitro disease model.


Conflict of interest statement

The authors declare that no conflict of interests exists.

Figures

FIGURE 1
FIGURE 1
In vitro characterization of MUSE cells. (A) The picture shows a representative image of MSCs, MUSE cells and non‐MUSE cells visualized through an inverted microscope (Leica DMIL 090‐135.001). The black bar corresponds to 100 μm. (B) Expression of SSEA‐3, CD44, CD45, CD73, CD90 and CD105 surface markers measured by flow cytometry in MSCs, MUSE cells and non‐MUSE cells. (C) The pictures are representative images of immunocytochemistry for stemness markers: SSEA‐3 (red), SOX2 (red), OCT3/4 (green) and NANOG (green), performed on MSCs, MUSE cells and non‐MUSE cells. The nuclei were counterstained with DAPI (blue). The histograms show the percentage of SSEA‐3, SOX2, OCT3 and NANOG‐positive cells. Scale bars = 50 μm. (D) mRNA expression levels of stemness. The histograms show the quantitative RT‐PCR analysis of SOX2, OCT3/4, NANOG and KLF4. The mRNA levels were normalized to GAPDH mRNA expression, which was selected as an internal control. Data are expressed as fold changes with standard error (n = 5). For each gene, the expression level of MSCs is set as the baseline (the arbitrary value is 1). (E) Representative picture of ICC staining after spontaneous differentiation. Desmin (red) was used as a mesodermal marker; CK7 (red) was used as endodermal marker; NFL (red) was used as ectodermal marker. The nuclei were counterstained with DAPI (blue). The histograms show the percentage of DES, CK7 and NFL‐positive cells. (F) mRNA expression levels of meso/endo/ectodermal lineage markers. The histograms show the quantitative RT‐PCR analysis of DES (mesodermal marker), GATA6 (endodermal marker) and MAP2 (ectodermal marker). The mRNA levels were normalized to GAPDH mRNA expression, which was selected as an internal control. Histograms show expression levels in the different cell populations. For each gene, the expression level of MSCs was set as the baseline (the arbitrary value is 1). All experimental data are represented as mean ± SD of five independent replicates (n = 5). The statistical differences among MSCs cells and MUSE cells and non‐MUSE cells are indicated with * (*p < 0.05, **p < 0.01, ***p < 0.001).
FIGURE 2
FIGURE 2
Effect of treatments with FGF2 and anti‐SSEA‐3 on biological properties. (A) MUSE cells proliferation after different treatments was evaluated by Cell Counting Kit‐8 (CCK‐8) colorimetric assay. (B) Representative cell cycle analysis of the MUSE cells after different culture conditions. The percentages of different cell populations (G 1/G 0, S and G 2/M) are indicated. (C) Graphs show the percentage of cycling [Ki67(+), pRPS6(+), β‐Gal(−)), stressed (Ki67(+), pRPS6(+), β‐Gal(+)], quiescent [Ki67(−), pRPS6(−), β‐Gal(−)] and senescent [Ki67(−), pRPS6(+), β‐Gal(+)] cells in MUSE cultures after different treatments. Representative picture of ICC staining to characterize the different populations are reported. (D) Representative analysis of MUSE cells apoptosis. The assay identifies early (Annexin V+ and 7ADD−) and late (Annexin V+ and 7ADD+) apoptosis. Apoptosis is a continuous process, and we calculated the percentage of apoptosis as the sum of early and late apoptotic cells. The histogram shows the mean percentage of Annexin V‐positive cells. All experimental data are represented as mean ± SD of five independent replicates (n = 5). The statistical differences among control MUSE cells and MUSE cells with different treatments are indicated with * (*p < 0.05, **p < 0.01, ***p < 0.001).
FIGURE 3
FIGURE 3
Effect of treatments with FGF2 and anti SSEA‐3 on stemness and differentiation capacity. (A) The CFU assay performed on MUSE cells after different treatments. The number of CFU clones and their different sizes per 1000 plated cells are reported. (B) The histograms show the percentage of SSEA‐3, SOX2, OCT3/4 and NANOG‐positive cells after immunocytochemistry analysis performed on MUSE cells with different treatments. (C) mRNA expression levels of stemness genes. The histograms show the quantitative RT‐PCR analysis of SOX2, OCT3/4, NANOG and KLF4. The mRNA levels were normalized to GAPDH mRNA expression, which was selected as an internal control. For each gene, the expression level of MUSE cells is set as the baseline (the arbitrary value is 1). (D) The histograms show the percentage of DES, CK7, NF‐L‐positive cells after immunocytochemistry analysis performed on MUSE cells with different treatments. (E) The histograms show the quantitative RT‐PCR analysis of PPARγ (mesodermal marker), GATA6 (endodermal marker) and MAP2 (ectodermal marker). The mRNA levels were normalized to GAPDH mRNA expression, which was selected as an internal control. Histograms show expression levels in the different cell populations. For each gene, the expression level of MUSE cells was set as the baseline (the arbitrary value is 1). All experimental data are represented as mean ± SD of five independent replicates (n = 5). The statistical differences among control MUSE cells and MUSE cells with different treatments are indicated with * (*p < 0.05, **p < 0.01, ***p < 0.001). The statistical differences between MUSE cells with anti‐SSEA‐3 and those treated with anti‐SSEA‐3 plus FGF2 concerning the size of the colonies are indicated with # (#p < 0.05, **#p < 0.01).
FIGURE 4
FIGURE 4
Role of SSEA‐3 on MUSE single clone potency. MUSE cells grown as single clones with FGF2 or FGF2 and anti‐SSEA‐3 underwent spontaneous and cue‐induced differentiation. After that, markers of differentiation were evaluated by RT‐qPCR. Clones were grouped into four different classes (Tri‐, Bi‐, Uni‐ and Nulli‐potent) according to the number of markers that each clone expressed after spontaneous or induced differentiation. The graphs show the expression of the various differentiation markers in MUSE cells subjected to different treatments and whose differentiation was induced or spontaneous.
FIGURE 5
FIGURE 5
Binding between SSEA3, FGF2 and FGF2R. (A) Duolink PLA Fluorescence for FGF‐2 and SSEA‐3 in MUSE cells grown either in presence or in absence of FGF2. The graph shows the percentage PLA‐positive fluorescent cells. All experimental data are represented as mean ± SD of five independent replicates (n = 5). The statistical differences among MUSE cells and MUSE cells grown with FGF2 are indicated with * (***p < 0.001). (B) MUSE cell lysates were obtained and immunoprecipitated with anti‐SSEA‐3 antibody, followed by western blot analysis for FGF2. IgG immunoprecipitated (negative IP) and total protein extracts were also added to the analysis. (C) The proteins of MUSE cells grown in the presence (+) or absence (−) of FGF2 were immunoprecipitated with anti‐SSEA‐3 antibody, followed by western blot analysis for FGF2R. IgG immunoprecipitated (negative IP) and total protein extracts were also added to the analysis.
FIGURE 6
FIGURE 6
FGF2 pathway in MUSE cells. (A) FGF‐2 signalling pathways. In the cartoon are depicted the drugs and inhibitors of some key factors belonging to the FGF2 signalling pathways. D609: PLCγ inhibitor; LY294002 (LY): PI3K inhibitor; U0126 (U0): MEK1/2 specific inhibitor. (B) The CFU assay performed on MUSE cells after different treatments. The number of CFU clones per 1000 plated cells is reported on the right histogram. (C) Representative picture of ICC staining after spontaneous differentiation. Desmin (green) was used as a mesodermal marker; CK‐7 (red) was used as endodermal marker; NFL (green) was used as ectodermal marker. The nuclei were counterstained with DAPI (blue). The histograms show the percentage of DES, CK‐7 and NFL‐positive cells after different treatments. All experimental data are represented as mean ± SD of five independent replicates (n = 5). The statistical differences among control MUSE cells and MUSE cells with different treatments are indicated with * (*p < 0.05, **p < 0.01).
FIGURE 7
FIGURE 7
Possible actions of SSEA 3 in FGF2/FGF‐2R signalling. The cartoon depicts the signalling pathways associated with SSEA3/FGF2.

References

    1. Kuroda Y, Kitada M, Wakao S, et al. Unique multipotent cells in adult human mesenchymal cell populations. Proc Natl Acad Sci U S A. 2010;107(19):8639‐8643. - PMC - PubMed
    1. Yamauchi T, Yamasaki K, Tsuchiyama K, Koike S, Aiba S. A quantitative analysis of multilineage‐differentiating stress‐enduring (Muse) cells in human adipose tissue and efficacy of melanocytes induction. J Dermatol Sci. 2017;86(3):198‐205. - PubMed
    1. Fisch SC, Gimeno ML, Phan JD, et al. Pluripotent nontumorigenic multilineage differentiating stress enduring cells (Muse cells): a seven‐year retrospective. Stem Cell Res Ther. 2017;8(1):227. - PMC - PubMed
    1. Liang YJ, Kuo HH, Lin CH, et al. Switching of the core structures of glycosphingolipids from globo‐ and lacto‐ to ganglio‐series upon human embryonic stem cell differentiation. Proc Natl Acad Sci U S A. 2010;107(52):22564‐22569. - PMC - PubMed
    1. Levenstein ME, Ludwig TE, Xu RH, et al. Basic fibroblast growth factor support of human embryonic stem cell self‐renewal. Stem Cells. 2006;24(3):568‐574. - PMC - PubMed

MeSH terms

Substances