

Dynamics of transcriptome and chromatin accessibility revealed sequential regulation of potential transcription factors during the brown adipose tissue whitening in rabbits
- PMID: 36225319
- PMCID: PMC9548568
- DOI: 10.3389/fcell.2022.981661
Dynamics of transcriptome and chromatin accessibility revealed sequential regulation of potential transcription factors during the brown adipose tissue whitening in rabbits
Abstract
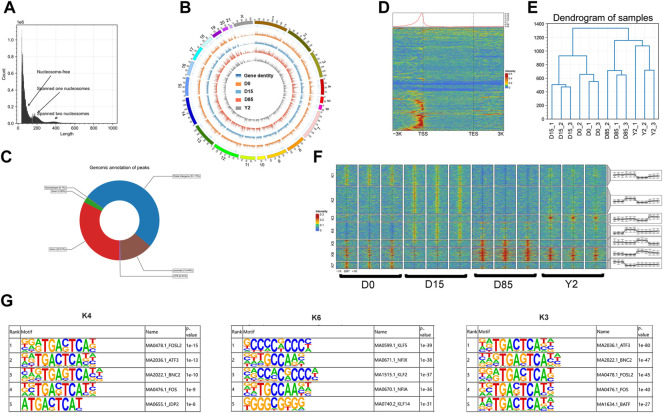
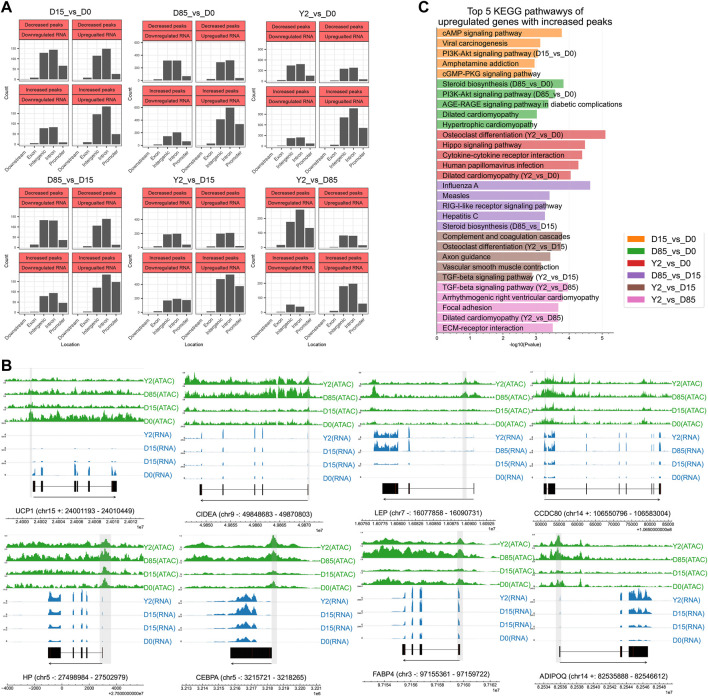
Brown adipose tissue (BAT) represents a valuable target for treating obesity in humans. BAT losses of thermogenic capacity and gains a "white adipose tissue-like (WAT-like)" phenotype (BAT whitening) under thermoneutral environments, which could lead to potential low therapy responsiveness in BAT-based obesity treatments. However, the epigenetic mechanisms of BAT whitening remain largely unknown. In this study, BATs were collected from rabbits at day0 (D0), D15, D85, and 2 years (Y2). RNA-sequencing (RNA-seq) and the assay for transposase-accessible chromatin with high-throughput sequencing (ATAC-seq) were performed to investigate transcriptome and chromatin accessibility of BATs at the four whitening stages, respectively. Our data showed that many genes and chromatin accessible regions (refer to as "peaks") were identified as significantly changed during BAT whitening in rabbits. The BAT-selective genes downregulated while WAT-selective genes upregulated from D0 to Y2, and the de novo lipogenesis-related genes reached the highest expression levels at D85. Both the highly expressed genes and accessible regions in Y2 were significantly enriched in immune response-related signal pathways. Analysis of different relationships between peaks and their nearby genes found an increased proportion of the synchronous changes between chromatin accessibility and gene expression during BAT whitening. The synergistic changes between the chromatin accessibility of promoter and the gene expression were found in the key adipose genes. The upregulated genes which contained increased peaks were significantly enriched in the PI3K-Akt signaling pathway, steroid biosynthesis, TGF-beta signaling pathway, osteoclast differentiation, and dilated cardiomyopathy. Moreover, the footprinting analysis suggested that sequential regulation of potential transcription factors (TFs) mediated the loss of thermogenic phenotype and the gain of a WAT-like phenotype of BAT. In conclusion, our study provided the transcriptional and epigenetic frameworks for understanding BAT whitening in rabbits for the first time and might facilitate potential insights into BAT-based obesity treatments.
Keywords: ATAC-seq; BAT; epigenetics; rabbits; whitening.
Copyright © 2022 Du, Chen, Bai, Chen, Hu, Li, Wang, He and Lai.
Conflict of interest statement
The authors declare that the research was conducted in the absence of any commercial or financial relationships that could be construed as a potential conflict of interest.
Figures


Similar articles
-
Integrated analysis of microRNAs, circular RNAs, long non-coding RNAs, and mRNAs revealed competing endogenous RNA networks involved in brown adipose tissue whitening in rabbits.BMC Genomics. 2022 Nov 28;23(1):779. doi: 10.1186/s12864-022-09025-2. BMC Genomics. 2022. PMID: 36443655 Free PMC article.
-
A role for miRNAs in the regulation of brown adipose tissue whitening in goats (Capra Hircus).J Anim Sci. 2024 Jan 3;102:skae124. doi: 10.1093/jas/skae124. J Anim Sci. 2024. PMID: 38712478 Free PMC article.
-
Integrated Analysis of Transcriptome, microRNAs, and Chromatin Accessibility Revealed Potential Early B-Cell Factor1-Regulated Transcriptional Networks during the Early Development of Fetal Brown Adipose Tissues in Rabbits.Cells. 2022 Aug 28;11(17):2675. doi: 10.3390/cells11172675. Cells. 2022. PMID: 36078081 Free PMC article.
-
An insight into brown/beige adipose tissue whitening, a metabolic complication of obesity with the multifactorial origin.Front Endocrinol (Lausanne). 2023 Feb 16;14:1114767. doi: 10.3389/fendo.2023.1114767. eCollection 2023. Front Endocrinol (Lausanne). 2023. PMID: 36875450 Free PMC article. Review.
-
The Whitening of Brown Fat and Its Implications for Weight Management in Obesity.Curr Obes Rep. 2015 Jun;4(2):224-9. doi: 10.1007/s13679-015-0157-8. Curr Obes Rep. 2015. PMID: 26627217 Review.
Cited by
-
Increased Aquaporin-7 Expression Is Associated with Changes in Rat Brown Adipose Tissue Whitening in Obesity: Impact of Cold Exposure and Bariatric Surgery.Int J Mol Sci. 2023 Feb 8;24(4):3412. doi: 10.3390/ijms24043412. Int J Mol Sci. 2023. PMID: 36834823 Free PMC article.
-
Integrated analysis of microRNAs, circular RNAs, long non-coding RNAs, and mRNAs revealed competing endogenous RNA networks involved in brown adipose tissue whitening in rabbits.BMC Genomics. 2022 Nov 28;23(1):779. doi: 10.1186/s12864-022-09025-2. BMC Genomics. 2022. PMID: 36443655 Free PMC article.
-
Genome-wide identification of the H3K27ac signals reveals key thermogenic cis-regulatory elements of brown adipose tissues in Oryctolagus cuniculus.BMC Genomics. 2025 Jul 25;26(1):691. doi: 10.1186/s12864-025-11868-4. BMC Genomics. 2025. PMID: 40713473 Free PMC article.
-
A role for miRNAs in the regulation of brown adipose tissue whitening in goats (Capra Hircus).J Anim Sci. 2024 Jan 3;102:skae124. doi: 10.1093/jas/skae124. J Anim Sci. 2024. PMID: 38712478 Free PMC article.
-
Genome-wide chromatin accessibility and selective signals of meat rabbits reveal key Cis-regulatory elements and variants during postnatal development of skeletal muscles in rabbits.BMC Genomics. 2025 Mar 25;26(1):296. doi: 10.1186/s12864-025-11496-y. BMC Genomics. 2025. PMID: 40133827 Free PMC article.
References
-
- Abdelatty A. M., Mandouh M. I., Mousa M. R., Mansour H. A., Ford H., Shaheed I. B., et al. (2021). Sun-dried Azolla leaf meal at 10% dietary inclusion improved growth, meat quality, and increased skeletal muscle Ribosomal protein S6 kinase β1 abundance in growing rabbit. Animal 15 (10), 100348. 10.1016/j.animal.2021.100348 - DOI - PubMed
LinkOut - more resources
Full Text Sources