. 2022 Sep 26:13:964799.
doi: 10.3389/fmicb.2022.964799. eCollection 2022.

Comparison of gut microflora of donkeys in high and low altitude areas

Affiliations

Comparison of gut microflora of donkeys in high and low altitude areas

Rong Guo et al. Front Microbiol. .

Abstract

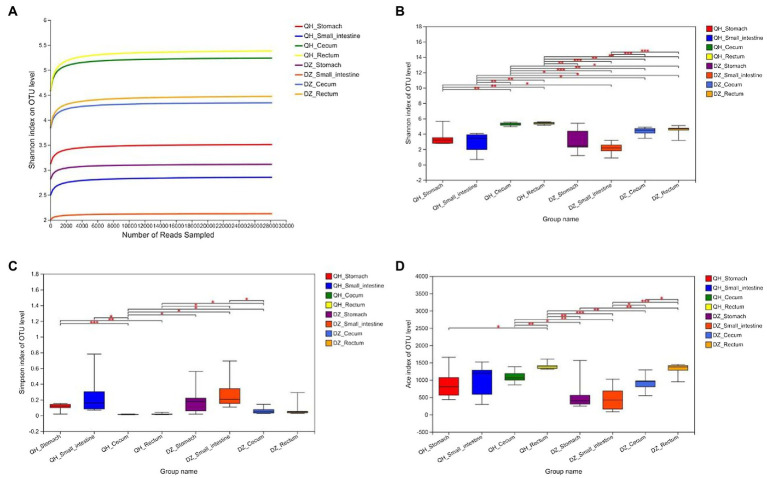
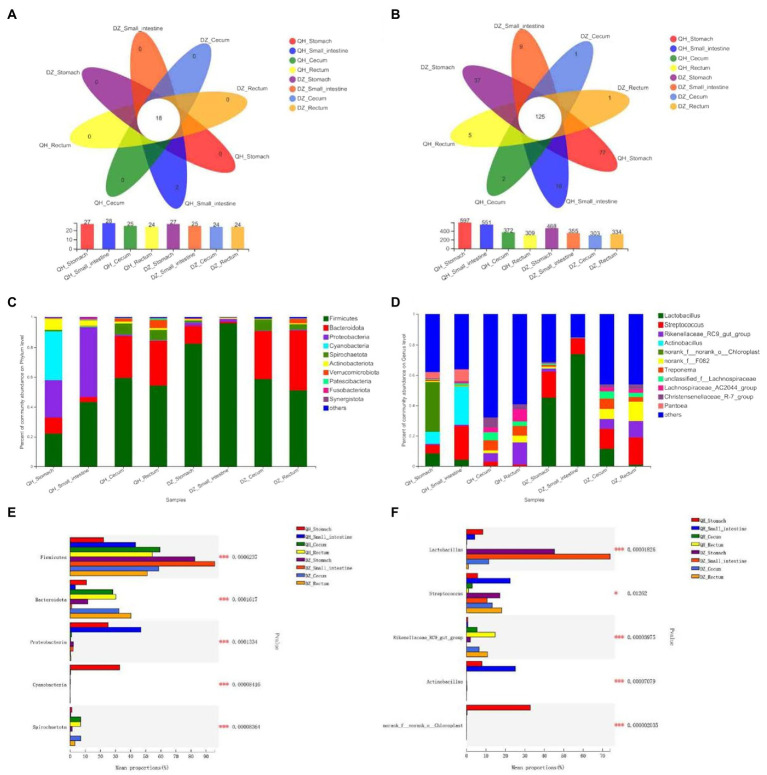
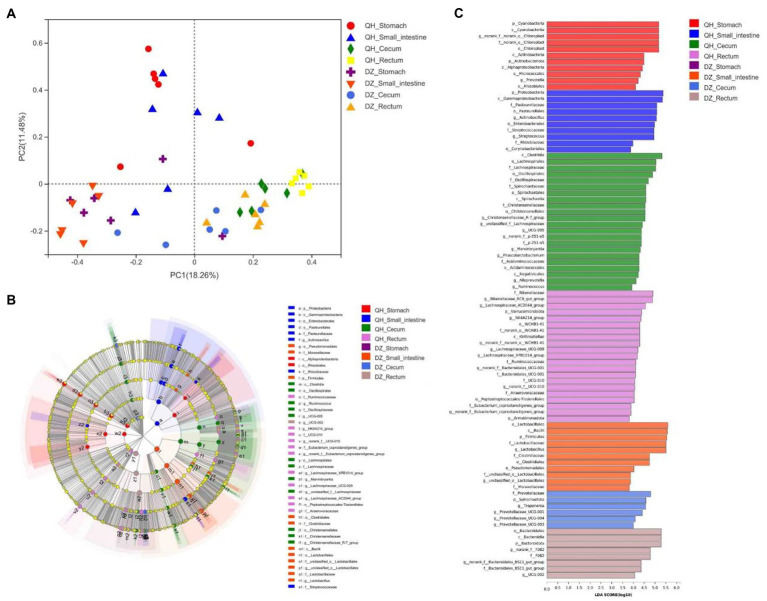
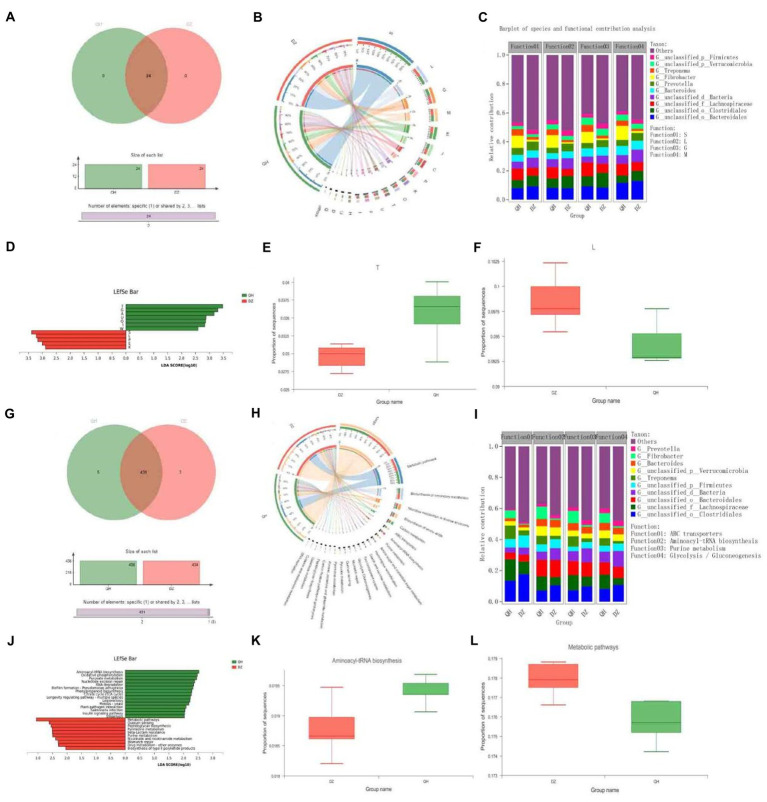
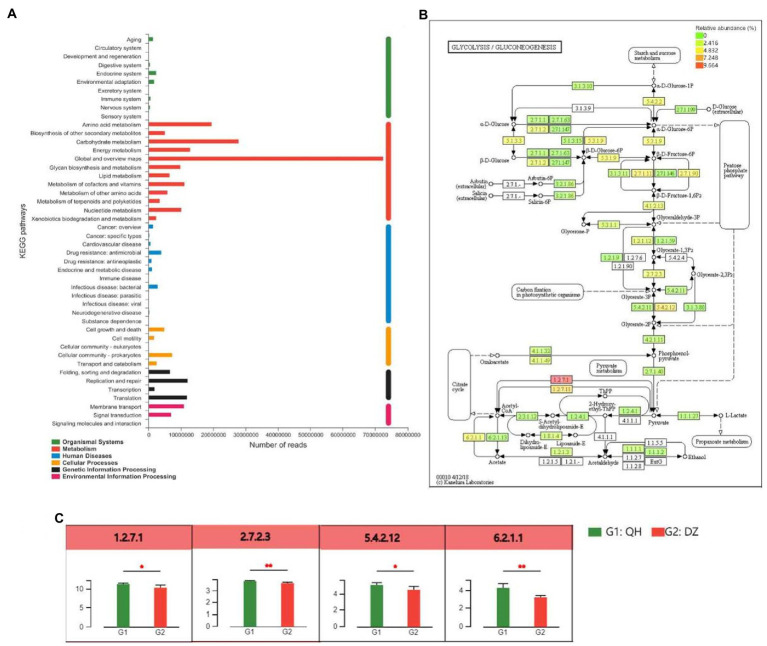
Donkeys' gut microbe is critical for their health and adaptation to the environment. Little research has been conducted on the donkey gut microbiome compared with other domestic animals. The Tibetan Plateau is an extreme environment. In this study, 6 Qinghai donkeys (QH) from the Tibetan Plateau and 6 Dezhou donkeys (DZ) were investigated, and the contents of 4 parts-stomach, small intestine, cecum, and rectum-were collected. 16S rRNA sequencing and metagenomic sequencing were used to analyze the composition and diversity of gut microbial communities in donkeys. The results showed that the flora diversity and richness of the hindgut were significantly higher than those of the foregut (p < 0.01), with no sex differences, and the community structure and composition of the same or adjacent regions (stomach, small intestine, cecum, and rectum) were similar. Besides, the flora diversity and richness of QH on the Tibetan Plateau were significantly higher than those of DZ (p < 0.05). The major pathways associated with QH were signal transduction mechanisms and carbohydrate transport and metabolism, and Bacteroidales were the major contributors to these functions. Our study provides novel insights into the contribution of microbiomes to the adaptive evolution of donkeys.

Keywords: 16S rRNA; altitude; donkey; gut microbes; metagenomic.


Conflict of interest statement

The authors declare that the research was conducted in the absence of any commercial or financial relationships that could be construed as a potential conflict of interest.

Figures

Figure 1
Figure 1
Alpha diversity analysis. (A) Sparse curve. Shannon’s exponential curve. The abscissa is the number of sequences; the ordinate is the OTU index. (B–D) Between-group t-test. Type I intervals represent the upper and lower limits of the index. The index difference test chart showed the significant difference between the selected two groups with significant differences (*p < 0.05, **p < 0.001, ***p < 0.01), the abscissa was the group name, and the ordinate was the index average of each group.
Figure 2
Figure 2
Composition of gut microbial community. Structure composition of related microbial communities in gut locations of phylum level (A,C,E) and genus level (B,D,F). (A,B) Venn diagram. Numbers in the overlapping part represent the number of species shared by multiple groups, and the numbers in the non-overlapping part represent the number of species unique to the corresponding grouping. (C,D) Community column chart. The abscissa was the sample name, the ordinate was the proportion of species in the sample, the columns of different colors represented different species, and the length of the column represented the proportion of the species. (E,F) Multi-group comparison. The X-axis represented different groups, the boxes with different colors represented different groups, and the Y-axis represented the average relative abundance of a species in different groups.
Figure 3
Figure 3
Beta diversity analysis. (A) PCoA picture. The X-axis and Y-axis represented the two selected primary axes, and the percentages represented the explanatory value of the differences in sample composition by the primary axes; points with different colors or shapes represented samples in different groups: the closer the two sample points, the more similar the species composition of the two samples. (B) LEfSe diagram. Nodes with different colors indicate microbial groups that were significantly enriched in the corresponding groups and have a significant impact on the differences between groups; light yellow nodes indicate microorganisms that have no significant differences in different groups or have no significant impact on differences between groups. (C) LDA diagram. The abscissa is the LDA score—the greater the LDA score, the greater the influence of species abundance on the differential effect—and different colors represent different groups.
Figure 4
Figure 4
Functional composition and differences. Venn Figures in COG (A) and KEGG (G). Overlapping parts indicate functions common to multiple sample groups; non-overlapping parts indicate functions unique to the sample group; and numbers indicate the number of corresponding functions. Circos Figures in COG (B) and KEGG (H). The left semicircle (smaller circle) represents the functional abundance composition of the sample, and the right semicircle (larger circle) represents the distribution ratio of functions in different samples under this clustering-level condition. Species and functional contributions were shown in COG (C) and KEGG (I); the abscissas were the corresponding sample groups, and the ordinates were the relative contributions. LDA discriminant histogram in COG (D) and KEGG (J): the abscissa is the LDA score—the greater the LDA score, the greater the influence of species abundance on the differential effect—and different colors represent different groups. Difference test box in COG (E,F) and KEGG (K,L): The abscissa represents the grouping category name, and the ordinate represents the percentage of species abundance in a sample grouping.
Figure 5
Figure 5
Differences between metabolite groups. (A) Pathway classification statistics histogram. The ordinate was the function name of KEGG Pathway Level 2, and the abscissa was its corresponding abundance value. The histogram was colored according to the KEGG Pathway Level 1 to which KEGG Pathway Level 2 belongs. (B) Metabolic pathway difference test chart between groups. Each square in the box with a fill color represents one or a group of samples. The intensity of the color represents the abundance change in the enzyme in different samples or groups. (C) Histogram of differences in metabolic pathways between groups. In the legend, G1 and G2 correspond to different groups.

References

    1. Al J. R. A., Andrews F. M. (2009). The bacterial community of the horse gastrointestinal tract and its relation to fermentative acidosis, laminitis, colic, and stomach ulcers. Vet. Clin. North Am. Equine Pract. 25, 199–215. doi: 10.1016/j.cveq.2009.04.005 - DOI - PubMed
    1. Argenzio R. A., Southworth M., Lowe J. E., Stevens C. E. (1977). Interrelationship of Na, HCO3, and volatile fatty acid transport by equine large intestine. Am. J. Phys. 233, E469–E478. - PubMed
    1. Argenzio R. A., Southworth M., Stevens C. E. (1974). Sites of organic acid production and absorption in the equine gastrointestinal tract. Am. J. Phys. 226, 1043–1050. doi: 10.1152/ajplegacy.1974.226.5.1043, PMID: - DOI - PubMed
    1. Bao Y., Wang Z., Zhang Y., Zhang J., Wang L., et al. . (2012). Effect of lactobacillus plantarum P-8 on lipid metabolism in hyperlipidemic rat model. Eur. J. Lipid Sci. Technol. 114, 1230–1236. doi: 10.1002/ejlt.201100393 - DOI
    1. Boroughs L. K., DeBerardinis R. J. (2015). Metabolic pathways promoting cancer cell survival and growth. Nat. Cell Biol. 17, 351–359. doi: 10.1038/ncb3124, PMID: - DOI - PMC - PubMed

LinkOut - more resources