. 2022 Sep 26:13:1007429.
doi: 10.3389/fphar.2022.1007429. eCollection 2022.

KIF20A is associated with clinical prognosis and synergistic effect of gemcitabine combined with ferroptosis inducer in lung adenocarcinoma

Affiliations

KIF20A is associated with clinical prognosis and synergistic effect of gemcitabine combined with ferroptosis inducer in lung adenocarcinoma

Hua He et al. Front Pharmacol. .

Abstract

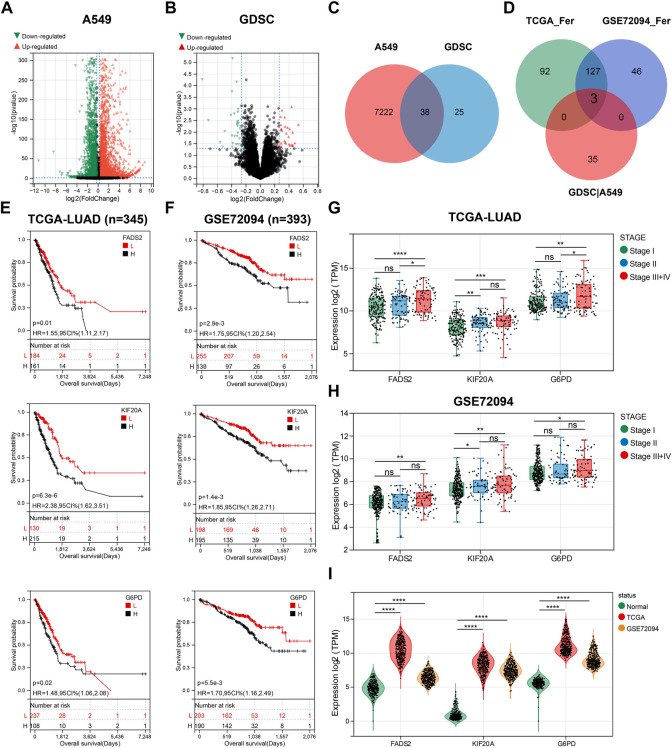
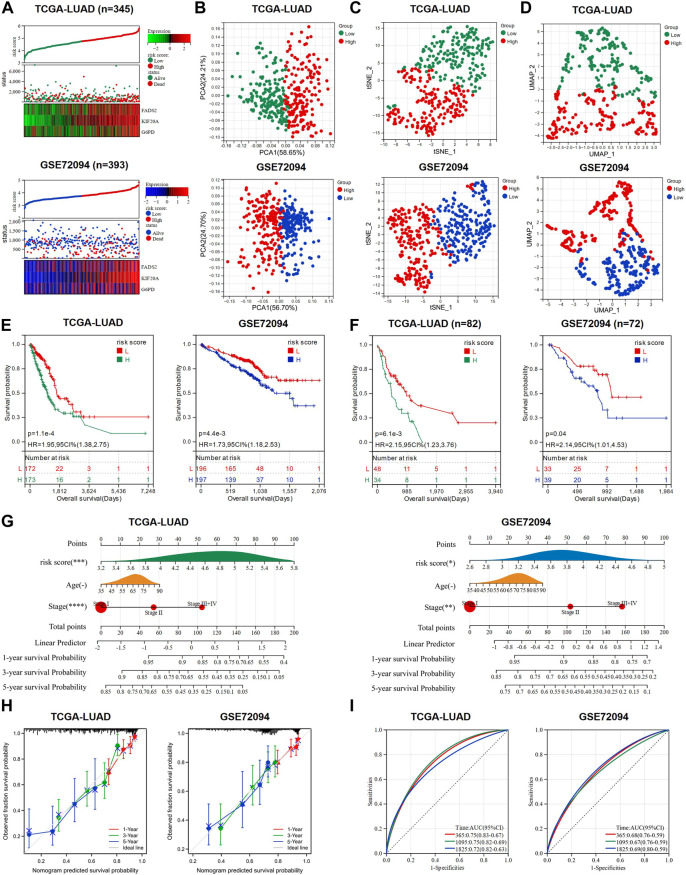
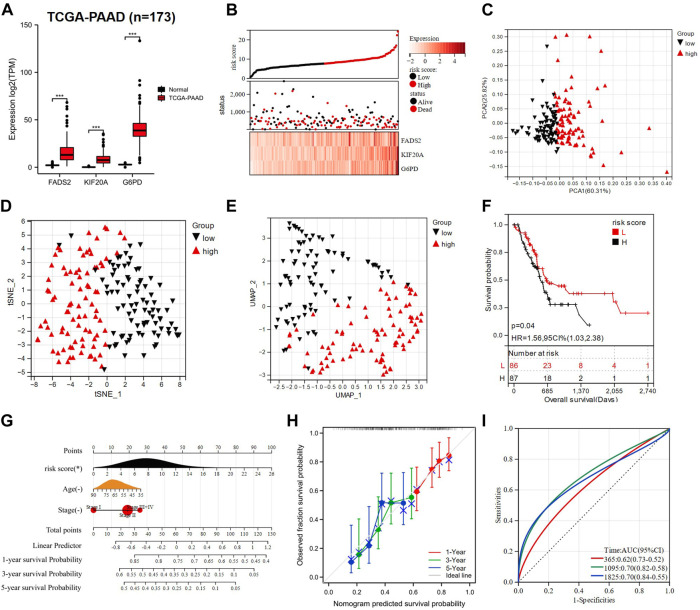
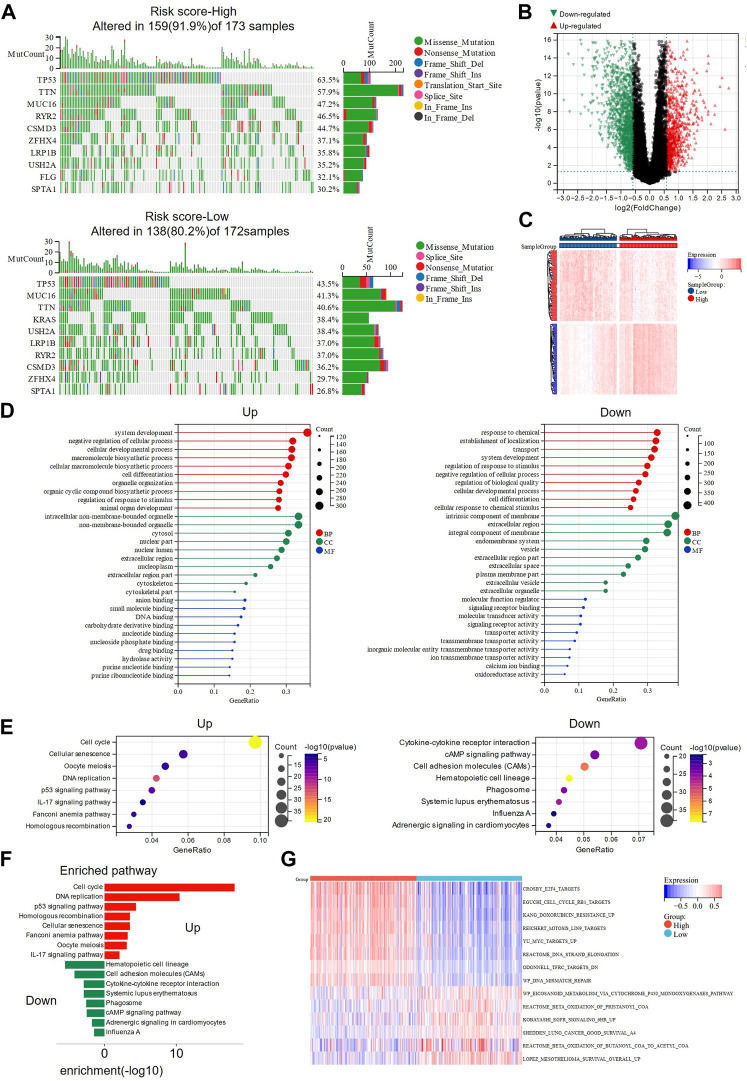
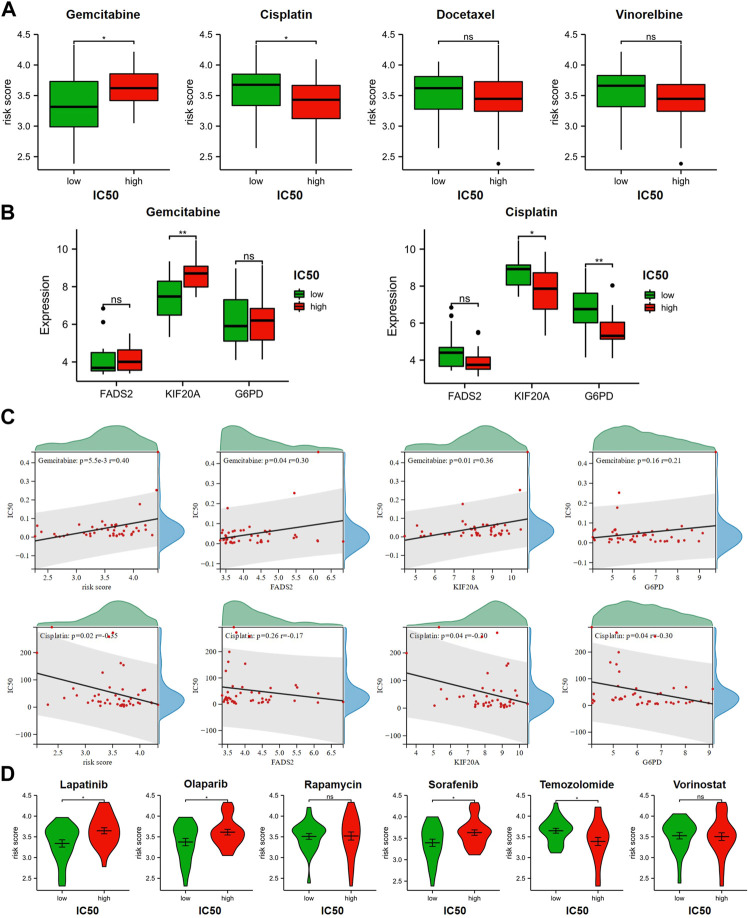
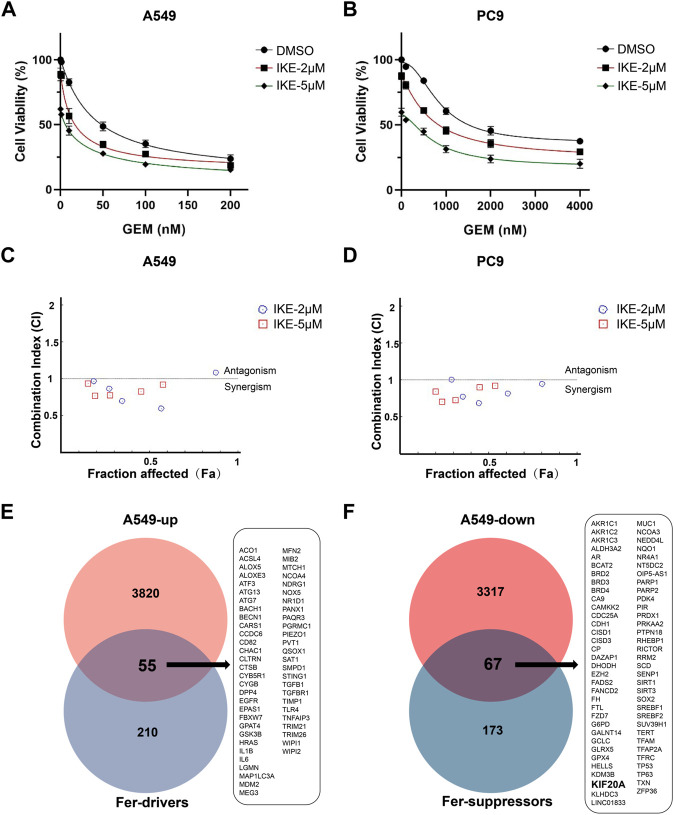
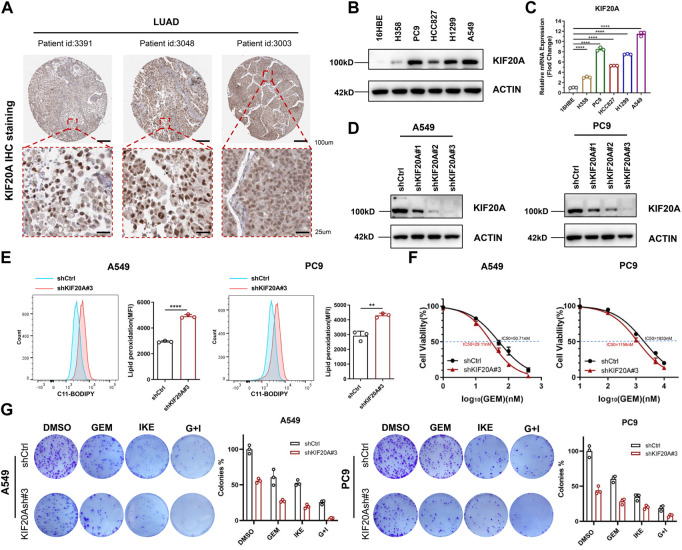
Gemcitabine (GEM), an antimetabolite that terminates DNA synthesis, is commonly used in the treatment of cancers including lung adenocarcinoma (LUAD). However, downregulation of sensitivity limits the therapeutic effect. Ferroptosis as the new form of regulated cell death has been shown to have great potential for cancer treatment with chemoresistance. Here, three genes with both ferroptosis and GEM-response-associated features were screened from RNA sequencing and public data for constructing an independent risk model. LUAD patients with different risk scores had differences in mutational landscape, gene enrichment pathways, and drug sensitivity. By Cell Counting Kit-8 assay, flow cytometry, and colony forming assay, we demonstrate that GEM and ferroptosis inducer (FIN) imidazole Ketone Erastin had a synergistic combined anti-proliferative effect on LUAD cells and knockdown of KIF20A (the core gene of our model) further enhanced cell death in vitro by inducing ferroptosis. In conclusion, we identified a link between ferroptosis and GEM response in LUAD cells and developed a robust signature that can effectively classify LUAD patients into subgroups with different overall survival. For LUAD, the combined treatment modality of GEM and FIN is potentially effective and KIF20A may be a new therapeutic target.

Keywords: KIF20A; ferroptosis; gemcitabine; lung adenocarcinoma; risk model; synergistic effect.


Conflict of interest statement

The authors declare that the research was conducted in the absence of any commercial or financial relationships that could be construed as a potential conflict of interest.

Figures

FIGURE 1
FIGURE 1
Three GEM response-related prognostic FGRs were screened. (A) A volcano plot of data obtained by RNA-seq comparing A549 cells exposed to GEM and PBS for 48 h. (B) The volcano map showing the DEG between non-sensitive LUAD cells and GEM-sensitive LUAD cells. (C) Venn diagram depicting 38 screened GEM response-related genes. (D) Venn diagram to identify the common FRGs of GEM response-related genes, TCGA-LUAD prognostic FRGs and GES72094 prognostic FRGs. (E,F) K-M curves for OS of LUAD patients with high and low expression groups of the three candidate genes. (G,H) Box plots showed the expression of three candidate genes in different tumor staging samples. (I) Violin plots for comparing the expression levels of three candidate genes in normal lung tissue and LUAD samples. FRGs: ferroptosis-related genes; GEM: Gemcitabine; TCGA_Fer: prognostic FRGs in TCGA-LUAD; GSE72094_Fer: prognostic FRGs in GSE72094; GDSC|A549: the intersection genes of DEGs in GEM-treated A549 and GDSC databases; RNA-seq: RNA sequencing; LUAD: lung adenocarcinoma; K-M analysis: Kaplan-Meier analysis; OS: overall survival; HR: hazard ratio. *p < 0.05; **p < 0.01; ***p < 0.001; ****p < 0.0001; ns p > 0.05.
FIGURE 2
FIGURE 2
A prognostic model to predict the survival of LUAD patients was constructed and validated. (A) Expression heat map of the three candidate genes, risk score curve and survival status scatter plot for each LUAD patient in training cohort and validation cohort, respectively. (B–D) PCA analysis, t-SNE analysis and UMAP analysis were used to verify the grouping performance of the prognostic model. (E) K-M curves for OS of LUAD patients in the high-risk and low-risk groups. (F) K-M curves for OS of advanced LUAD patients (stage III + IV) in the high-risk and low-risk groups. (G) Nomograms were constructed using three independent prognostic factors (risk score, age, and tumor stage) to predict OS at 1-, 3-and 5-year for LUAD patients. (H) The calibration plots assess the accuracy of the nomogram. (I) AUC of ROC curves for validating the accuracy of risk model 1-, 3- and 5-year survival predictions. LUAD: lung adenocarcinoma; TCGA: The Cancer Genome Atlas; PCA: principal component analysis; t-SNE: t-distributed Stochastic Neighbor Embedding; UMAP: uniform manifold approximation and projection; K-M analysis: Kaplan-Meier analysis; OS: overall survival; ROC: receiver operating characteristic; AUC: area under the curve; HR: hazard ratio. *p < 0.05; **p < 0.01; ***p < 0.001; ****p < 0.0001; ns p > 0.05.
FIGURE 3
FIGURE 3
Construction of a PAAD prognostic model based on three candidate genes. (A) Comparison of the expression of three prognostic genes in normal (n = 167) and PAAD tissues (n = 173). (B) TCGA-PAAD patients were divided into two groups based on risk scores. (C–E) PCA, t-SNE, and UMAP analysis of TCGA-PAAD. (F) K-M analysis showed the OS of PAAD patients in the low- and high-risk groups. (G) A nomogram was constructed using risk score, age, and tumor stage. (H) The calibration curves for predicting PAAD patient OS at 1-, 3- and 5- year. (I) ROC analysis of 1-, 3- and 5- year OS in PAAD patients. PAAD: Pancreatic adenocarcinoma; TCGA: The Cancer Genome Atlas; PCA: principal component analysis; t-SNE: t-distributed Stochastic Neighbor Embedding; UMAP: uniform manifold approximation and projection; K-M analysis: Kaplan-Meier analysis; OS: overall survival; CI: combination index; ROC: receiver operating characteristic; AUC: area under the curve; HR: hazard ratio. *p < 0.05; **p < 0.01; ***p < 0.001; ****p < 0.0001; ns p > 0.05.
FIGURE 4
FIGURE 4
Somatic mutation analysis and functional enrichment analysis of DEGs in high- and low-risk groups. (A) The waterfall plots showed the somatic mutation landscape in high and low risk groups. (B) Volcano plot presenting the DEGs screened between the high- and low-risk groups. (C) The heat map showing the expression of DEGs in high and low-risk groups. (D) GO analysis of up-regulated and down-regulated genes in high-risk group were performed separately. (E,F) KEGG analysis revealed the main pathways involved in DEGs. (G) Pathway activities in high- and low-risk groups were analyzed using GSVA. DEGs: differentially expressed genes; GO: Gene Ontology; KEGG: Genes and Genomes; GSVA: Gene set variation analysis.
FIGURE 5
FIGURE 5
Relationship between GRFRM risk score and drug sensitivity. (A) Correlation analysis of IC50 and risk scores for GEM and chemotherapeutic agents commonly combined with GEM for LUAD. (B) Comparison of the expression levels of three prognostic genes in GEM and Cisplatin high and low IC50 groups, respectively. (C) Spearman coefficients were used for correlation analysis of drug IC50 and risk scores, as well as correlation analysis of drug IC50 and expression levels of three candidate genes. (D) Drug sensitivity of 4 FINs available for LUAD treatment was associated with GRFRM risk scores. GRFRM: GEM response and ferroptosis related model; GEM: Gemcitabine; LUAD: lung adenocarcinoma; IC50: half maximal inhibitory concentration; FINs: ferroptosis inducers. *p < 0.05; **p < 0.01; ns p > 0.05.
FIGURE 6
FIGURE 6
Combined treatment of GEM and IKE synergistically inhibited the proliferation of A549 and PC9. (A) A549 cell viability was assessed by CCK8 assay after treatment with different concentrations of GEM alone (0, 10, 50, 100 or 200 nM) or in combination with IKE (2 or 5 μM) for 48 h (B) PC9 cell viability was assessed by CCK8 assay after treatment with different concentrations of GEM alone (0, 100, 500, 1000 or 2000 nM) or in combination with IKE (2 or 5 μM) for 48 h (C,D) The software calculated and evaluated the combination index (CI) of GEM and IKE in A549 and PC9. CI = 1, additive; CI > 1, antagonism; CI < 1, synergism. (E) Venn diagram showing ferroptosis driver genes upregulated by GEM treatment in A549. (F) Venn diagram showing ferroptosis suppressors downregulated by GEM treatment in A549. n = 3. GEM: Gemcitabine; IKE: Imidazole Ketone Erastin; CCK8 assay: Cell Counting Kit-8 assay; CI: combination index.
FIGURE 7
FIGURE 7
KIF20A was highly expressed in LUAD cells and regulated the combined effect of GEM and IKE. (A) IHC staining of KIF20A protein in LUAD tissues was analyzed based on the HPA database. (B) Western blot analysis was used to detect KIF20A protein levels in human bronchial epithelial-like cells (16HBE) and LUAD cell lines (H358, PC9, HCC8217, H1299, A549). (C) RT-qPCR for detection of KIF20A mRNA levels in 16HBE and LUAD cell lines. (D) Western blot analysis for detecting knockdown of KIF20A in PC9 and A549. (E) Lipid ROS production was measured by flow cytometry using C11-BODIPY. A549/PC9 cells were treated with IKE for 24 h (F) CCK8 assay to detect the IC50 value of GEM in A549/PC9 after KIF20A knockdown. (G) Colony-forming Assay to assess the effect of KIF20A knockdown on the combined IKE and GEM. n = 3. LUAD: lung adenocarcinoma; GEM: Gemcitabine; IHC: Immunohistochemical; RT-qPCR: Real-Time Quantitative PCR; ROS: reactive oxygen species; IKE: Imidazole Ketone Erastin; IC50: half maximal inhibitory concentration; CCK8 assay: Cell Counting Kit-8 assay; G + I: Gemcitabine + IKE. *p < 0.05; **p < 0.01; ***p < 0.001; ****p < 0.0001; ns p > 0.05.

Similar articles

Cited by

References

    1. Chen X., Kang R., Kroemer G., Tang D. (2021a). Broadening horizons: The role of ferroptosis in cancer. Nat. Rev. Clin. Oncol. 18 (5), 280–296. 10.1038/s41571-020-00462-0 - DOI - PubMed
    1. Chen X., Li J., Kang R., Klionsky D. J., Tang D. (2021b). Ferroptosis: Machinery and regulation. Autophagy 17 (9), 2054–2081. 10.1080/15548627.2020.1810918 - DOI - PMC - PubMed
    1. Dixon S. J., Lemberg K. M., Lamprecht M. R., Skouta R., Zaitsev E. M., Gleason C. E., et al. (2012). Ferroptosis: An iron-dependent form of nonapoptotic cell death. Cell 149 (5), 1060–1072. 10.1016/j.cell.2012.03.042 - DOI - PMC - PubMed
    1. Friedmann Angeli J. P., Krysko D. V., Conrad M. (2019). Ferroptosis at the crossroads of cancer-acquired drug resistance and immune evasion. Nat. Rev. Cancer 19 (7), 405–414. 10.1038/s41568-019-0149-1 - DOI - PubMed
    1. Ghergurovich J. M., Esposito M., Chen Z., Wang J. Z., Bhatt V., Lan T., et al. (2020). Glucose-6-Phosphate dehydrogenase is not essential for K-Ras-Driven tumor growth or metastasis. Cancer Res. 80 (18), 3820–3829. 10.1158/0008-5472.CAN-19-2486 - DOI - PMC - PubMed