. 2022 Sep 26:13:997701.
doi: 10.3389/fphar.2022.997701. eCollection 2022.

Striatal miR-183-5p inhibits methamphetamine-induced locomotion by regulating glucocorticoid receptor signaling

Affiliations

Striatal miR-183-5p inhibits methamphetamine-induced locomotion by regulating glucocorticoid receptor signaling

Sang-Hoon Song et al. Front Pharmacol. .

Abstract

MicroRNA (miRNA)-mediated striatal gene regulation may play an important role in methamphetamine (METH) addiction. This study aimed to identify changes in novel miRNAs and their target genes during METH self-administration and investigate their roles in METH-induced locomotion. RNA sequencing analysis revealed that mir-183-5p was upregulated in the striatum of METH self-administered rats, and target gene prediction revealed that the glucocorticoid receptor (GR) gene, Nr3c1, was a potential target gene for mir-183-5p. We confirmed that single and repeated METH administrations increased METH-induced locomotion and plasma corticosterone levels in rats. Additionally, increased miR-185-5p expression and decreased GR gene expression were observed only in the repeated-METH-injection group but not in the single-injection group. We then investigated the effects of miR-183-5p on METH-induced locomotion using a miR-183-5p mimic and inhibitor. Injection of a mir-183-5p mimic in the striatum of rats attenuated METH-induced locomotion, whereas injection of a miR-183-5p inhibitor enhanced the locomotor activity in METH-administered rats. Furthermore, the miR-183-5p mimic reduced the phosphorylation of tyrosine hydroxylase (TH) whereas the inhibitor increased it. Taken together, these results indicate that repeated METH injections increase striatal miR-183-5p expression and regulate METH-induced locomotion by regulating GR expression in rats, thereby suggesting a potential role of miR-183-5p as a novel regulator of METH-induced locomotion.

Keywords: RNA sequencing; glucocorticoid receptor; locomotor activity; methamphetamine; microRNA; self-administration.


Conflict of interest statement

The authors declare that the research was conducted in the absence of any commercial or financial relationships that could be construed as a potential conflict of interest.

Figures

FIGURE 1
FIGURE 1
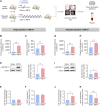
Identification of miRNA transcripts in METH self-administered rats. (A) Flowchart showing an overview of the experimental procedure. (B) The overall workflow for identification of miRNA and its target gene. Nr3c1 expression level in the striatum was analyzed by qRT-PCR and normalized to β-actin level. Data are presented as the fold change relative to the saline group. Statistical analyses were performed using the Student’s t-test. Error bars represent mean ± SEM (n = 4). *** p < 0.001.
FIGURE 2
FIGURE 2
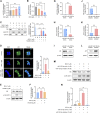
Effects of METH injections on the locomotor activity in rats. (A) Flowchart showing an overview of the experimental procedure. Rats were injected with single or repeated METH injections. (B,G) The total travelled distance was recorded 1 h after single or repeated METH injections. Statistical analyses were performed using the Student’s t-test. Error bars represent mean ± SEM (n = 8). *** p < 0.001. (C,H) Plasma corticosterone levels in rats following single or repeated injections of saline or METH. Statistical analyses were performed using the Student’s t-test. Error bars represent mean ± SEM (n = 8). *** p < 0.001. (D,I) Western blot analysis showing p-GR (S211) expression in rat striatum. The bands were normalized to β-actin. Quantification of the relative blot intensity of proteins was performed using ImageJ software. Data are presented as the fold change relative to the saline group. Statistical analyses were performed using the Student’s t-test. Error bars represent mean ± SEM (n = 8). * p < 0.05, ** p < 0.01. (E,J) qRT-PCR analysis of miR-183-5p expression. The value was normalized to the U6 level. Data are presented as the fold change relative to the saline group. Statistical analyses were performed using the Student’s t-test. Error bars represent mean ± SEM (n = 8). ** p < 0.01. (F,K) qRT-PCR analysis of Nr3c1. The level was normalized to the β-actin level. Data are presented as the fold change relative to the saline group. Statistical analyses were performed using the Student’s t-test. Error bars represent mean ± SEM (n = 8). *** p < 0.001.
FIGURE 3
FIGURE 3
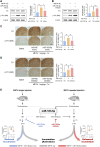
Regulation of glucocorticoid receptor (GR) and miR-183-5p expression in HEK293 cells. (A,B) Cells were treated with DEX as indicated. MiR-183-5p and Nr3c1 expression level was analyzed and normalized to U6 and β-actin level. Data are presented as the fold change relative to the control group. Statistical analyses were performed using the one-way ANOVA. Error bars represent mean ± SD (n = 3). * p < 0.05, *** p < 0.001. (C) Western blots showing the nuclear translocation of GR protein following DEX treatment. GAPDH and Lamin B1 were used as the cytoplasmic and nuclear loading controls, respectively. Quantification of the relative blot intensity of the GR protein was performed using ImageJ software. Statistical analyses were performed using the one-way ANOVA. Error bars represent mean ± SD (n = 3). ** p < 0.01, *** p < 0.001. (D) Cells seeded on sterile coverslips were treated with DEX for 6 h, then fixed with methanol, incubated with fluorescently tagged mouse monoclonal GR antibody, and stained with Alexa Flour 488 (green)-labeled anti-mouse antisera and DAPI. GR signals were then visualized by confocal microscopy. Quantification of the relative fluorescence intensity of GR was performed using ImageJ software. Data are presented as the fold change relative to the control group. Statistical analyses were performed using the one-way ANOVA. Error bars represent mean ± SD (n = 3–6). ** p < 0.01. (E) Cells were treated with 1 μM of DEX and 3 μM of RU486 as indicated for 24 h. (F) Cells were treated with DEX and RU486 as indicated. MiR-183-5p expression level was analyzed and normalized to U6 level. Data are presented as the fold change relative to the control group. Statistical analyses were performed using the one-way ANOVA. Error bars represent mean ± SD (n = 3). ** p < 0.01. (G,H) Cells were treated with 1 nM miR-183-5p mimic for 48 h. MiR-183-5p and Nr3c1 expression level was analyzed by qRT-PCR and normalized to U6 and β-actin level. Data are presented as the fold change relative to the control group. Statistical analyses were performed using the Student’s t-test. Error bars represent mean ± SD (n = 3). *** p < 0.001. (I) GR protein expression level. (J,K) Cells were treated with 10 nM miR-183-5p inhibitor for 48 h. MiR-183-5p and Nr3c1 expression level was analyzed by qRT-PCR and normalized to U6 and β-actin level. Data are presented as the fold change relative to the control group. Statistical analyses were performed using the one-way ANOVA. Error bars represent mean ± SD (n = 3). *** p < 0.001. (I,L) GR protein expression level. (M) Cells were treated with the indicated combinations of DEX, miR-183-5p mimic, and miR-183-5p inhibitor, and GR protein expressions were measured by western blot analyses. (N) miR-183-5p expression level was analyzed and normalized to U6 level. Data are presented as the fold change relative to the control group. Statistical analyses were performed using the one-way ANOVA. Error bars represent mean ± SD (n = 3). * p < 0.05, ** p < 0.01, *** p < 0.001.
FIGURE 4
FIGURE 4
Effects of striatal miR-183-5p on METH-induced locomotor activity. (A) Flowchart showing an overview of a single METH injection. Rats were injected with vehicle or miR-183-5p mimic twice before METH injection. (B) The locomotor activities of rats were recorded 1 h after METH injection. Statistical analysis was performed using the one-way ANOVA. Error bars represent mean ± SEM (n = 10). ** p < 0.01, *** p < 0.001. (C,D) MiR-183-5p and Nr3c1 expression level in the striatum was analyzed and normalized to U6 and β-actin level. Data are presented as the fold change relative to the control group. Statistical analyses were performed using the one-way ANOVA. Error bars represent mean ± SEM (n = 5). * p < 0.05, ** p < 0.01. (E) Flowchart showing an overview of repeated METH injections. Rats were injected with vehicle or miR-183-5p inhibitor on the 5th and 6th days following METH injections. (F) The locomotor activities of rats were recorded 1 h after METH injection. Statistical analyses were performed using the one-way ANOVA. Error bars represent mean ± SEM (n = 5). ** p < 0.01, *** p < 0.001. (G,H) MiR-183-5p and Nr3c1 expression level in the striatum was analyzed and normalized to U6 and β-actin level. Data are presented as the fold change relative to the control group. Statistical analyses were performed using the one-way ANOVA. Error bars represent mean ± SEM (n = 5). * p < 0.05, ** p < 0.01, *** p < 0.001.
FIGURE 5
FIGURE 5
MiR-183-5p downregulated GR-TH signaling in the striatum of rats. (A,B) Western blot analysis of TH and p-TH (S40) expression in the striatum. The immunoblots were normalized to β-actin. Quantification of the relative blot intensity of proteins was performed using ImageJ software. Data are presented as the fold change relative to the control group. Statistical analyses were performed using the one-way ANOVA. Error bars represent mean ± SEM (n = 5). * p < 0.05, ** p < 0.01. (C,D) Immunohistochemical detection of TH and p-TH (S40) in the striatum. Scale bar = 500 μm. Quantification of the relative intensity of proteins was performed using ImageJ software. Data are presented as the fold change relative to the control group. Statistical analyses were performed using the one-way ANOVA. Error bars represent mean ± SEM (n = 5). * p < 0.05, ** p < 0.01. (E) Proposed mechanism by which miR-183-5p controls METH-induced locomotor activity.

Similar articles

Cited by

References

    1. Ago Y., Arikawa S., Yata M., Yano K., Abe M., Takuma K., et al. (2009). Role of prefrontal dopaminergic neurotransmission in glucocorticoid receptor-mediated modulation of methamphetamine-induced hyperactivity. Synapse 63 (1), 7–14. 10.1002/syn.20575 - DOI - PubMed
    1. Ambroggi F., Turiault M., Milet A., Deroche-Gamonet V., Parnaudeau S., Balado E., et al. (2009). Stress and addiction: glucocorticoid receptor in dopaminoceptive neurons facilitates cocaine seeking. Nat. Neurosci. 12 (3), 247–249. 10.1038/nn.2282 - DOI - PubMed
    1. Avila A. H., Morgan C. A., Bayer B. M. (2003). Stress-induced suppression of the immune system after withdrawal from chronic cocaine. J. Pharmacol. Exp. Ther. 305 (1), 290–297. 10.1124/jpet.102.045989 - DOI - PubMed
    1. Berridge K. C., Robinson T. E. (1998). What is the role of dopamine in reward: hedonic impact, reward learning, or incentive salience? Brain Res. Brain Res. Rev. 28 (3), 309–369. 10.1016/s0165-0173(98)00019-8 - DOI - PubMed
    1. Blind R. D., Garabedian M. J. (2008). Differential recruitment of glucocorticoid receptor phospho-isoforms to glucocorticoid-induced genes. J. Steroid Biochem. Mol. Biol. 109 (1-2), 150–157. 10.1016/j.jsbmb.2008.01.002 - DOI - PMC - PubMed