. 2022 Sep 26:9:987103.
doi: 10.3389/fnut.2022.987103. eCollection 2022.

Carotenoids in orange carrots mitigate non-alcoholic fatty liver disease progression

Affiliations

Carotenoids in orange carrots mitigate non-alcoholic fatty liver disease progression

Emilio Balbuena et al. Front Nutr. .

Abstract

Background: Carotenoids are abundant in colored fruits and vegetables. Non-alcoholic fatty liver disease (NAFLD) is a global burden and risk factor for end-stage hepatic diseases. This study aims to compare the anti-NAFLD efficacy between carotenoid-rich and carotenoid-deficient vegetables.

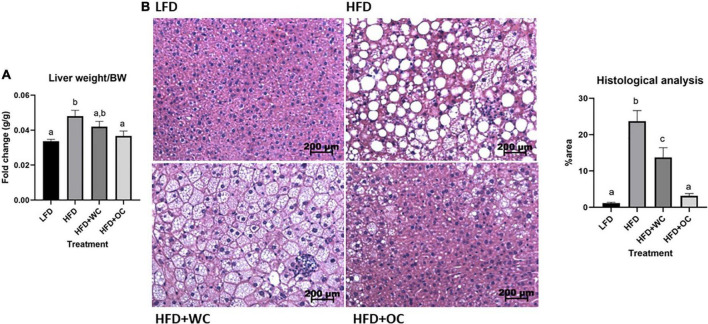
Materials and methods: Male C57BL/6J mice were randomized to one of four experimental diets for 15 weeks (n = 12 animals/group): Low-fat diet (LFD, 10% calories from fat), high-fat diet (HFD, 60% calories from fat), HFD with 20% white carrot powders (HFD + WC), or with 20% orange carrot powders (HFD + OC).

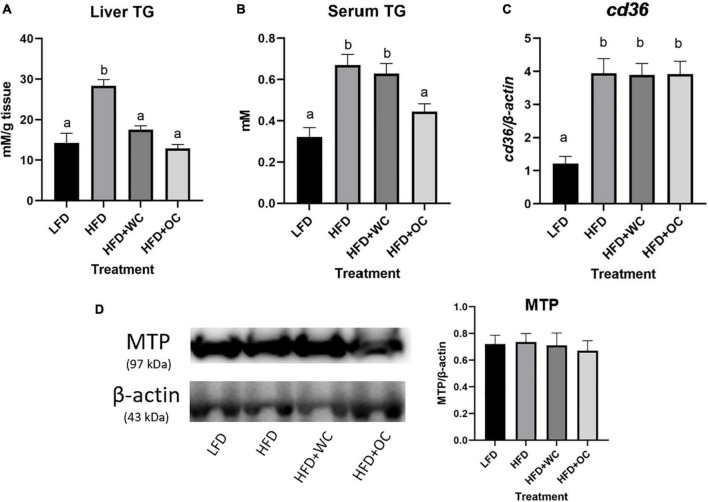
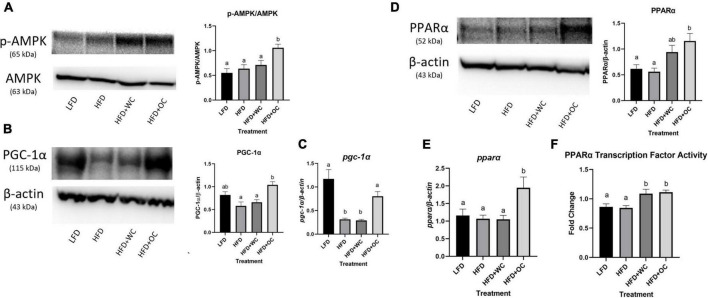
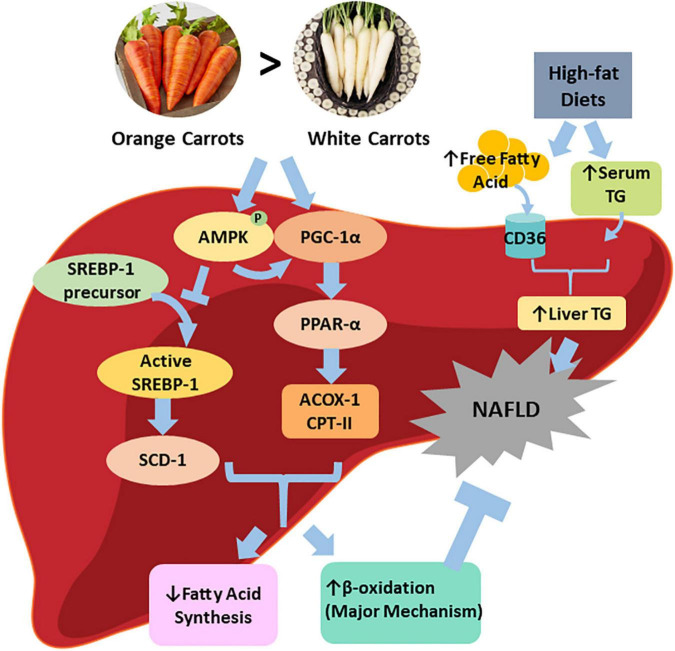
Results: We observed that carotenoids in the orange carrots reduced HFD-induced weight gain, better than white carrots. Histological and triglyceride (TG) analyses revealed significantly decreased HFD-induced hepatic lipid deposition and TG content in the HFD + WC group, which was further reduced in the HFD + OC group. Western blot analysis demonstrated inconsistent changes of fatty acid synthesis-related proteins but significantly improved ACOX-1 and CPT-II, indicating that orange carrot carotenoids had the potential to inhibit NAFLD by improving β-oxidation. Further investigation showed significantly higher mRNA and protein levels of PPARα and its transcription factor activity.

Conclusion: Carotenoid-rich foods may display more potent efficacy in mitigating NAFLD than those with low carotenoid levels.

Keywords: beta-oxidation; lipid metabolism; nuclear receptors; nutrition; phytochemicals.


Conflict of interest statement

The authors declare that the research was conducted in the absence of any commercial or financial relationships that could be construed as a potential conflict of interest.

Figures

FIGURE 1
FIGURE 1
Orange carrot-rich diet inhibited HFD-induced changes in body composition. LFD: n = 11; HFD, HFD + WC, HFD + OC: n = 12. (A) Weekly changes in body weight compared to baseline (week 0), *HFD vs. HFD + OC, p < 0.05; #HFD + WC vs. HFD + OC, p < 0.05. (B) Body weight change at endpoint (week 15) compared to baseline. (C) Change in fat mass determined by EchoMRI. (D) Fat mass percentage of Week 15 body weight. (E) Change in lean mass determined by EchoMRI. Values are means ± SEM. Body weight change was analyzed by two-way mixed ANOVA with post hoc Tukey HSD. Changes of body weight, fat mass and lean mass were analyzed by one-way ANOVA with post hoc Tukey HSD. Letter difference indicate statistical significance (p < 0.05).
FIGURE 2
FIGURE 2
Orange carrot-rich diet improved status of HFD-induced hepatic steatosis. (A) Graphical representation of liver weight-to-body weight (BW) ratio. LFD: n = 11; HFD, HFD + WC, HFD + OC: n = 12. (B) Hematoxylin and eosin (H&E) staining of livers, percentage of area covered by lipid deposits at 20 X magnification. Liver weight was analyzed by one-way ANOVA with post hoc Tukey HSD. Liver histology was analyzed by using the Kruskal-Wallis test with post hoc Tukey HSD. Letter differences indicate statistical significance (p < 0.05).
FIGURE 3
FIGURE 3
Hepatic and circulatory fat content. (A,B) Triglyceride (TG) content in panel (A) liver and (B) serum. For both liver and serum TG assay, LFD, HFD, HFD + WC, HFD + OC: n = 10. (C) Changes in mRNA levels in hepatic cd36 generated from qPCR. (D) Western blot of hepatic MTP protein expression performed with 3–8% tris-acetate gel, graphical changes between the dietary groups. For both western blot and qPCR assays, LFD: n = 11; HFD, HFD + WC, HFD + OC: n = 12. Values are means ± SEM. Data were analyzed by one-way ANOVA with post hoc Tukey HSD. Letter differences indicate statistical significance (p < 0.05).
FIGURE 4
FIGURE 4
Carotenoids minimally inhibit hepatic fatty acid synthesis. Western blot of hepatic (A) FAS, (B) SCD-1, (C) ACCα, (D) DGAT2, and (E) ratio of cleaved SREBP-1 to SREBP-1 precursor protein expression; blots in panels (A,C,E) performed with 3–8% tris-acetate gels; blots in panels (B,D) performed with 4–12% Bis-Tris gels; graphical changes between the dietary groups. (F) Changes in mRNA levels in hepatic fas, scd-1, and srebp-1 generated from qPCR. For both western blot and qPCR, LFD: n = 11; HFD, HFD + WC, HFD + OC: n = 12. The fold change of mRNA and protein levels were analyzed by one-way ANOVA with post hoc Tukey HSD. Letter differences indicate statistical significance (p < 0.05).
FIGURE 5
FIGURE 5
Carotenoids in HFD + OC diet promote hepatic β-oxidation. Western blot of (A) ACOX-1 and (C) CPT-II protein expression; performed with 4–12% Bis-Tris gels; graphical changes between the dietary groups. Changes in mRNA levels in hepatic (B) acox-1 and (D) cpt generated via qPCR. For both western blot and qPCR, LFD: n = 11; HFD, HFD + WC, HFD + OC: n = 12. The fold change of mRNA and protein levels were analyzed by one-way ANOVA with post hoc Tukey HSD. Letter differences indicate statistical significance (p < 0.05).
FIGURE 6
FIGURE 6
Carotenoids in HFD + OC diet enhance regulators of hepatic lipid metabolism. (A) Western blot of phosphorylated AMPK (p-AMPK) and total AMPK protein expression, performed with 4–12% Bis-Tris gel; statistical analysis of p-AMPK/AMPK ratio. (B) Western blot of PGC-1α protein expression, performed with 3–8% tris-acetate gel. (C) Changes in mRNA levels in hepatic pgc-1α. (D) Western blot of PPARα protein expression, performed with 4–12% Bis-Tris gel. (E) Changes in mRNA levels in hepatic pparα. For both western blot and qPCR, LFD: n = 11; HFD, HFD + WC, HFD + OC: n = 12. (F) Graphical changes in nuclear PPARα transcription factor activity. LFD, HFD, HFD + WC, HFD + OC: n = 10. Values are means ± SEM. The fold change of mRNA, protein, and PPARα transcription factor activity were analyzed by one-way ANOVA with post hoc Tukey HSD. Letter differences indicate statistical significance (p < 0.05).
FIGURE 7
FIGURE 7
Graphical representation of proposed pathway in which carotenoid-rich orange carrots alleviate NAFLD severity. Orange carrots rich in α-carotene and β-carotene combated the severity of hepatic steatosis brought on by a high-fat diet by partially inhibiting fatty acid synthesis and significantly enhancing β-oxidation proteins, due to promotion of master regulators of hepatic lipid metabolism (i.e., p-AMPK, PGC-1α, PPARα).

References

    1. Stefan N, Kantartzis K, Häring H-U. Causes and metabolic consequences of fatty liver. Endocrine Reviews. (2008) 29:939–60. 10.1210/er.2008-0009 - DOI - PubMed
    1. Perumpail BJ, Khan MA, Yoo ER, Cholankeril G, Kim D, Ahmed A. Clinical epidemiology and disease burden of nonalcoholic fatty liver disease. World J Gastroenterol. (2017) 23:8263–76. 10.3748/wjg.v23.i47.8263 - DOI - PMC - PubMed
    1. Blüher M. Obesity: global epidemiology and pathogenesis. Nat Rev Endocrinol. (2019) 15:288–98. 10.1038/s41574-019-0176-8 - DOI - PubMed
    1. Pais R, Pascale A, Fedchuck L, Charlotte F, Poynard T, Ratziu V. Progression from isolated steatosis to steatohepatitis and fibrosis in nonalcoholic fatty liver disease. Clin Res Hepatol Gastroenterol. (2011) 35:23–8. 10.1016/j.gcb.2010.06.004 - DOI - PubMed
    1. Adams LA, Lymp JF, St Sauver J, Sanderson SO, Lindor KD, Feldstein A, et al. The natural history of nonalcoholic fatty liver disease: a population-based cohort study. Gastroenterology. (2005) 129:113–21. 10.1053/j.gastro.2005.04.014 - DOI - PubMed